| Param | Original file | Final file |
|---|---|---|
| Filename | modeM0/AS1A07_018T02_9000003684_25171cztM0_level2.evt | modeM0/AS1A07_018T02_9000003684_25171cztM0_level2_quad_clean.evt |
| Size (bytes) | 511,917,120 | 82,762,560 |
| Size | 488.2 MB | 78.9 MB |
| Events in quadrant A | 3,507,277 | 527,013 |
| Events in quadrant B | 3,577,957 | 533,065 |
| Events in quadrant C | 3,991,781 | 509,049 |
| Events in quadrant D | 4,005,455 | 503,551 |
| Mode M9 | |||
|---|---|---|---|
| Quadrant | BADHDUFLAG | Total packets | Discarded packets |
| A | 0 | 14 | 0 |
| B | 0 | 15 | 0 |
| C | 0 | 15 | 0 |
| D | 0 | 15 | 0 |
| Mode M0 | |||
|---|---|---|---|
| Quadrant | BADHDUFLAG | Total packets | Discarded packets |
| A | 0 | 14555 | 0 |
| B | 0 | 14726 | 0 |
| C | 0 | 16228 | 0 |
| D | 0 | 16261 | 0 |
| Quadrant | Total seconds | Saturated seconds | Saturation percentage |
|---|---|---|---|
| A | 6213 | 73 | 1.174956% |
| B | 6212 | 92 | 1.481005% |
| C | 6212 | 186 | 2.994205% |
| D | 6212 | 123 | 1.980039% |
Noise dominated data is calculated using 1-second bins in cleaned event files. If a bin has >2000 counts, and if more than 50% of those come from <1% of pixels, then it is considered to be noise-dominated and hence unusable.
| Quadrant | # 1 sec bins | Bins with >0 counts | Bins with >2000 counts | High rate bins dominated by noise | Noise dominated (total time) | Noise dominated (detector-on time) | Marked lightcurve |
|---|---|---|---|---|---|---|---|
| A | 7533 | 6213 | 0 | 0 | 0.00% | 0.00% | 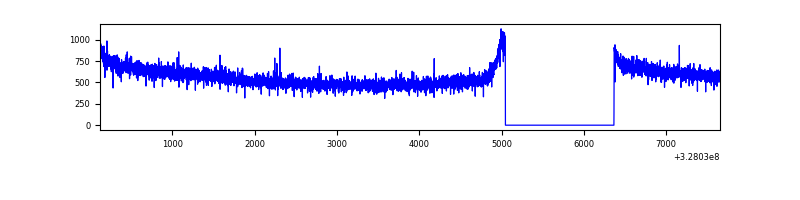 |
| B | 7532 | 6212 | 3 | 3 | 0.04% | 0.05% | 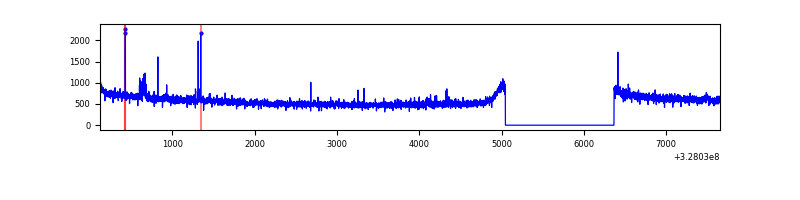 |
| C | 7532 | 6212 | 2 | 2 | 0.03% | 0.03% |  |
| D | 7532 | 6212 | 43 | 43 | 0.57% | 0.69% | 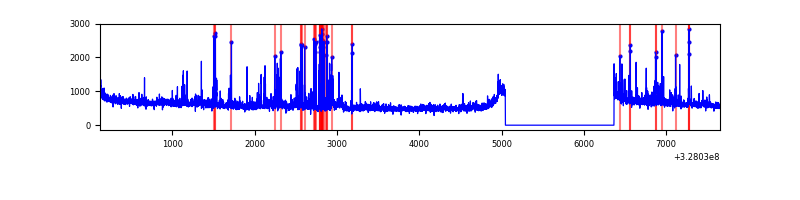 |
Top three noisy pixels from each quadrant. If the there are fewer than three noisy pixels in the level2.evt file, extra rows are filled as -1
| Pixel properties | Quadrant properties | ||||||
|---|---|---|---|---|---|---|---|
| Quadrant | DetID | PixID | Counts | Sigma | Mean | Median | Sigma |
| A | 13 | 254 | 10806 | 55.31 | 910 | 896 | 179.2 |
| A | 0 | 226 | 7779 | 38.42 | 910 | 896 | 179.2 |
| A | 3 | 137 | 7650 | 37.7 | 910 | 896 | 179.2 |
| B | 0 | 190 | 30745 | 177.66 | 904 | 884 | 168.1 |
| B | 12 | 111 | 19572 | 111.18 | 904 | 884 | 168.1 |
| B | 11 | 111 | 17426 | 98.42 | 904 | 884 | 168.1 |
| C | 7 | 247 | 333923 | 1655.27 | 880 | 892 | 201.2 |
| C | 14 | 238 | 143875 | 710.67 | 880 | 892 | 201.2 |
| C | 7 | 87 | 47726 | 232.78 | 880 | 892 | 201.2 |
| D | 1 | 52 | 267109 | 1250.68 | 894 | 870 | 212.9 |
| D | 12 | 233 | 160015 | 747.6 | 894 | 870 | 212.9 |
| D | 8 | 195 | 149881 | 699.99 | 894 | 870 | 212.9 |
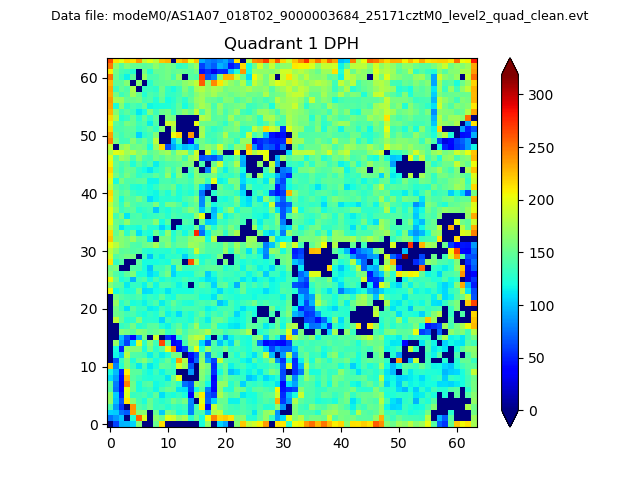
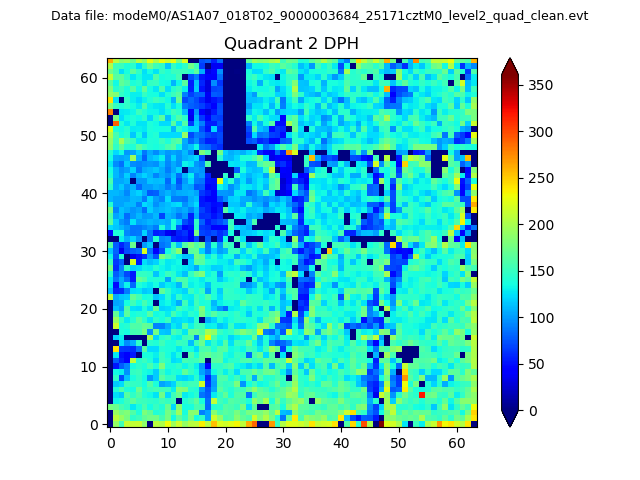
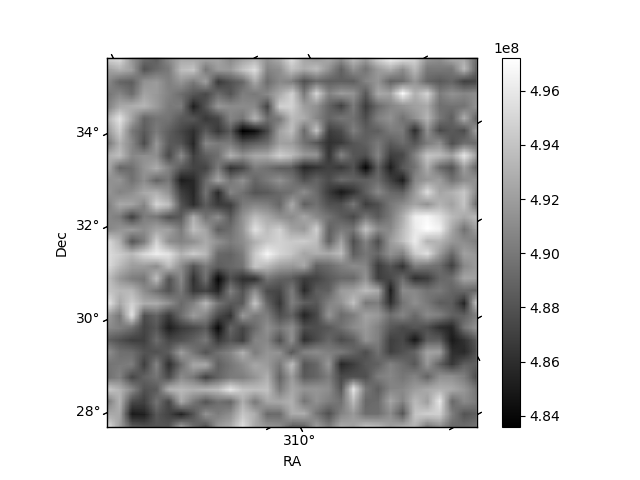
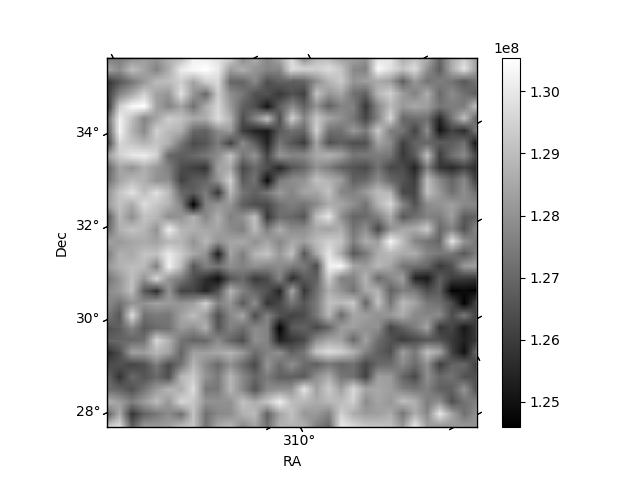
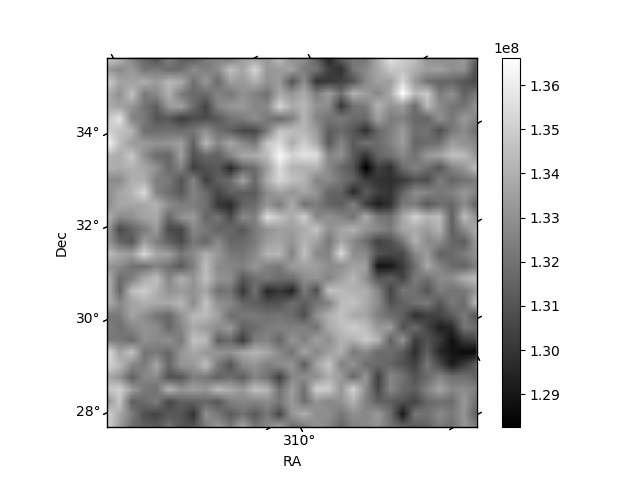
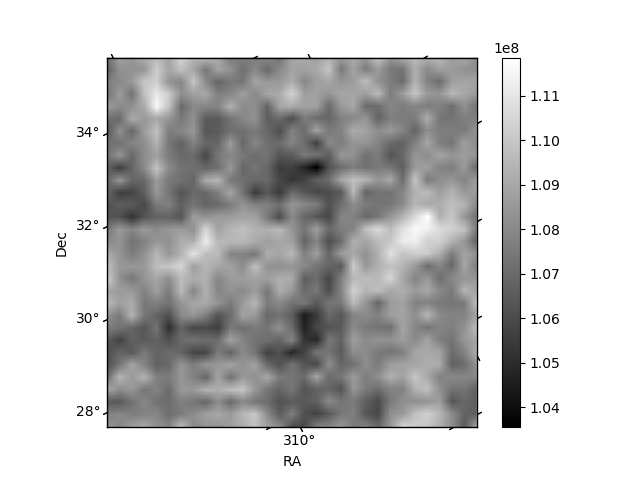
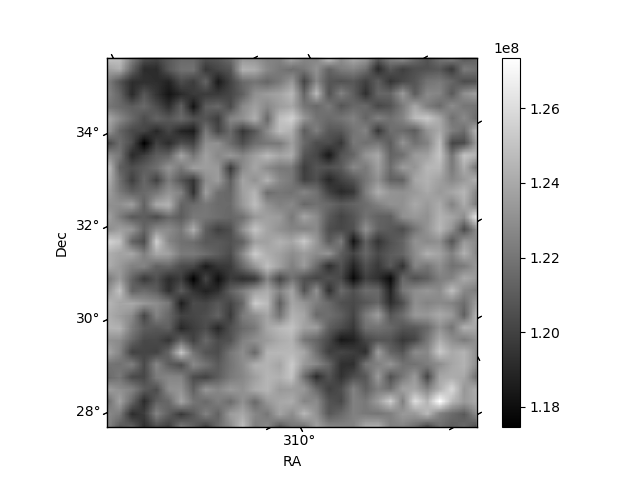
Histogram calculated using DETX and DETY for each event in the final _common_clean file
| Quadrant A | 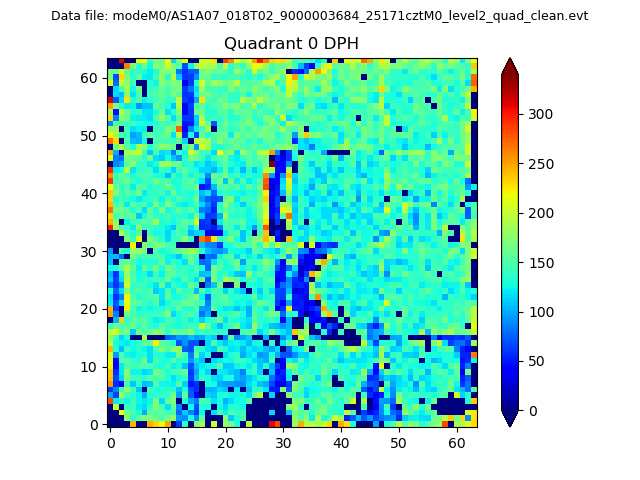 |
 |
Quadrant B |
|---|---|---|---|
| Quadrant D | 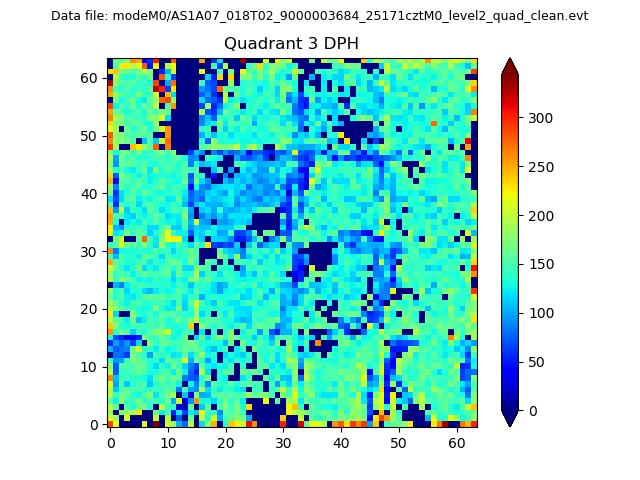 |
 |
Quadrant C |
| Plot type | Count rate plots | Images |
|---|---|---|
| Comparison with Poisson distribution Blue bars denote a histogram of data divided into 1 sec bins. Red curve is a Poisson curve with rate = median count rate of data. |
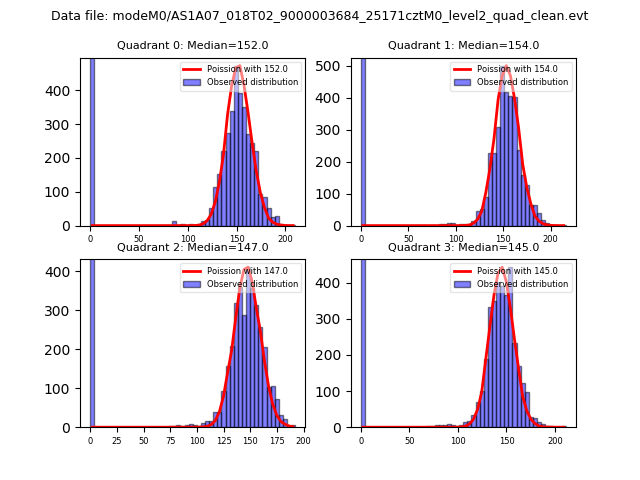 |
 |
| Quadrant-wise count rates Data is divided into 100 sec bins |
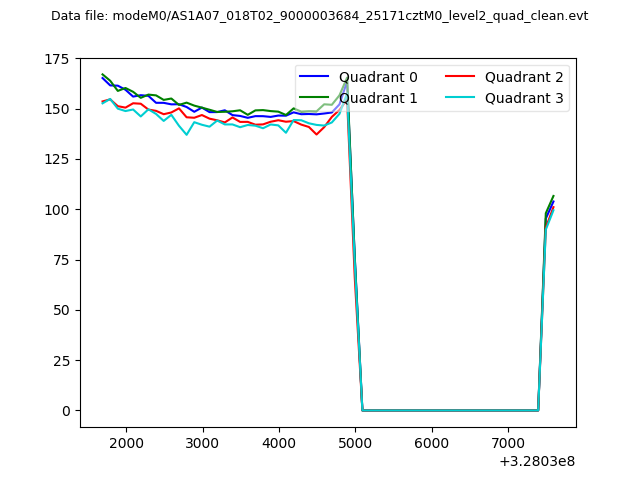 |
|
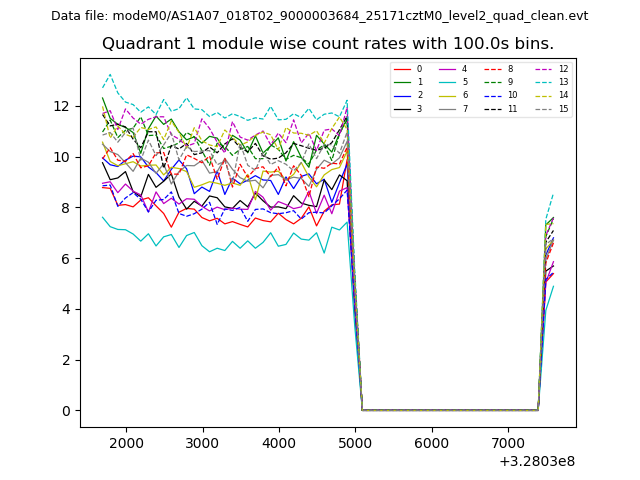
| Module-wise count rates for Quadrant A Data is divided into 100 sec bins |
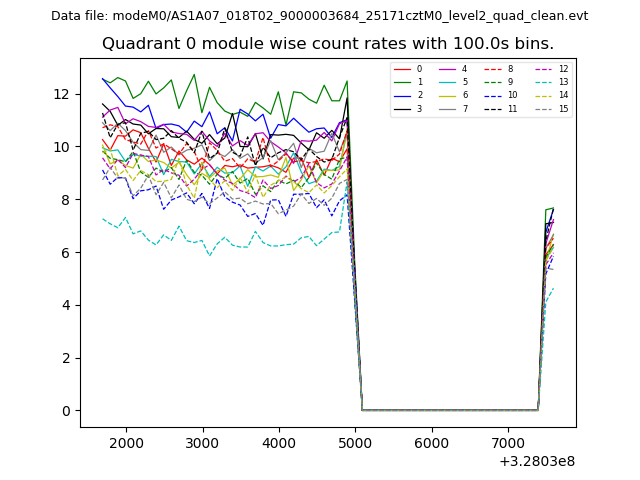 |
 |
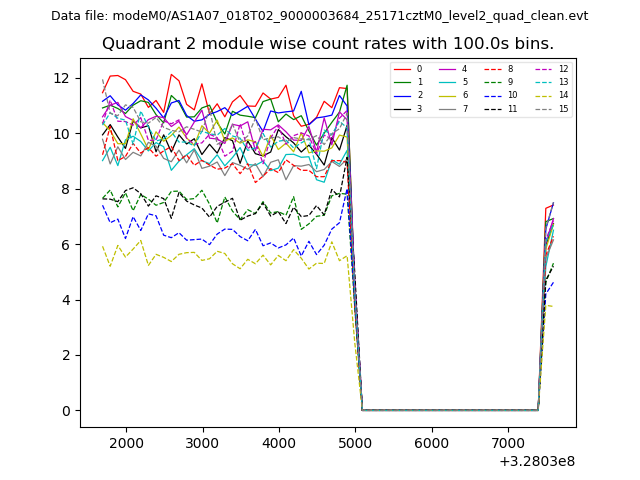
| Module-wise count rates for Quadrant B Data is divided into 100 sec bins |
 |
 |
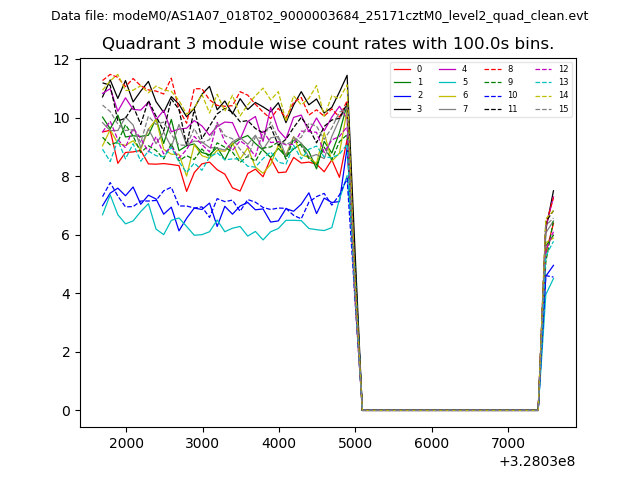
| Module-wise count rates for Quadrant C Data is divided into 100 sec bins |
 |
 |
| Module-wise count rates for Quadrant D Data is divided into 100 sec bins |
 |
 |
| Parameter | Plot |
|---|---|
| CZT HV Monitor | 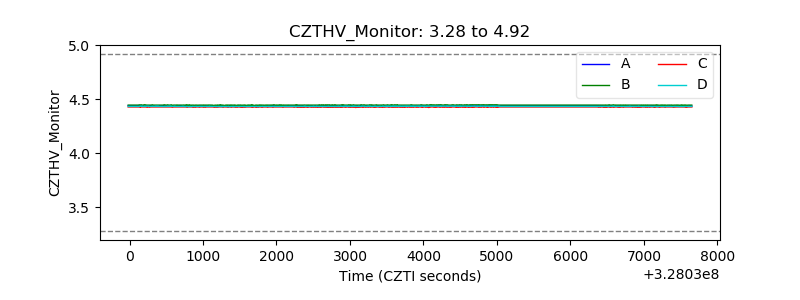 |
| D_VDD | 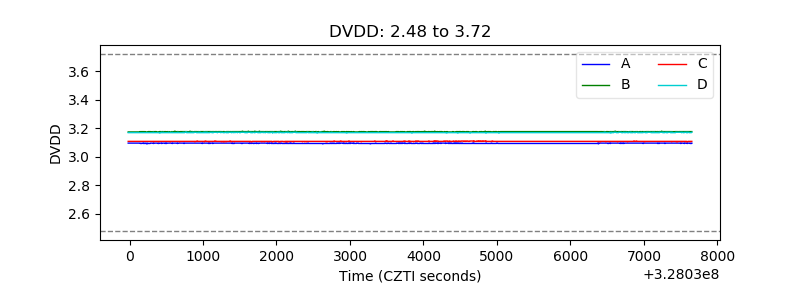 |
| Temperature 1 | 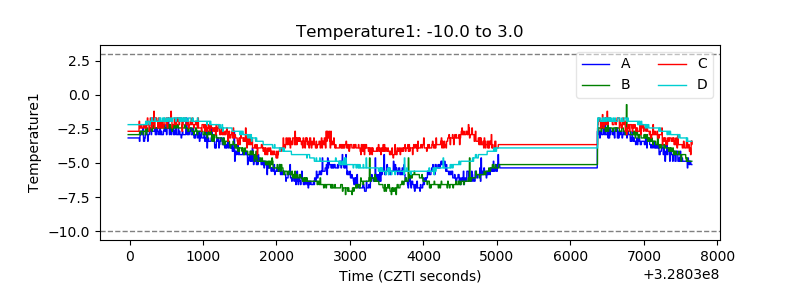 |
| Veto HV Monitor | 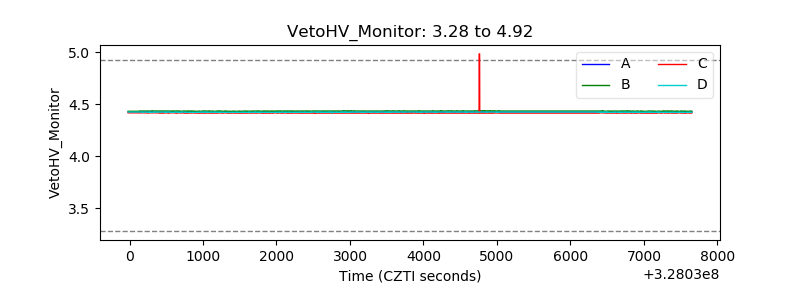 |
| Veto LLD | 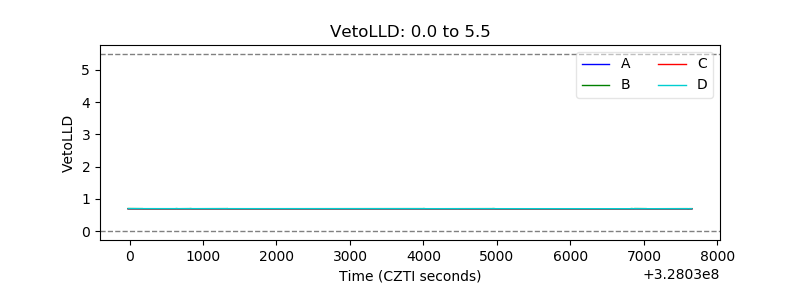 |
| Alpha Counter | 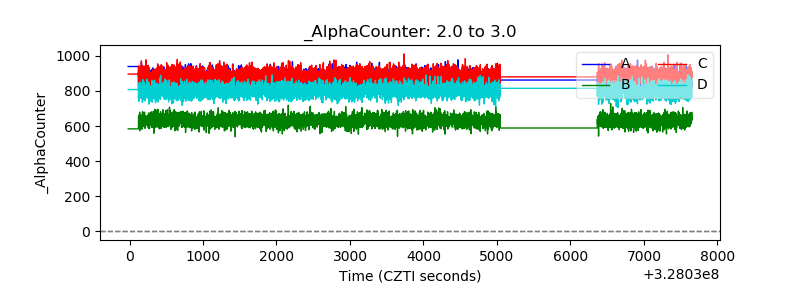 |
| _CPM_Rate | 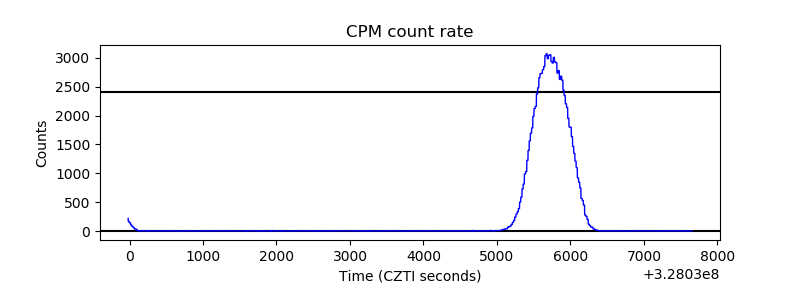 |
| CZT Counter | 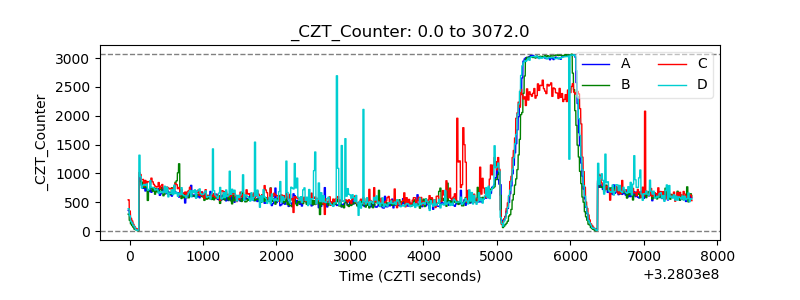 |
| +2.5 Volts monitor | 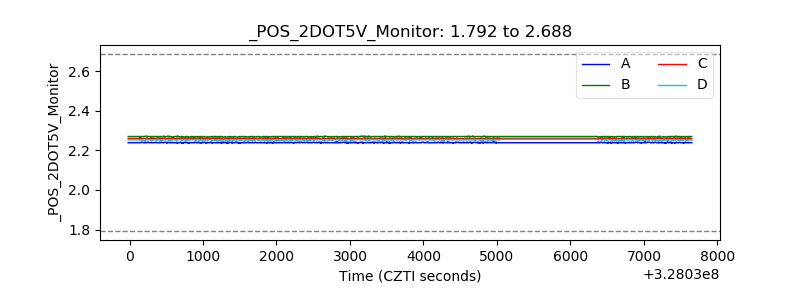 |
| +5 Volts monitor |  |
| _ROLL_ROT |  |
| _Roll_DEC | 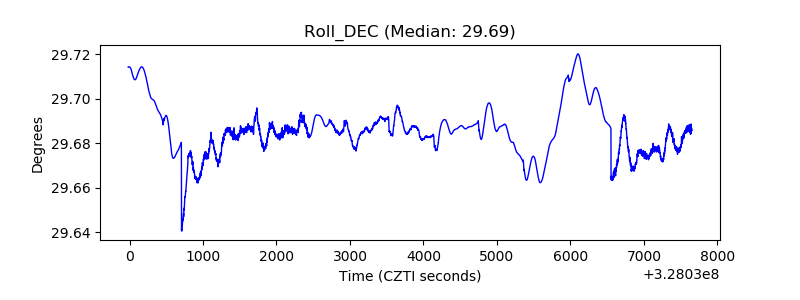 |
| _Roll_RA | 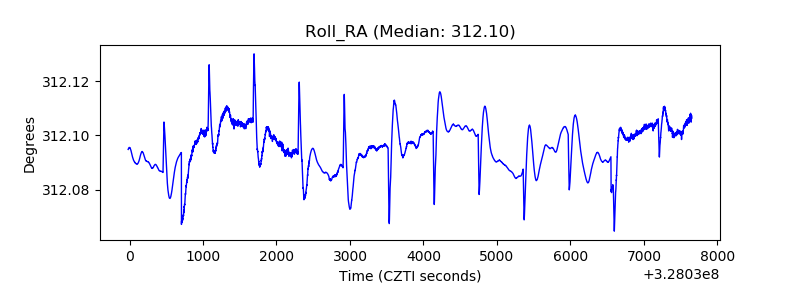 |
| Veto Counter | 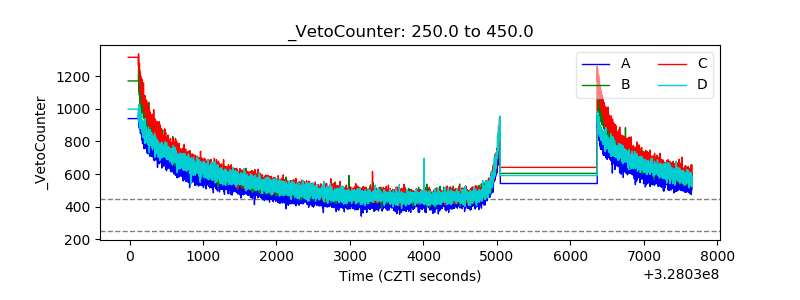 |