| Param | Original file | Final file |
|---|---|---|
| Filename | modeM0/AS1A07_018T02_9000003684_25172cztM0_level2.evt | modeM0/AS1A07_018T02_9000003684_25172cztM0_level2_quad_clean.evt |
| Size (bytes) | 510,624,000 | 99,195,840 |
| Size | 487.0 MB | 94.6 MB |
| Events in quadrant A | 3,413,033 | 648,810 |
| Events in quadrant B | 3,493,102 | 661,217 |
| Events in quadrant C | 3,776,082 | 634,523 |
| Events in quadrant D | 4,358,181 | 623,347 |
| Mode M9 | |||
|---|---|---|---|
| Quadrant | BADHDUFLAG | Total packets | Discarded packets |
| A | 0 | 13 | 0 |
| B | 0 | 13 | 0 |
| C | 0 | 13 | 0 |
| D | 0 | 13 | 0 |
| Mode M0 | |||
|---|---|---|---|
| Quadrant | BADHDUFLAG | Total packets | Discarded packets |
| A | 0 | 14192 | 0 |
| B | 0 | 14439 | 0 |
| C | 0 | 15407 | 0 |
| D | 0 | 17132 | 0 |
| Quadrant | Total seconds | Saturated seconds | Saturation percentage |
|---|---|---|---|
| A | 6246 | 74 | 1.184758% |
| B | 6246 | 96 | 1.536984% |
| C | 6246 | 181 | 2.897855% |
| D | 6246 | 306 | 4.899135% |
Noise dominated data is calculated using 1-second bins in cleaned event files. If a bin has >2000 counts, and if more than 50% of those come from <1% of pixels, then it is considered to be noise-dominated and hence unusable.
| Quadrant | # 1 sec bins | Bins with >0 counts | Bins with >2000 counts | High rate bins dominated by noise | Noise dominated (total time) | Noise dominated (detector-on time) | Marked lightcurve |
|---|---|---|---|---|---|---|---|
| A | 7581 | 6246 | 0 | 0 | 0.00% | 0.00% | 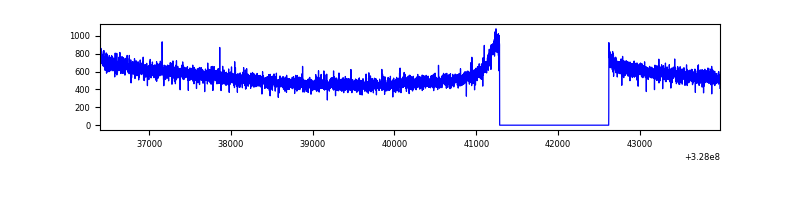 |
| B | 7581 | 6246 | 1 | 1 | 0.01% | 0.02% | 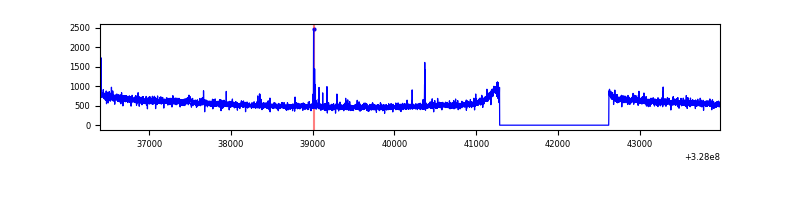 |
| C | 7581 | 6246 | 6 | 6 | 0.08% | 0.10% |  |
| D | 7581 | 6246 | 172 | 172 | 2.27% | 2.75% | 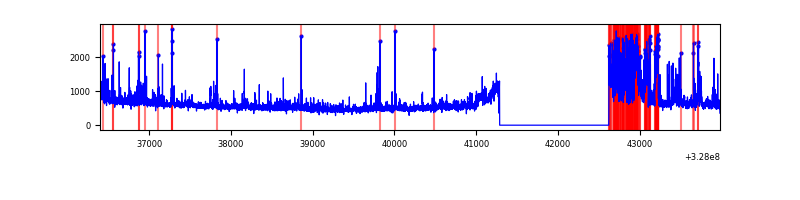 |
Top three noisy pixels from each quadrant. If the there are fewer than three noisy pixels in the level2.evt file, extra rows are filled as -1
| Pixel properties | Quadrant properties | ||||||
|---|---|---|---|---|---|---|---|
| Quadrant | DetID | PixID | Counts | Sigma | Mean | Median | Sigma |
| A | 13 | 254 | 11108 | 58.08 | 885 | 870 | 176.3 |
| A | 3 | 137 | 7655 | 38.49 | 885 | 870 | 176.3 |
| A | 0 | 226 | 7487 | 37.54 | 885 | 870 | 176.3 |
| B | 12 | 111 | 19111 | 111.3 | 884 | 866 | 163.9 |
| B | 11 | 111 | 17672 | 102.52 | 884 | 866 | 163.9 |
| B | 0 | 245 | 16924 | 97.96 | 884 | 866 | 163.9 |
| C | 7 | 247 | 179260 | 899.08 | 863 | 872 | 198.4 |
| C | 14 | 238 | 139935 | 700.88 | 863 | 872 | 198.4 |
| C | 0 | 207 | 43403 | 214.36 | 863 | 872 | 198.4 |
| D | 12 | 233 | 666239 | 3221.52 | 866 | 846 | 206.5 |
| D | 8 | 195 | 225933 | 1089.76 | 866 | 846 | 206.5 |
| D | 1 | 52 | 93505 | 448.61 | 866 | 846 | 206.5 |
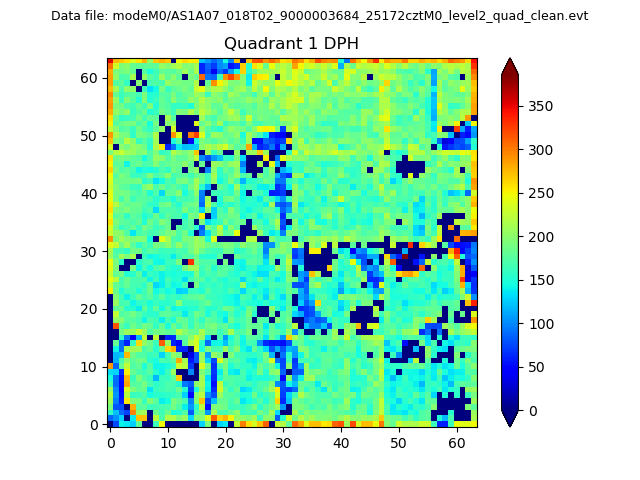
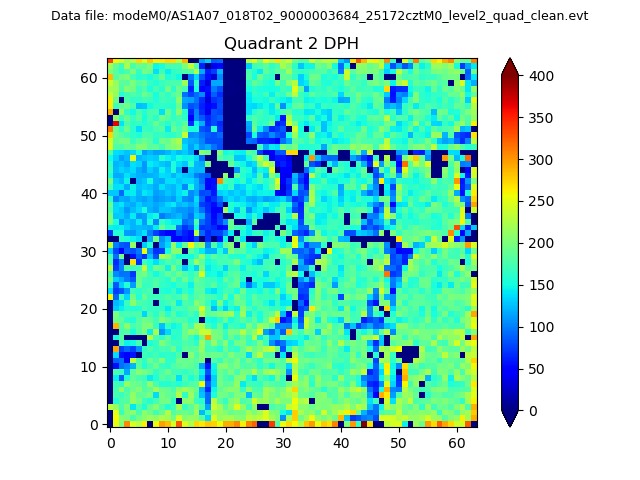
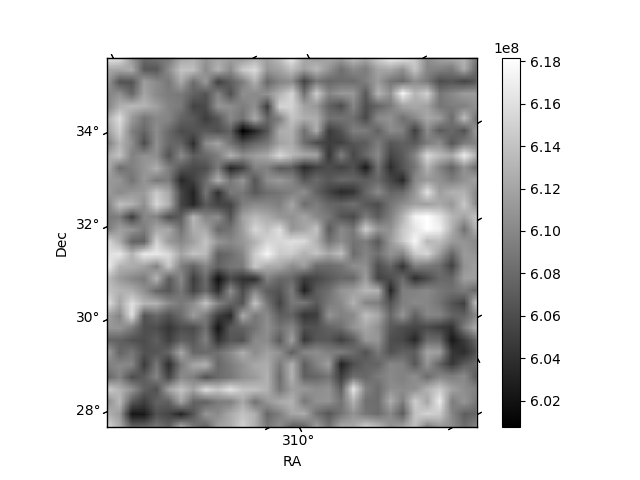
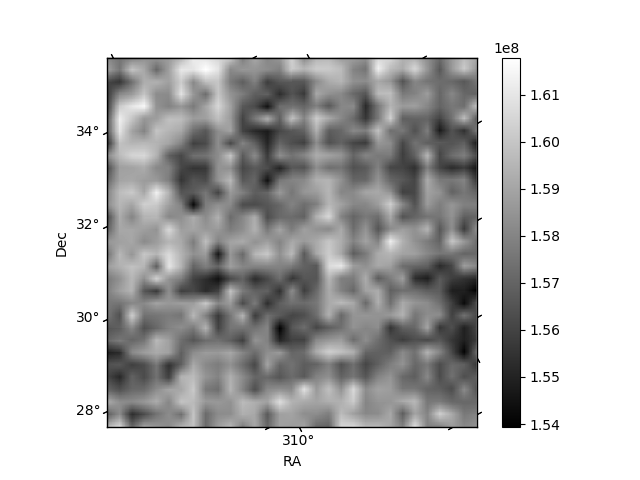
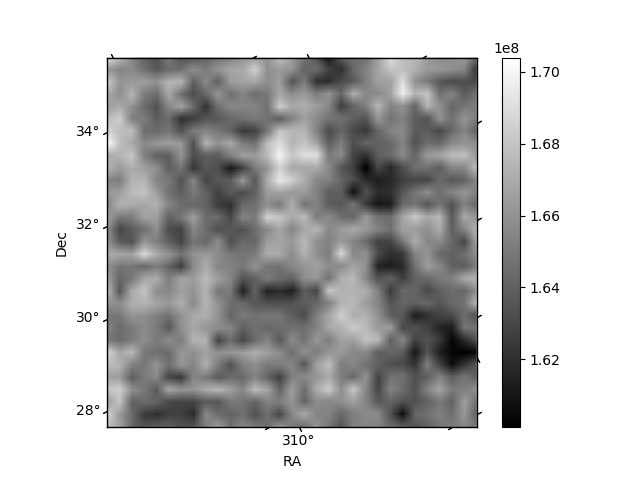
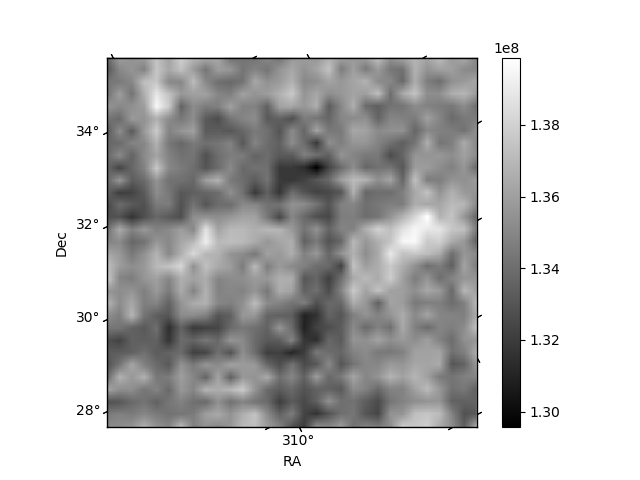
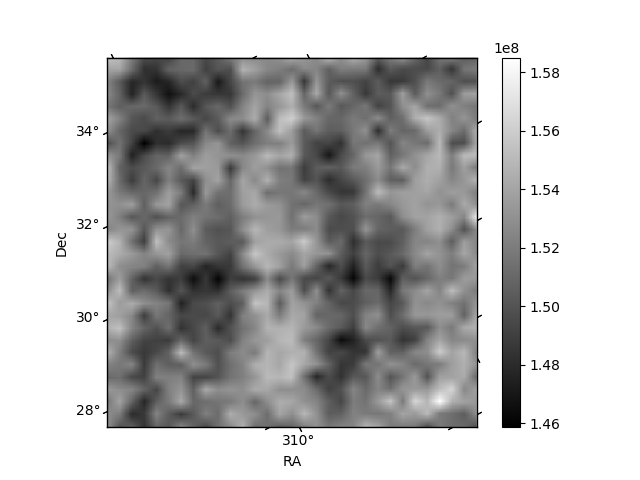
Histogram calculated using DETX and DETY for each event in the final _common_clean file
| Quadrant A | 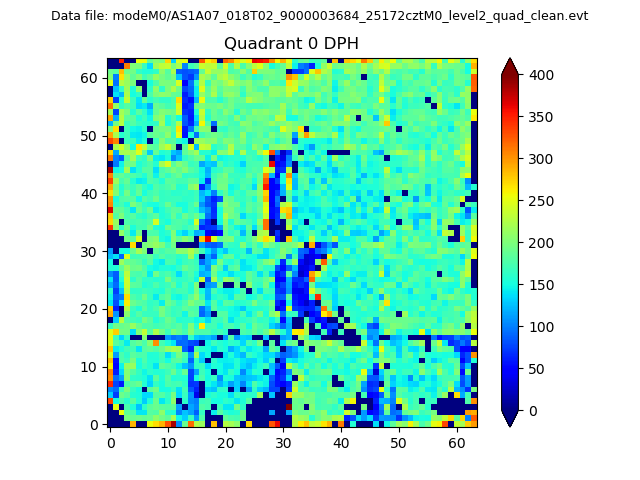 |
 |
Quadrant B |
|---|---|---|---|
| Quadrant D | 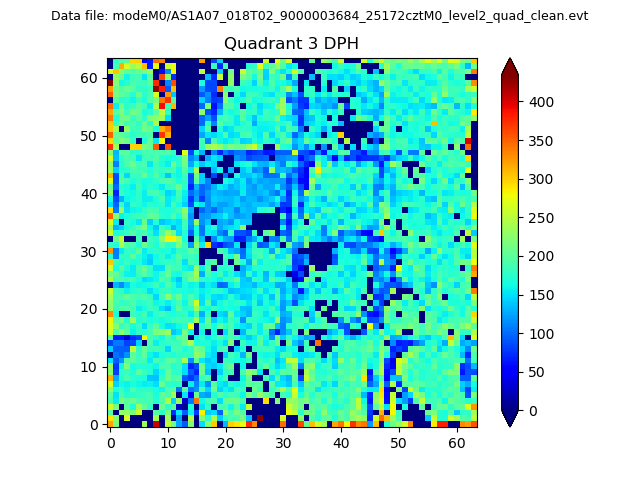 |
 |
Quadrant C |
| Plot type | Count rate plots | Images |
|---|---|---|
| Comparison with Poisson distribution Blue bars denote a histogram of data divided into 1 sec bins. Red curve is a Poisson curve with rate = median count rate of data. |
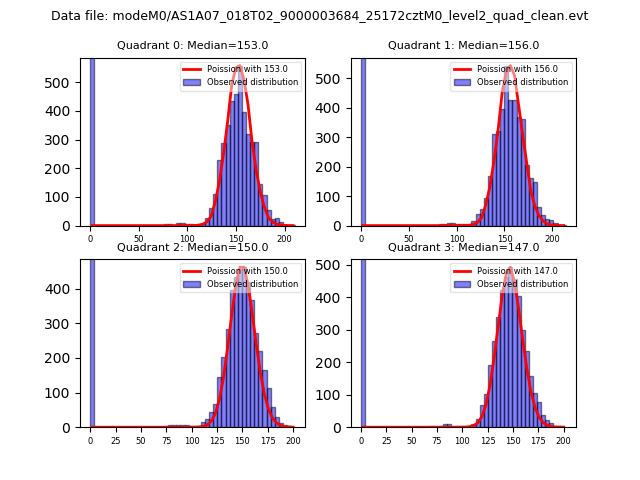 |
 |
| Quadrant-wise count rates Data is divided into 100 sec bins |
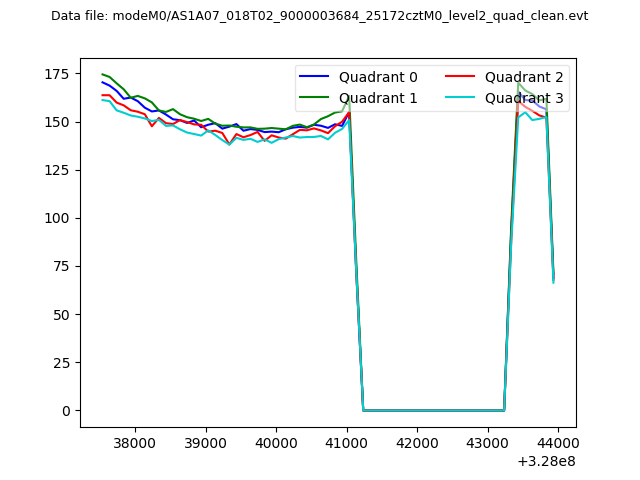 |
|
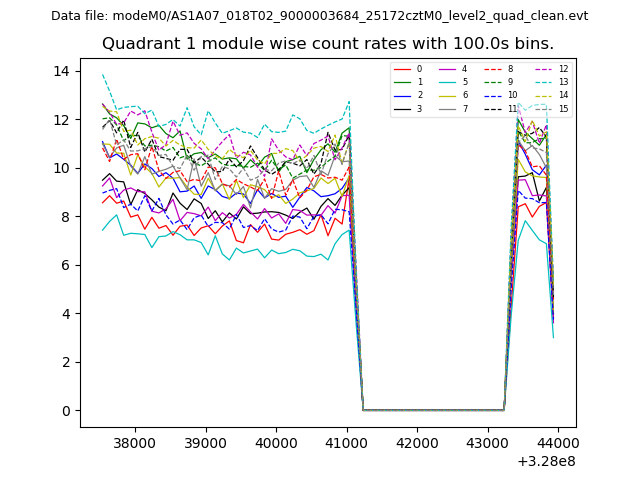
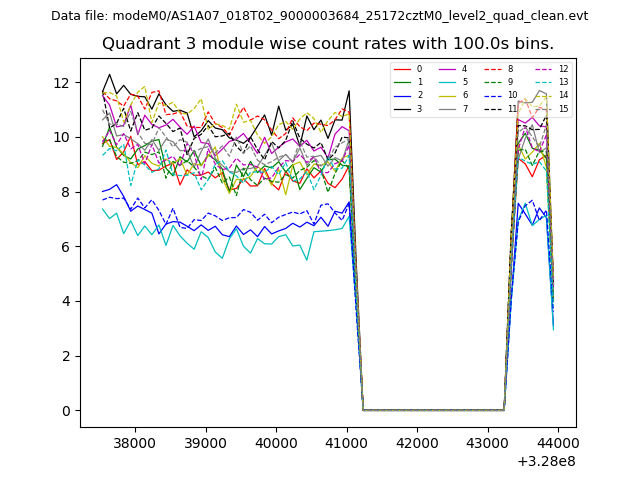
| Module-wise count rates for Quadrant A Data is divided into 100 sec bins |
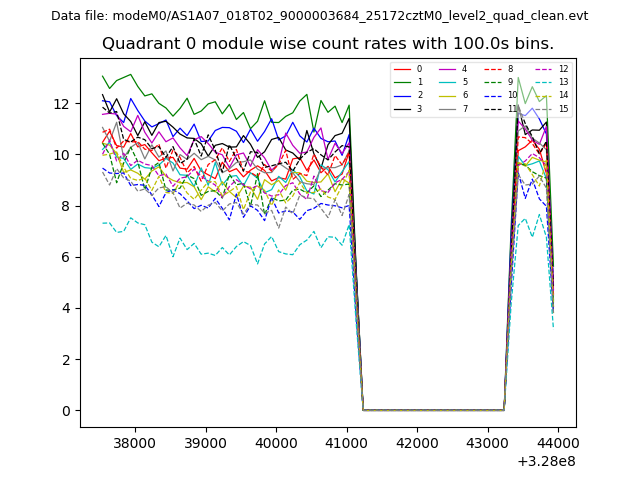 |
 |
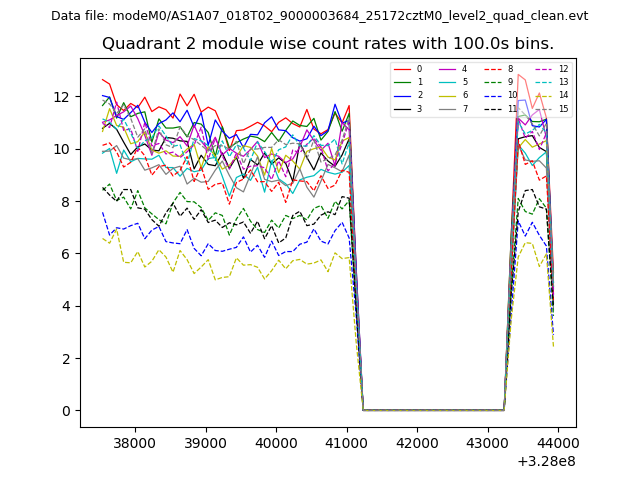
| Module-wise count rates for Quadrant B Data is divided into 100 sec bins |
 |
 |
| Module-wise count rates for Quadrant C Data is divided into 100 sec bins |
 |
 |
| Module-wise count rates for Quadrant D Data is divided into 100 sec bins |
 |
 |
| Parameter | Plot |
|---|---|
| CZT HV Monitor | 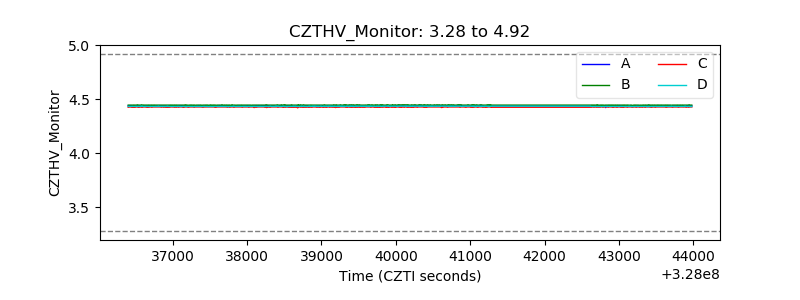 |
| D_VDD | 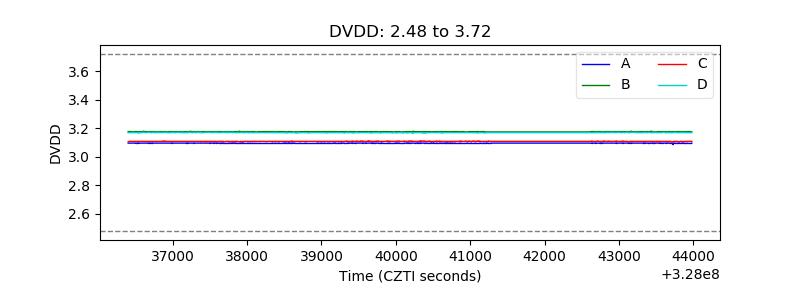 |
| Temperature 1 | 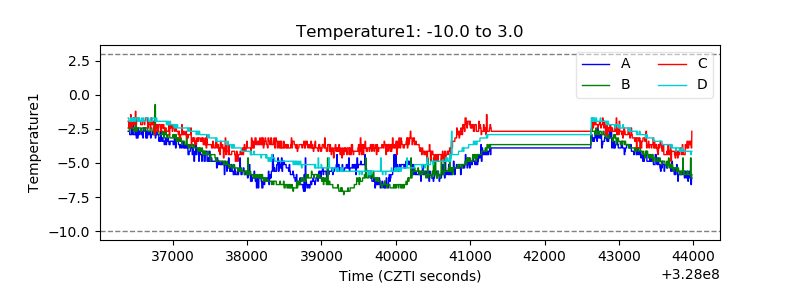 |
| Veto HV Monitor |  |
| Veto LLD | 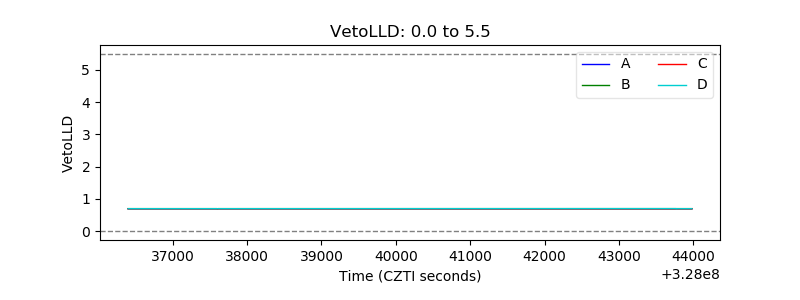 |
| Alpha Counter | 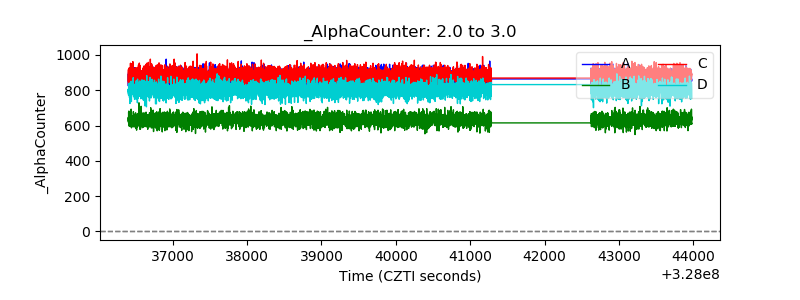 |
| _CPM_Rate | 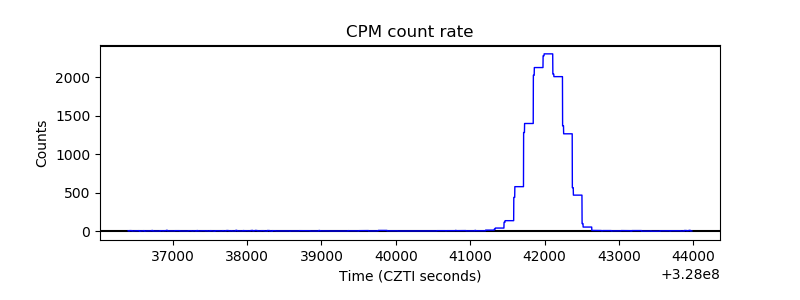 |
| CZT Counter | 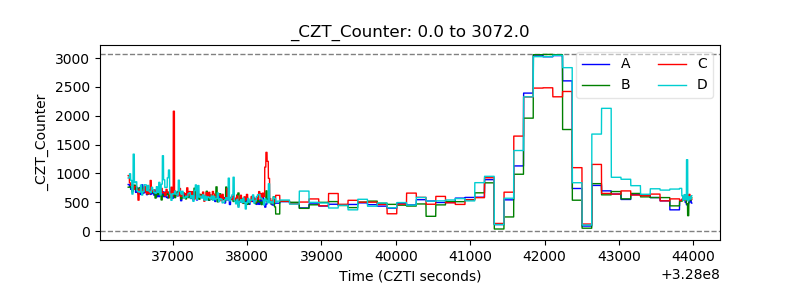 |
| +2.5 Volts monitor |  |
| +5 Volts monitor |  |
| _ROLL_ROT |  |
| _Roll_DEC | 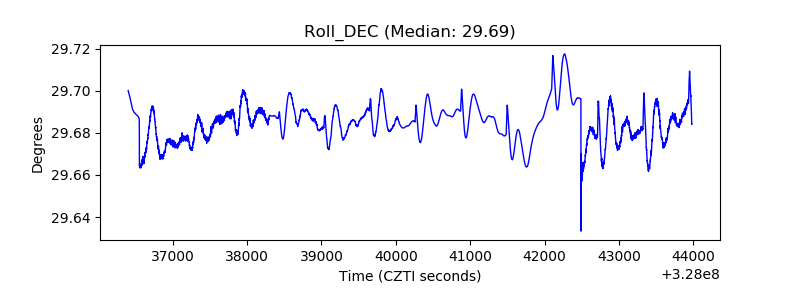 |
| _Roll_RA | 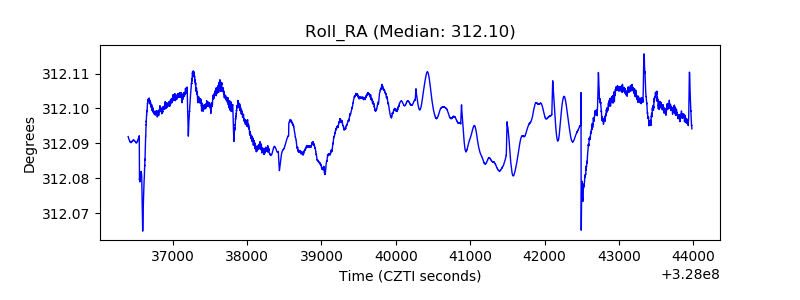 |
| Veto Counter | 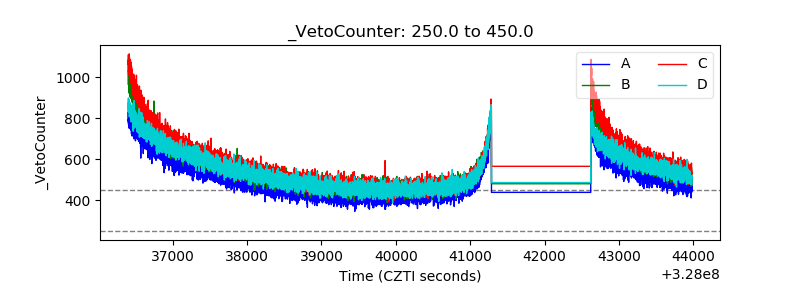 |