| Param | Original file | Final file |
|---|---|---|
| Filename | modeM0/AS1A07_018T02_9000003684_25174cztM0_level2.evt | modeM0/AS1A07_018T02_9000003684_25174cztM0_level2_quad_clean.evt |
| Size (bytes) | 481,161,600 | 95,270,400 |
| Size | 458.9 MB | 90.9 MB |
| Events in quadrant A | 3,102,956 | 623,012 |
| Events in quadrant B | 3,237,084 | 636,867 |
| Events in quadrant C | 3,579,092 | 611,814 |
| Events in quadrant D | 4,247,101 | 595,938 |
| Mode M9 | |||
|---|---|---|---|
| Quadrant | BADHDUFLAG | Total packets | Discarded packets |
| A | 0 | 12 | 0 |
| B | 0 | 12 | 0 |
| C | 0 | 12 | 0 |
| D | 0 | 12 | 0 |
| Mode M0 | |||
|---|---|---|---|
| Quadrant | BADHDUFLAG | Total packets | Discarded packets |
| A | 0 | 13015 | 0 |
| B | 0 | 13325 | 0 |
| C | 0 | 14689 | 0 |
| D | 0 | 16649 | 0 |
| Quadrant | Total seconds | Saturated seconds | Saturation percentage |
|---|---|---|---|
| A | 5976 | 46 | 0.769746% |
| B | 5976 | 71 | 1.188086% |
| C | 5977 | 143 | 2.392505% |
| D | 5977 | 364 | 6.090012% |
Noise dominated data is calculated using 1-second bins in cleaned event files. If a bin has >2000 counts, and if more than 50% of those come from <1% of pixels, then it is considered to be noise-dominated and hence unusable.
| Quadrant | # 1 sec bins | Bins with >0 counts | Bins with >2000 counts | High rate bins dominated by noise | Noise dominated (total time) | Noise dominated (detector-on time) | Marked lightcurve |
|---|---|---|---|---|---|---|---|
| A | 7216 | 5977 | 0 | 0 | 0.00% | 0.00% | 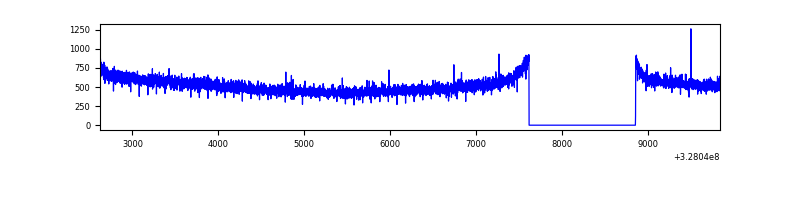 |
| B | 7216 | 5977 | 2 | 2 | 0.03% | 0.03% | 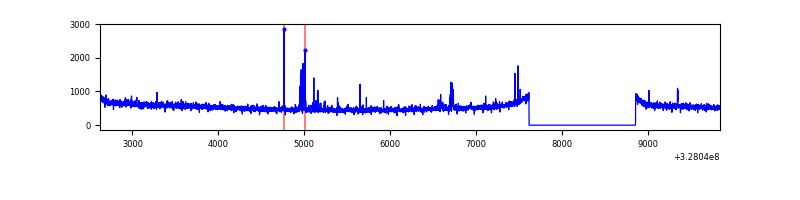 |
| C | 7217 | 5978 | 7 | 7 | 0.10% | 0.12% |  |
| D | 7217 | 5978 | 232 | 232 | 3.21% | 3.88% | 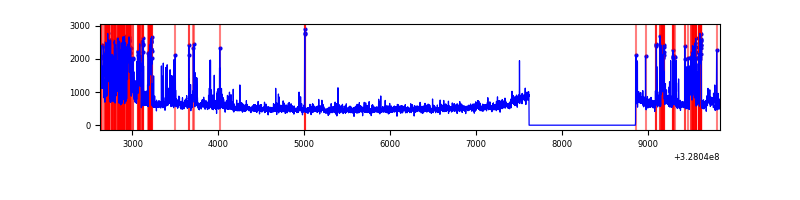 |
Top three noisy pixels from each quadrant. If the there are fewer than three noisy pixels in the level2.evt file, extra rows are filled as -1
| Pixel properties | Quadrant properties | ||||||
|---|---|---|---|---|---|---|---|
| Quadrant | DetID | PixID | Counts | Sigma | Mean | Median | Sigma |
| A | 13 | 254 | 10324 | 59.34 | 804 | 789 | 160.7 |
| A | 3 | 137 | 7122 | 39.41 | 804 | 789 | 160.7 |
| A | 0 | 226 | 6770 | 37.22 | 804 | 789 | 160.7 |
| B | 3 | 64 | 74570 | 485.96 | 805 | 786 | 151.8 |
| B | 12 | 111 | 17907 | 112.76 | 805 | 786 | 151.8 |
| B | 11 | 111 | 16481 | 103.37 | 805 | 786 | 151.8 |
| C | 7 | 247 | 289458 | 1567.16 | 787 | 794 | 184.2 |
| C | 14 | 238 | 125251 | 675.68 | 787 | 794 | 184.2 |
| C | 8 | 208 | 33820 | 179.3 | 787 | 794 | 184.2 |
| D | 12 | 233 | 753478 | 3974.38 | 780 | 760 | 189.4 |
| D | 8 | 195 | 269387 | 1418.36 | 780 | 760 | 189.4 |
| D | 1 | 52 | 220648 | 1161.02 | 780 | 760 | 189.4 |
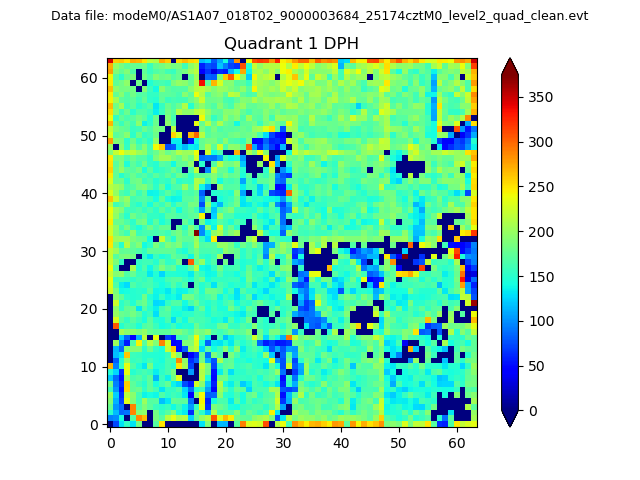
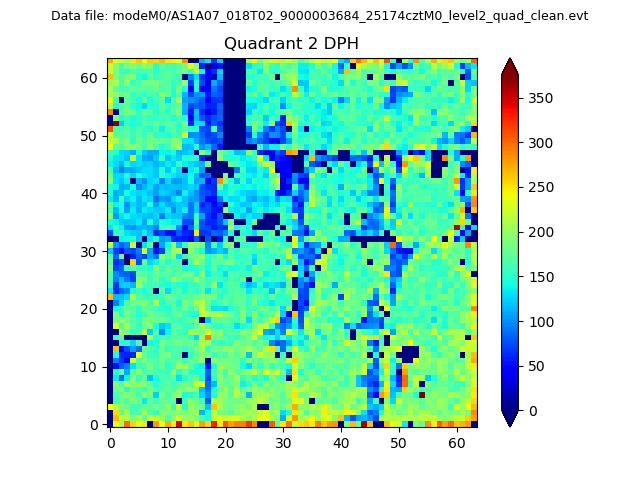
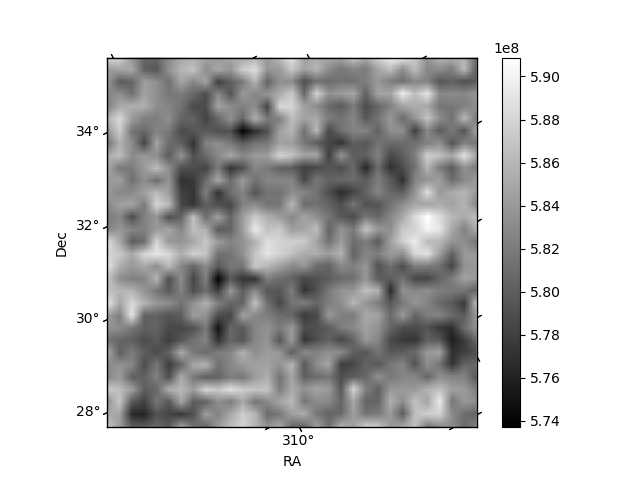
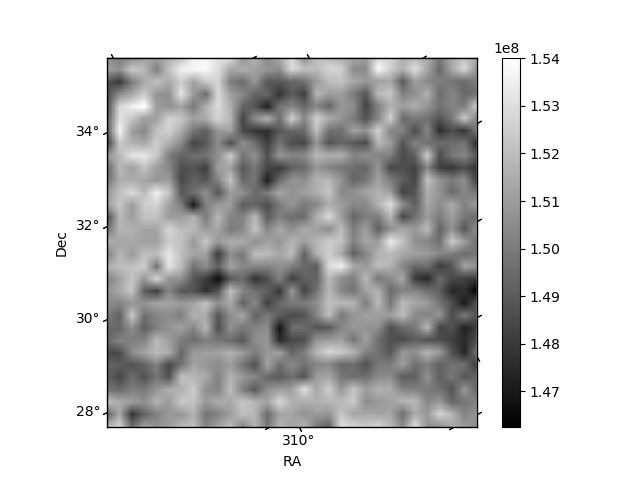
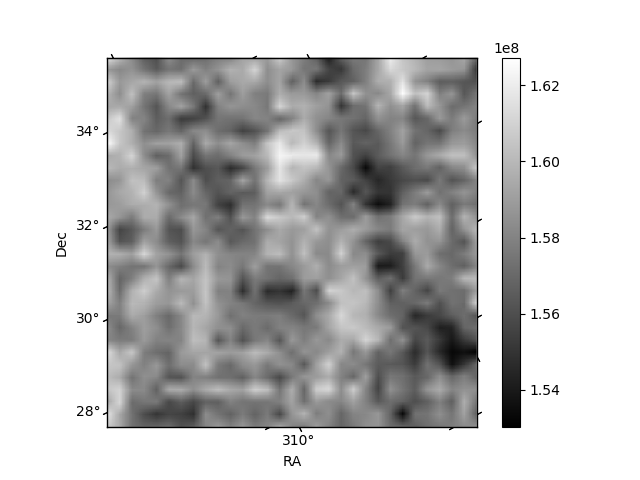
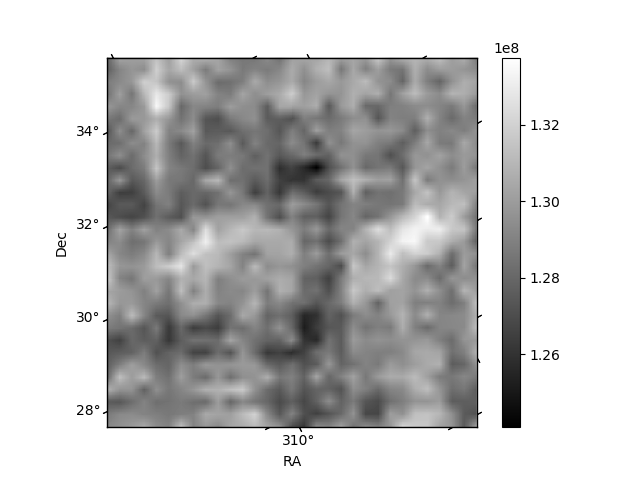
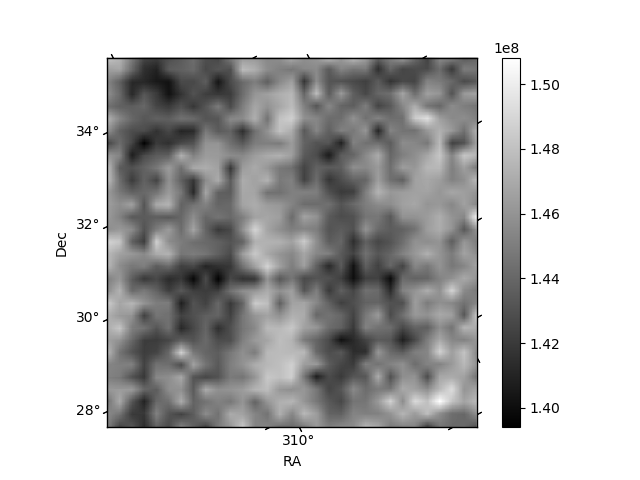
Histogram calculated using DETX and DETY for each event in the final _common_clean file
| Quadrant A | 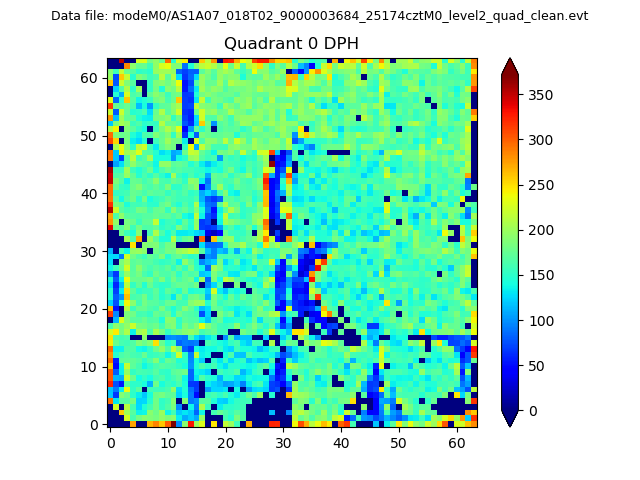 |
 |
Quadrant B |
|---|---|---|---|
| Quadrant D | 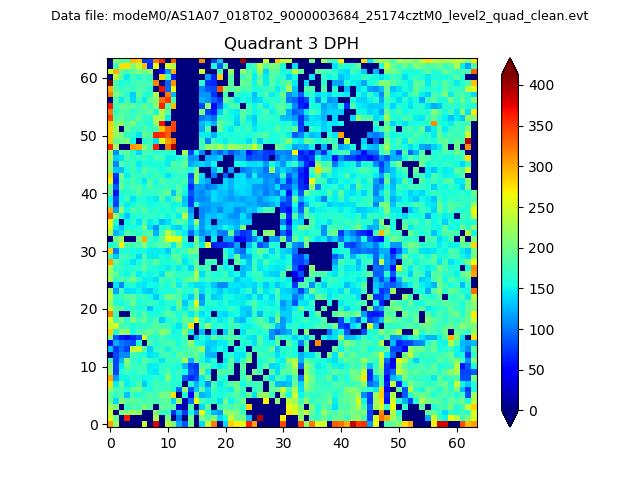 |
 |
Quadrant C |
| Plot type | Count rate plots | Images |
|---|---|---|
| Comparison with Poisson distribution Blue bars denote a histogram of data divided into 1 sec bins. Red curve is a Poisson curve with rate = median count rate of data. |
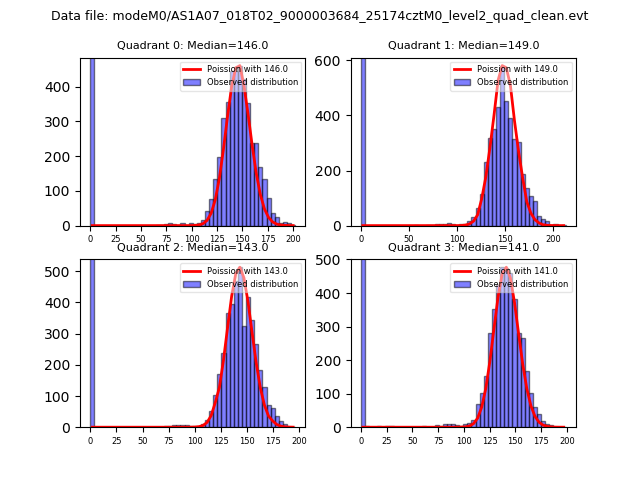 |
 |
| Quadrant-wise count rates Data is divided into 100 sec bins |
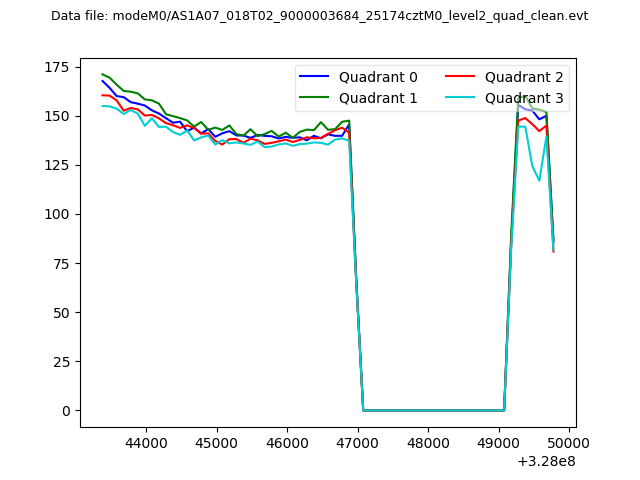 |
|
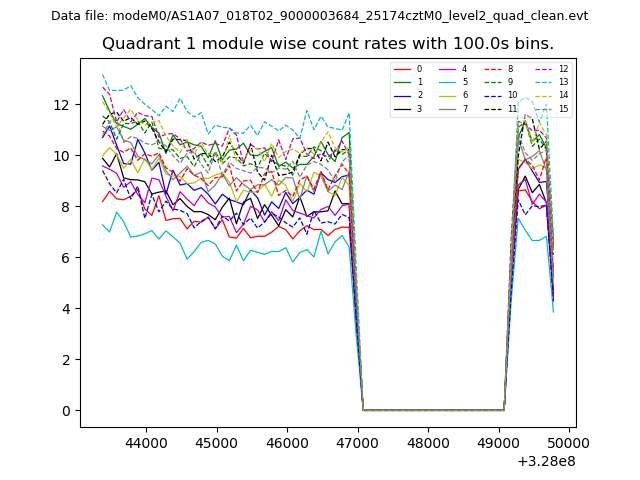
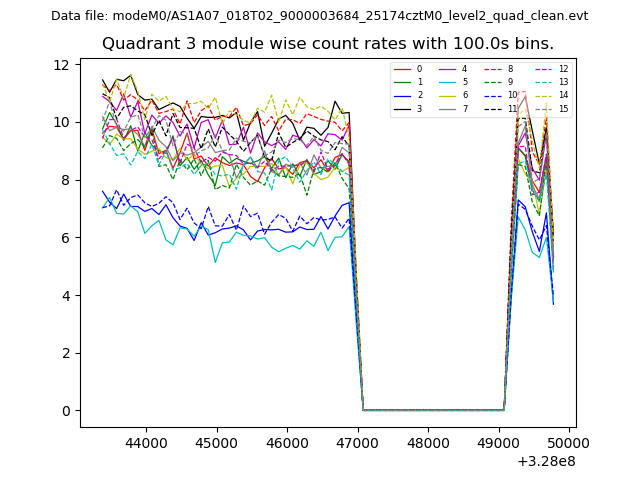
| Module-wise count rates for Quadrant A Data is divided into 100 sec bins |
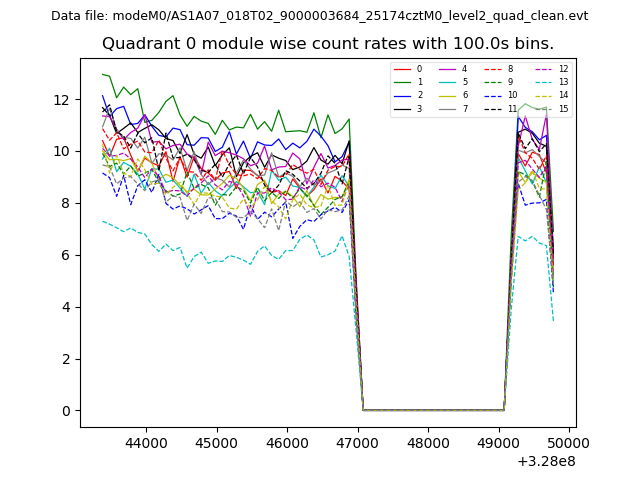 |
 |
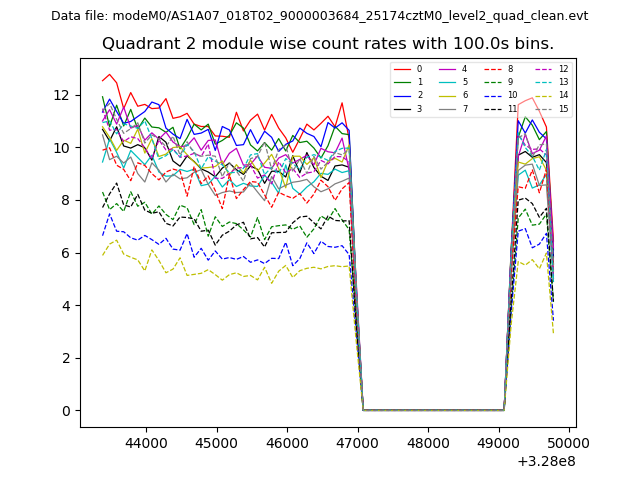
| Module-wise count rates for Quadrant B Data is divided into 100 sec bins |
 |
 |
| Module-wise count rates for Quadrant C Data is divided into 100 sec bins |
 |
 |
| Module-wise count rates for Quadrant D Data is divided into 100 sec bins |
 |
 |
| Parameter | Plot |
|---|---|
| CZT HV Monitor | 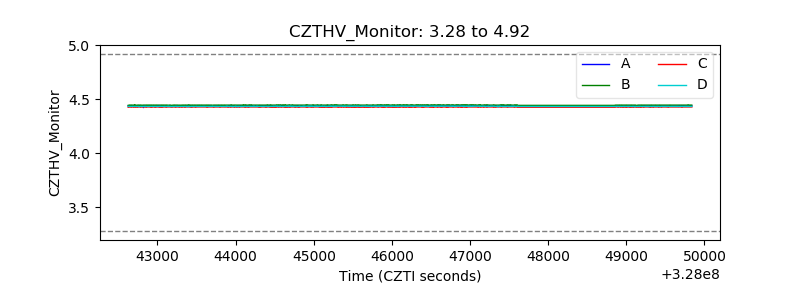 |
| D_VDD | 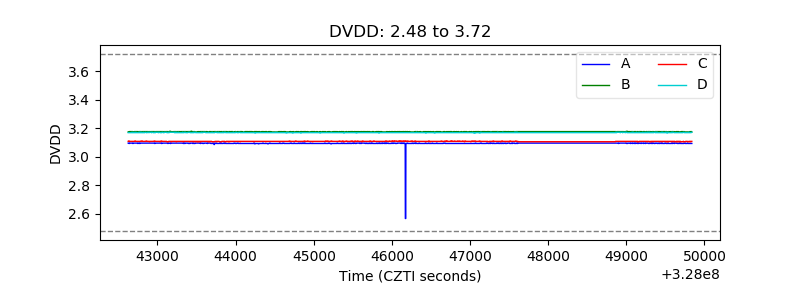 |
| Temperature 1 | 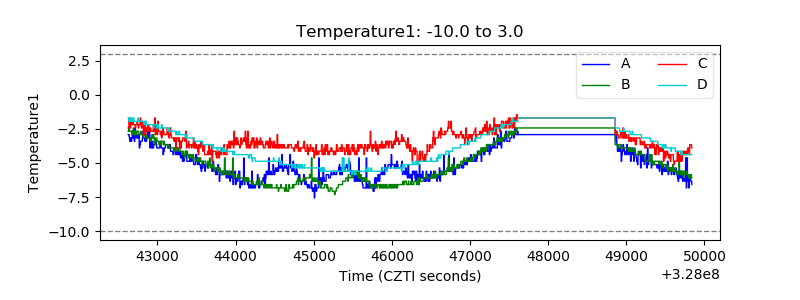 |
| Veto HV Monitor | 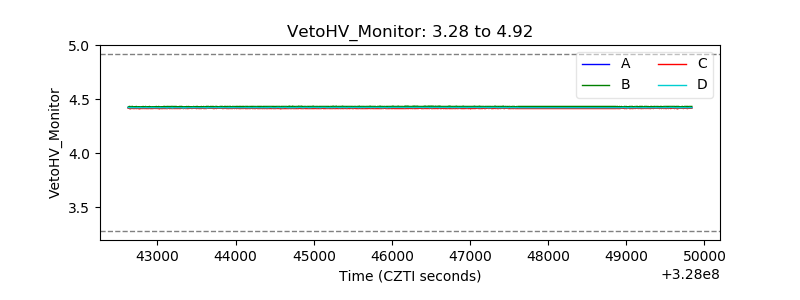 |
| Veto LLD | 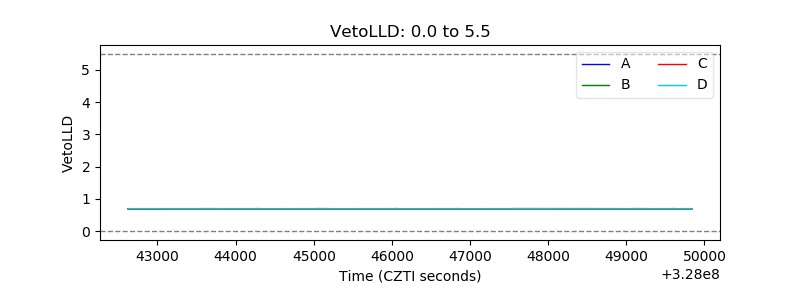 |
| Alpha Counter | 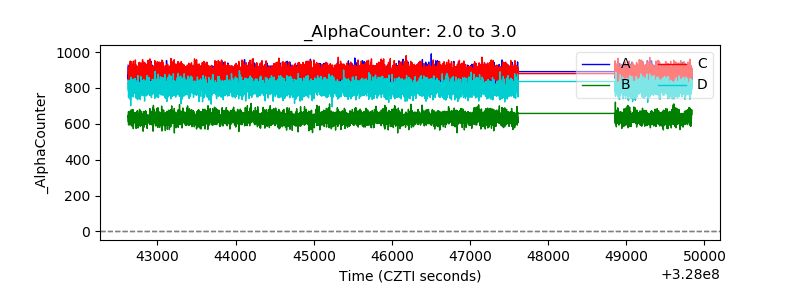 |
| _CPM_Rate | 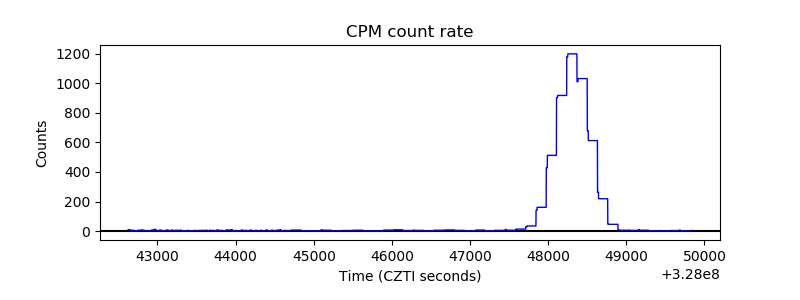 |
| CZT Counter | 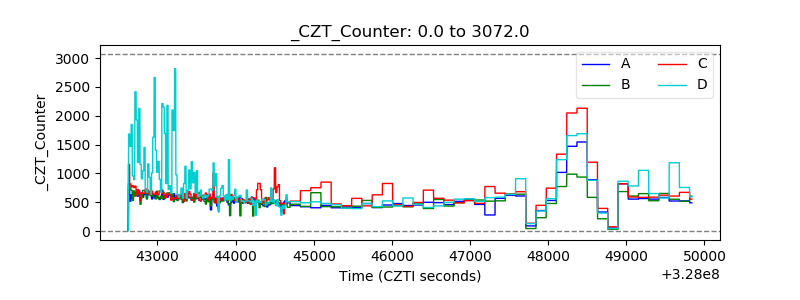 |
| +2.5 Volts monitor |  |
| +5 Volts monitor |  |
| _ROLL_ROT | 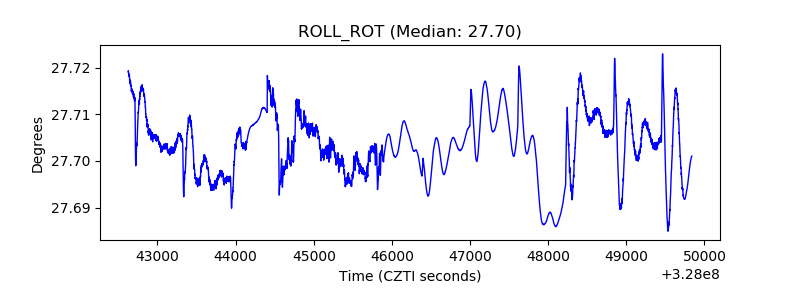 |
| _Roll_DEC | 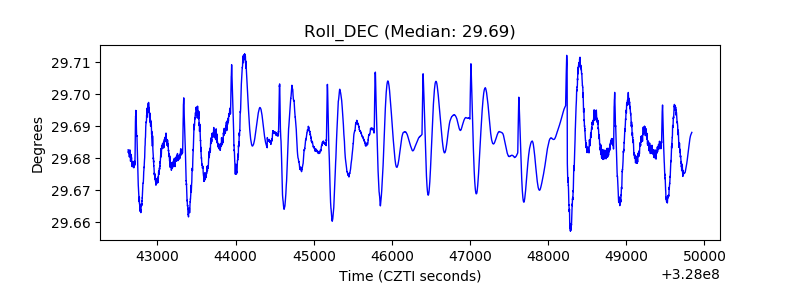 |
| _Roll_RA | 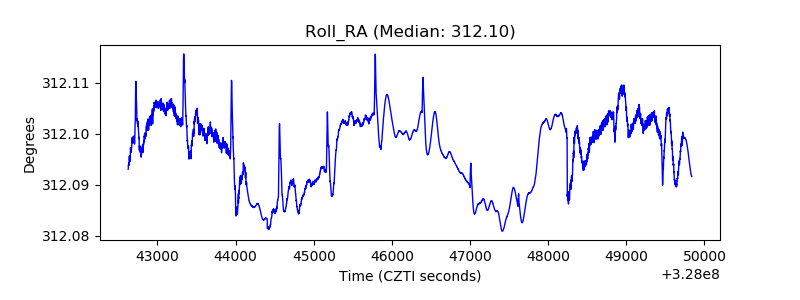 |
| Veto Counter | 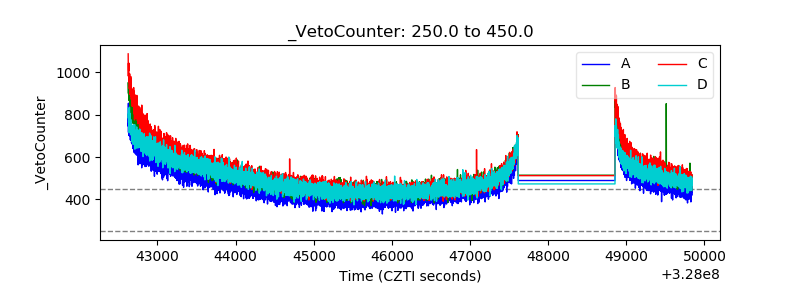 |