| Param | Original file | Final file |
|---|---|---|
| Filename | modeM0/AS1A07_018T09_9000003682cztM0_level2.fits | modeM0/AS1A07_018T09_9000003682cztM0_level2_quad_clean.evt |
| Size (bytes) | 511,902,720 | 408,778,560 |
| Size | 488.2 MB | 389.8 MB |
| Events in quadrant A | 3,207,792 | 2,359,603 |
| Events in quadrant B | 3,083,726 | 2,364,800 |
| Events in quadrant C | 3,106,226 | 2,209,900 |
| Events in quadrant D | 2,709,712 | 2,048,534 |
| Mode SS | |||
|---|---|---|---|
| Quadrant | BADHDUFLAG | Total packets | Discarded packets |
| A | 0 | 1008 | 0 |
| B | 0 | 1008 | 0 |
| C | 0 | 1008 | 0 |
| D | 0 | 1008 | 0 |
| Mode M0 | |||
|---|---|---|---|
| Quadrant | BADHDUFLAG | Total packets | Discarded packets |
| A | 0 | 104560 | 0 |
| B | 0 | 106209 | 0 |
| C | 0 | 126593 | 0 |
| D | 0 | 136670 | 0 |
| Mode M9 | |||
|---|---|---|---|
| Quadrant | BADHDUFLAG | Total packets | Discarded packets |
| A | 0 | 97 | 0 |
| B | 0 | 97 | 0 |
| C | 0 | 97 | 0 |
| D | 0 | 97 | 0 |
| Quadrant | Total seconds | Saturated seconds | Saturation percentage |
|---|---|---|---|
| A | 49482 | 520 | 1.050887% |
| B | 49482 | 660 | 1.333818% |
| C | 49482 | 1227 | 2.479690% |
| D | 49482 | 2498 | 5.048300% |
Noise dominated data is calculated using 1-second bins in cleaned event files. If a bin has >2000 counts, and if more than 50% of those come from <1% of pixels, then it is considered to be noise-dominated and hence unusable.
| Quadrant | # 1 sec bins | Bins with >0 counts | Bins with >2000 counts | High rate bins dominated by noise | Noise dominated (total time) | Noise dominated (detector-on time) | Marked lightcurve |
|---|---|---|---|---|---|---|---|
| A | 59057 | 49473 | 0 | 0 | 0.00% | 0.00% |  |
| B | 59057 | 49472 | 0 | 0 | 0.00% | 0.00% | 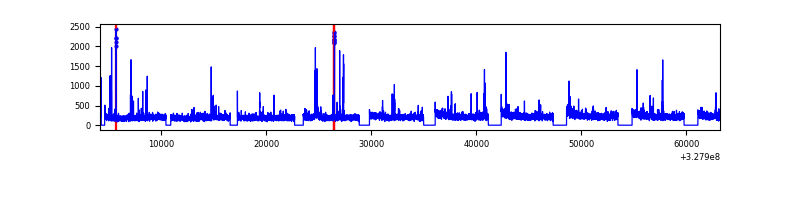 |
| C | 59057 | 49472 | 0 | 0 | 0.00% | 0.00% |  |
| D | 59057 | 49378 | 0 | 0 | 0.00% | 0.00% |  |
Top three noisy pixels from each quadrant. If the there are fewer than three noisy pixels in the level2.evt file, extra rows are filled as -1
| Pixel properties | Quadrant properties | ||||||
|---|---|---|---|---|---|---|---|
| Quadrant | DetID | PixID | Counts | Sigma | Mean | Median | Sigma |
| A | 0 | 29 | 3118 | 11.55 | 834 | 785 | 201.9 |
| A | 7 | 110 | 2540 | 8.69 | 834 | 785 | 201.9 |
| A | 0 | 30 | 2438 | 8.18 | 834 | 785 | 201.9 |
| B | 2 | 9 | 2474 | 10.62 | 813 | 776 | 160.0 |
| B | 2 | 8 | 2114 | 8.36 | 813 | 776 | 160.0 |
| B | 5 | 255 | 2031 | 7.85 | 813 | 776 | 160.0 |
| C | 3 | 126 | 2182 | 6.76 | 822 | 773 | 208.3 |
| C | 12 | 241 | 2134 | 6.53 | 822 | 773 | 208.3 |
| C | 12 | 250 | 2087 | 6.31 | 822 | 773 | 208.3 |
| D | 3 | 14 | 2005 | 6.4 | 772 | 708 | 202.6 |
| D | 7 | 3 | 1910 | 5.93 | 772 | 708 | 202.6 |
| D | 6 | 67 | 1909 | 5.93 | 772 | 708 | 202.6 |
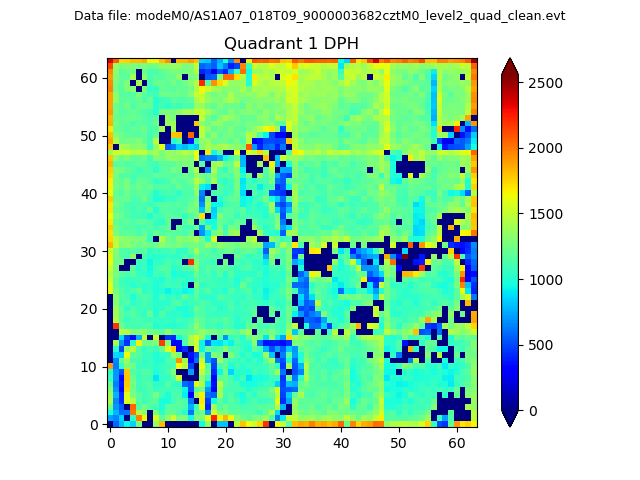
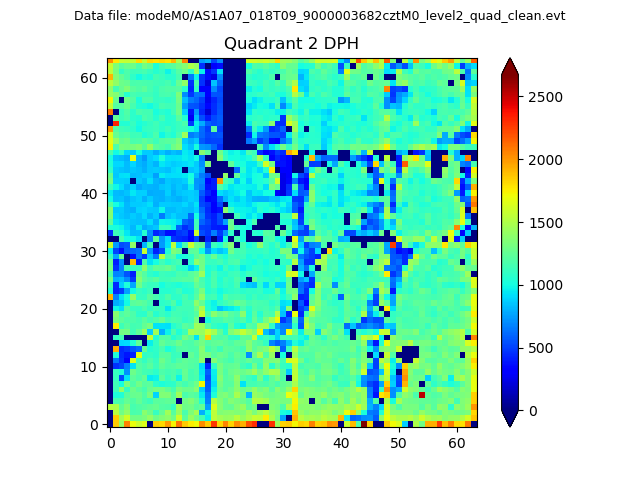
Histogram calculated using DETX and DETY for each event in the final _common_clean file
| Quadrant A |  |
 |
Quadrant B |
|---|---|---|---|
| Quadrant D |  |
 |
Quadrant C |
| Plot type | Count rate plots | Images |
|---|---|---|
| Comparison with Poisson distribution Blue bars denote a histogram of data divided into 1 sec bins. Red curve is a Poisson curve with rate = median count rate of data. |
 |
 |
| Quadrant-wise count rates Data is divided into 100 sec bins |
 |
|
| Module-wise count rates for Quadrant A Data is divided into 100 sec bins |
 |
 |
| Module-wise count rates for Quadrant B Data is divided into 100 sec bins |
 |
 |
| Module-wise count rates for Quadrant C Data is divided into 100 sec bins |
 |
 |
| Module-wise count rates for Quadrant D Data is divided into 100 sec bins |
 |
 |
| Parameter | Plot |
|---|---|
| CZT HV Monitor |  |
| D_VDD |  |
| Temperature 1 |  |
| Veto HV Monitor |  |
| Veto LLD |  |
| Alpha Counter |  |
| _CPM_Rate |  |
| CZT Counter |  |
| +2.5 Volts monitor |  |
| +5 Volts monitor |  |
| _ROLL_ROT |  |
| _Roll_DEC |  |
| _Roll_RA |  |
| Veto Counter |  |