| Param | Original file | Final file |
|---|---|---|
| Filename | modeM0/AS1A07_018T09_9000003682_25148cztM0_level2.evt | modeM0/AS1A07_018T09_9000003682_25148cztM0_level2_quad_clean.evt |
| Size (bytes) | 122,065,920 | 32,549,760 |
| Size | 116.4 MB | 31.0 MB |
| Events in quadrant A | 803,748 | 217,218 |
| Events in quadrant B | 900,765 | 219,777 |
| Events in quadrant C | 895,393 | 212,327 |
| Events in quadrant D | 976,185 | 208,819 |
| Mode M0 | |||
|---|---|---|---|
| Quadrant | BADHDUFLAG | Total packets | Discarded packets |
| A | 0 | 3675 | 0 |
| B | 0 | 3897 | 0 |
| C | 0 | 3774 | 0 |
| D | 0 | 4041 | 0 |
| Mode M9 | |||
|---|---|---|---|
| Quadrant | BADHDUFLAG | Total packets | Discarded packets |
| A | 0 | 4 | 0 |
| B | 0 | 4 | 0 |
| C | 0 | 4 | 0 |
| D | 0 | 4 | 0 |
| Quadrant | Total seconds | Saturated seconds | Saturation percentage |
|---|---|---|---|
| A | 1737 | 54 | 3.108808% |
| B | 1737 | 103 | 5.929764% |
| C | 1737 | 68 | 3.914796% |
| D | 1737 | 55 | 3.166379% |
Noise dominated data is calculated using 1-second bins in cleaned event files. If a bin has >2000 counts, and if more than 50% of those come from <1% of pixels, then it is considered to be noise-dominated and hence unusable.
| Quadrant | # 1 sec bins | Bins with >0 counts | Bins with >2000 counts | High rate bins dominated by noise | Noise dominated (total time) | Noise dominated (detector-on time) | Marked lightcurve |
|---|---|---|---|---|---|---|---|
| A | 2067 | 1737 | 0 | 0 | 0.00% | 0.00% | 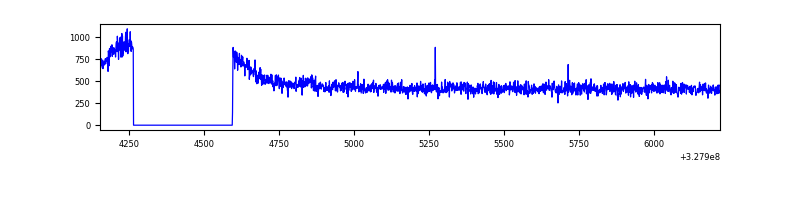 |
| B | 2067 | 1737 | 14 | 14 | 0.68% | 0.81% | 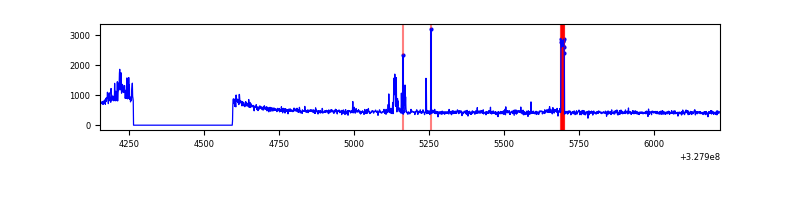 |
| C | 2067 | 1737 | 0 | 0 | 0.00% | 0.00% | 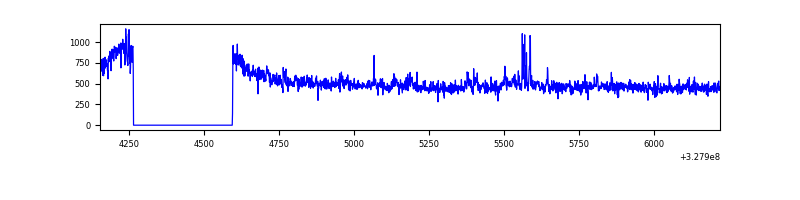 |
| D | 2067 | 1737 | 10 | 10 | 0.48% | 0.58% | 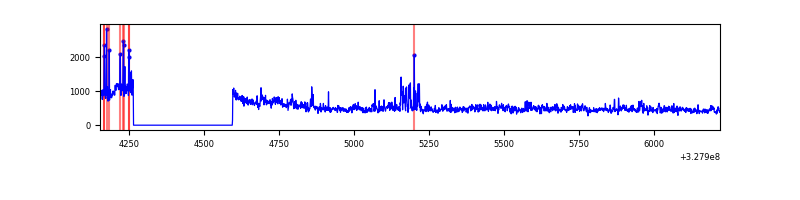 |
Top three noisy pixels from each quadrant. If the there are fewer than three noisy pixels in the level2.evt file, extra rows are filled as -1
| Pixel properties | Quadrant properties | ||||||
|---|---|---|---|---|---|---|---|
| Quadrant | DetID | PixID | Counts | Sigma | Mean | Median | Sigma |
| A | 13 | 254 | 2743 | 57.27 | 208 | 203 | 44.3 |
| A | 3 | 137 | 2018 | 40.92 | 208 | 203 | 44.3 |
| A | 0 | 226 | 1740 | 34.66 | 208 | 203 | 44.3 |
| B | 3 | 64 | 89767 | 2140.57 | 206 | 201 | 41.8 |
| B | 12 | 111 | 5120 | 117.56 | 206 | 201 | 41.8 |
| B | 11 | 111 | 4517 | 103.15 | 206 | 201 | 41.8 |
| C | 7 | 247 | 61663 | 1261.06 | 200 | 202 | 48.7 |
| C | 14 | 238 | 31442 | 640.98 | 200 | 202 | 48.7 |
| C | 9 | 54 | 17319 | 351.21 | 200 | 202 | 48.7 |
| D | 1 | 52 | 137006 | 2710.28 | 201 | 195 | 50.5 |
| D | 8 | 195 | 72735 | 1437.04 | 201 | 195 | 50.5 |
| D | 2 | 234 | 6737 | 129.6 | 201 | 195 | 50.5 |
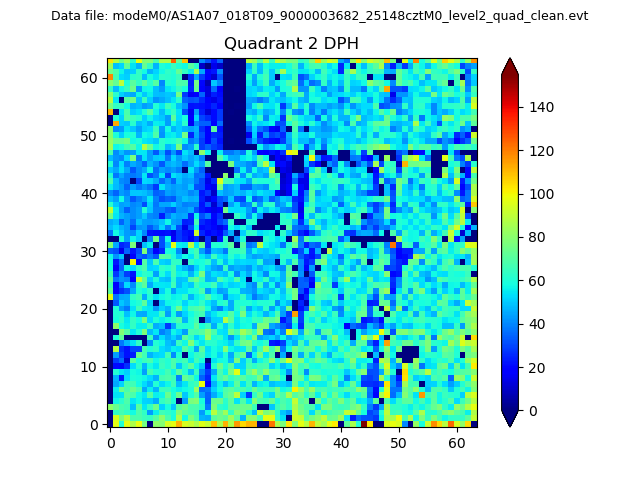
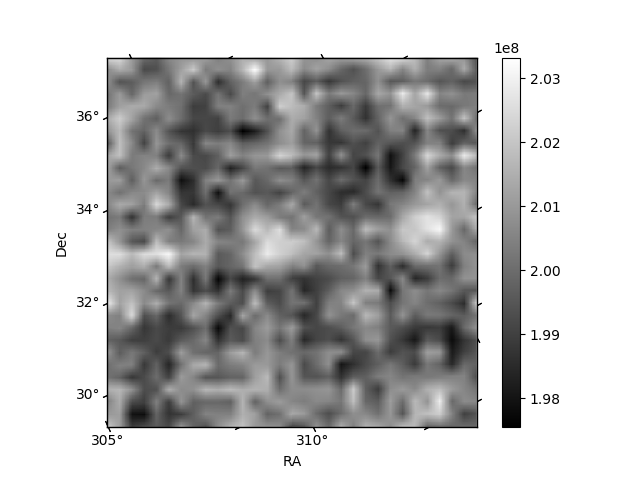
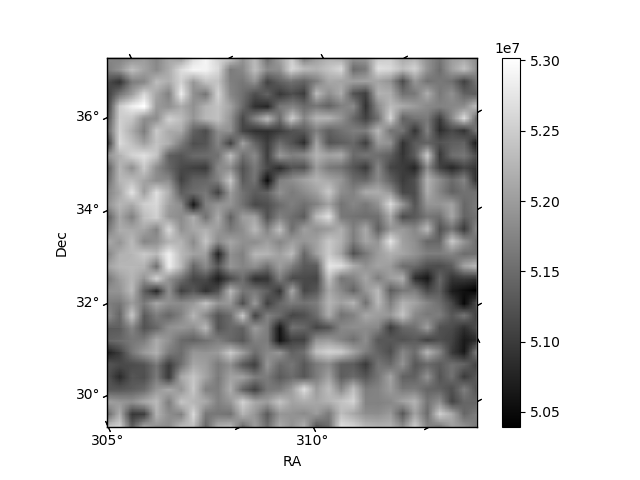
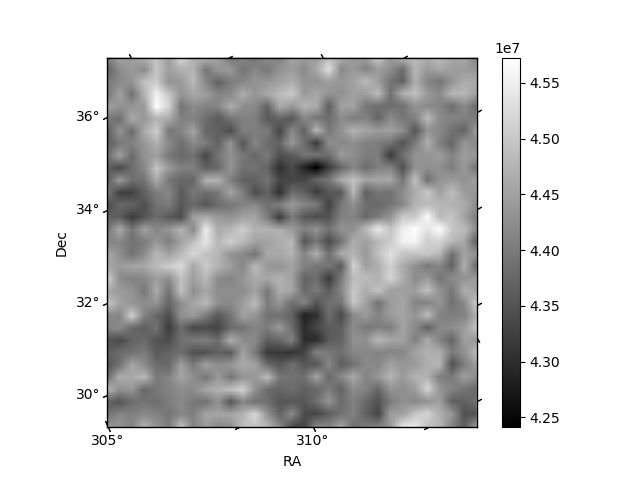
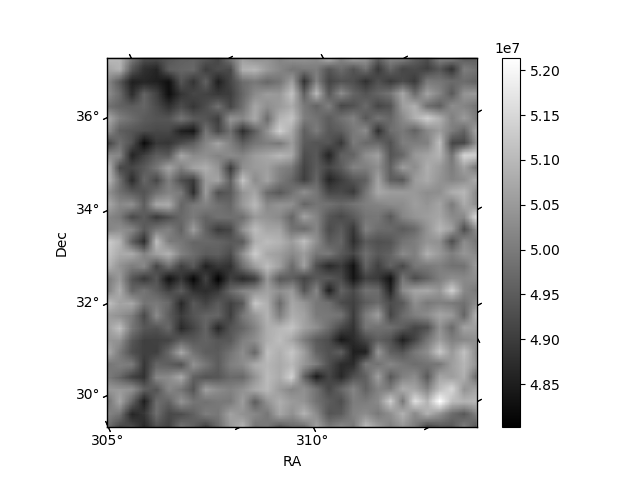
Histogram calculated using DETX and DETY for each event in the final _common_clean file
| Quadrant A | 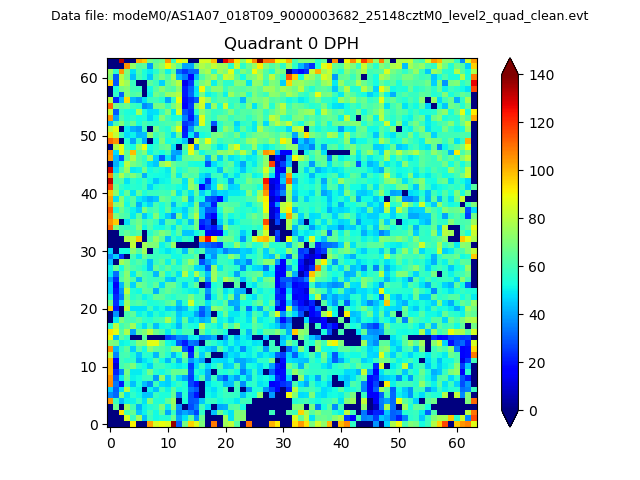 |
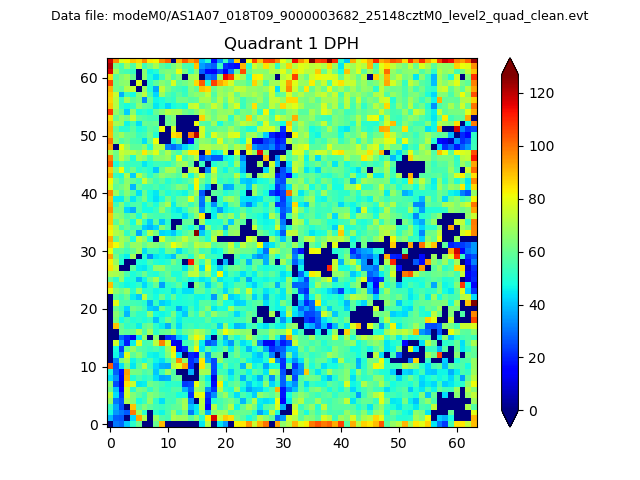 |
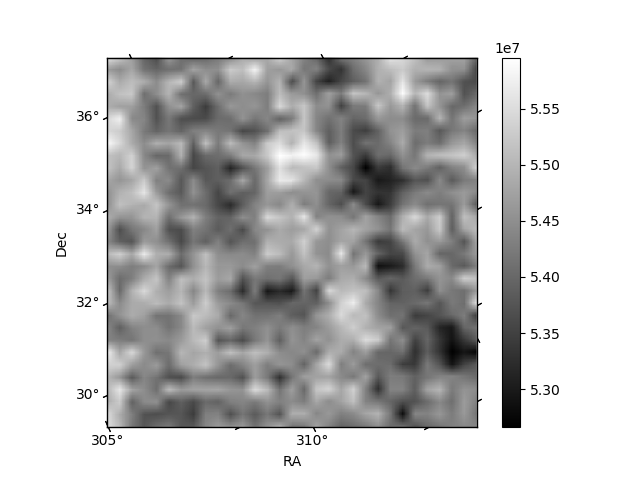
Quadrant B |
|---|---|---|---|
| Quadrant D | 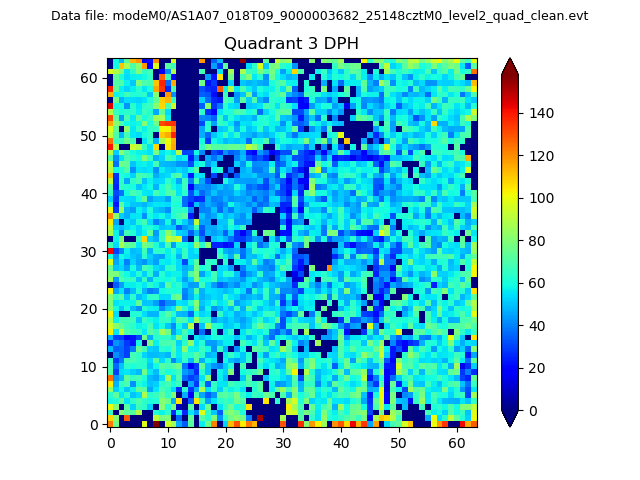 |
 |
Quadrant C |
| Plot type | Count rate plots | Images |
|---|---|---|
| Comparison with Poisson distribution Blue bars denote a histogram of data divided into 1 sec bins. Red curve is a Poisson curve with rate = median count rate of data. |
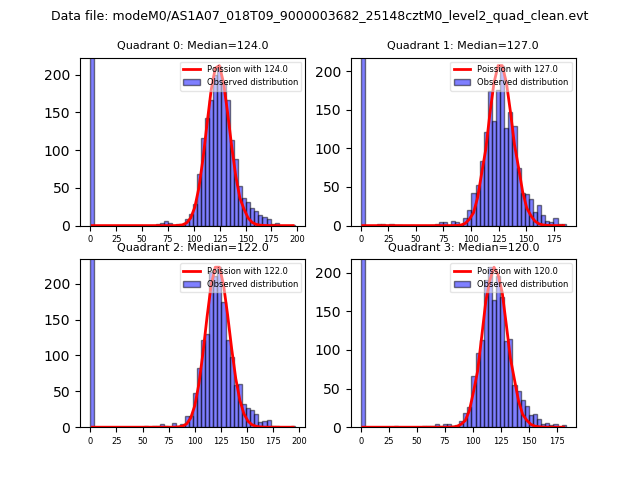 |
 |
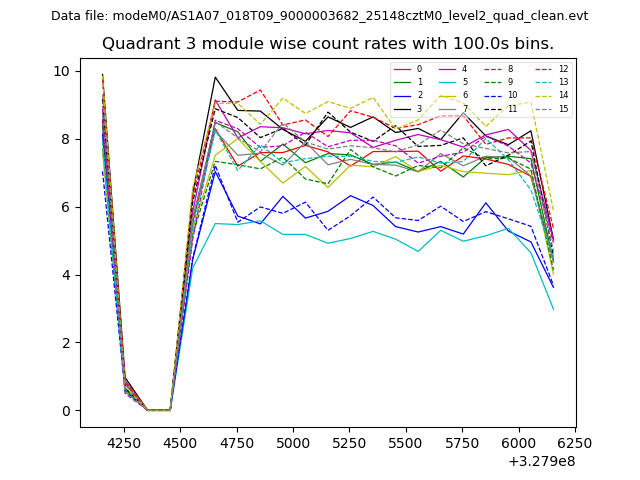
| Quadrant-wise count rates Data is divided into 100 sec bins |
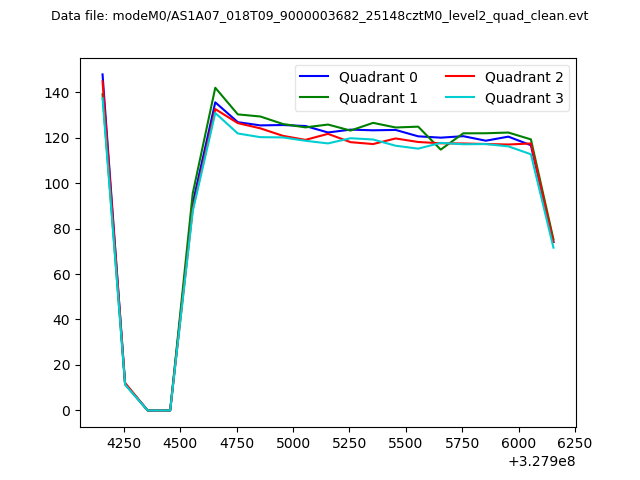 |
|
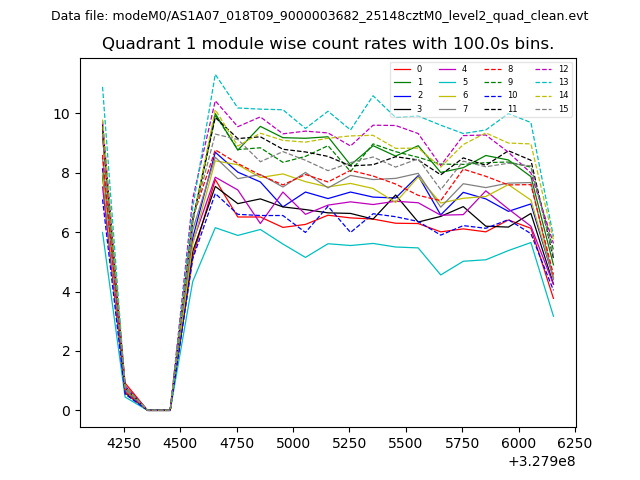
| Module-wise count rates for Quadrant A Data is divided into 100 sec bins |
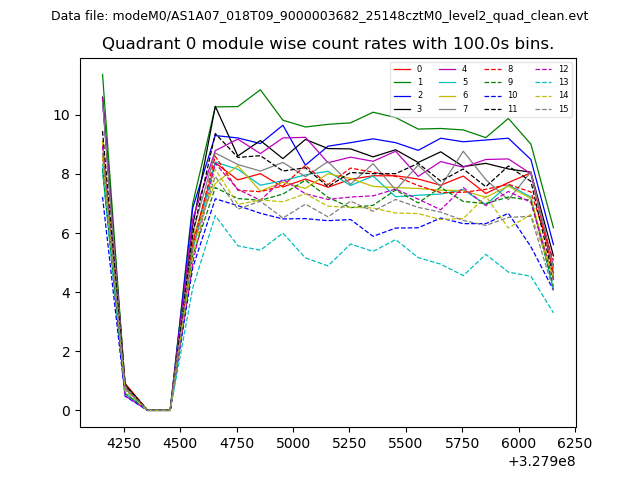 |
 |
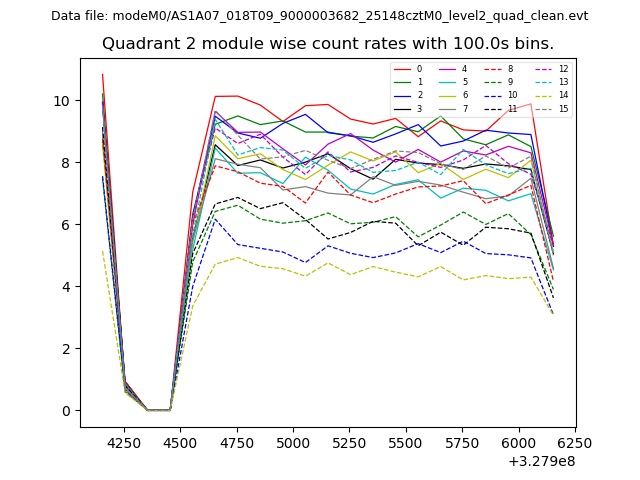
| Module-wise count rates for Quadrant B Data is divided into 100 sec bins |
 |
 |
| Module-wise count rates for Quadrant C Data is divided into 100 sec bins |
 |
 |
| Module-wise count rates for Quadrant D Data is divided into 100 sec bins |
 |
 |
| Parameter | Plot |
|---|---|
| CZT HV Monitor | 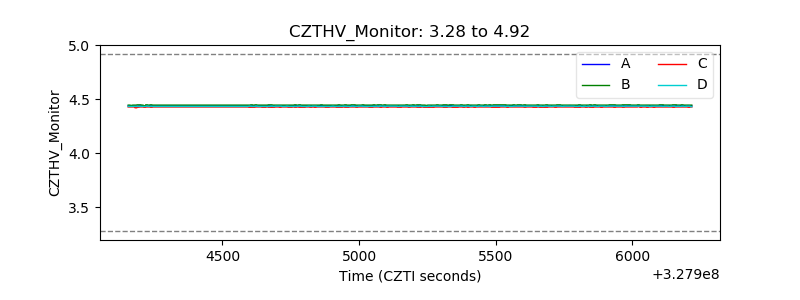 |
| D_VDD | 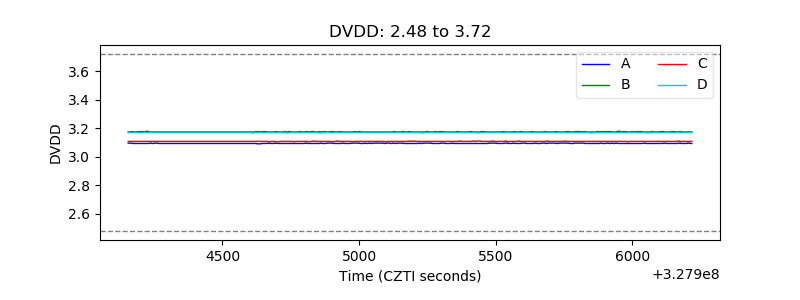 |
| Temperature 1 |  |
| Veto HV Monitor | 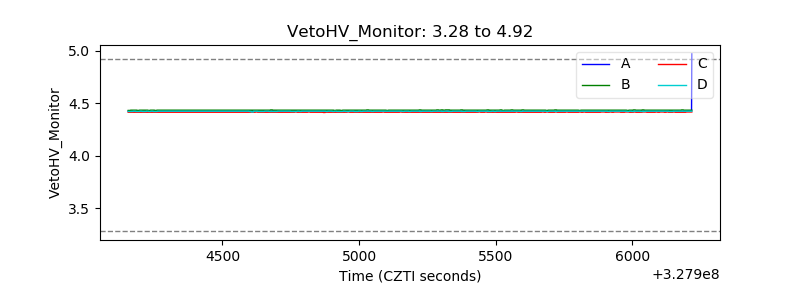 |
| Veto LLD | 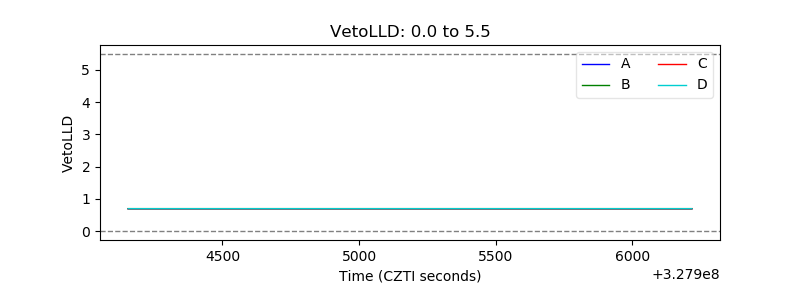 |
| Alpha Counter | 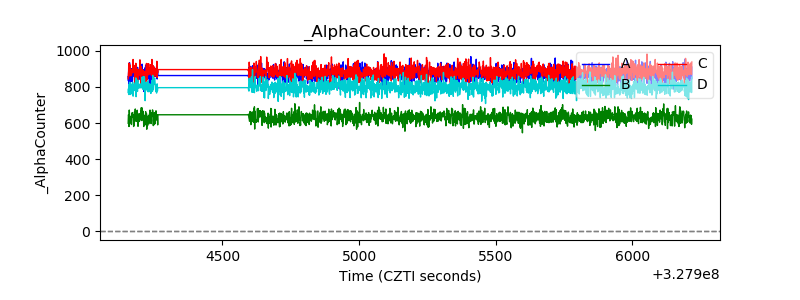 |
| _CPM_Rate | 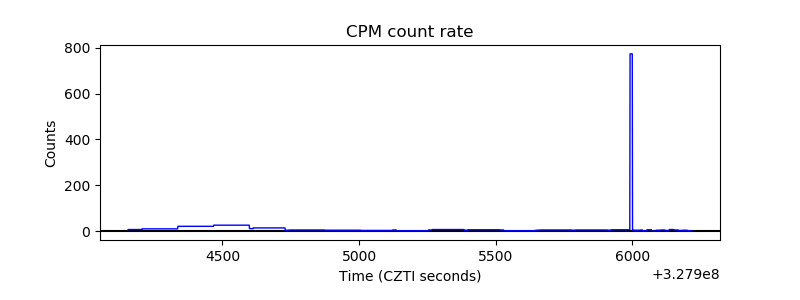 |
| CZT Counter |  |
| +2.5 Volts monitor |  |
| +5 Volts monitor | 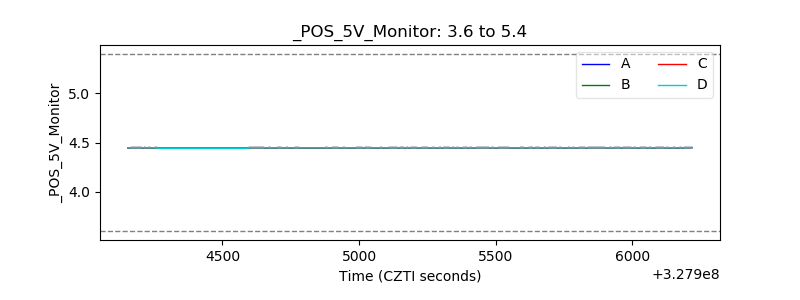 |
| _ROLL_ROT | 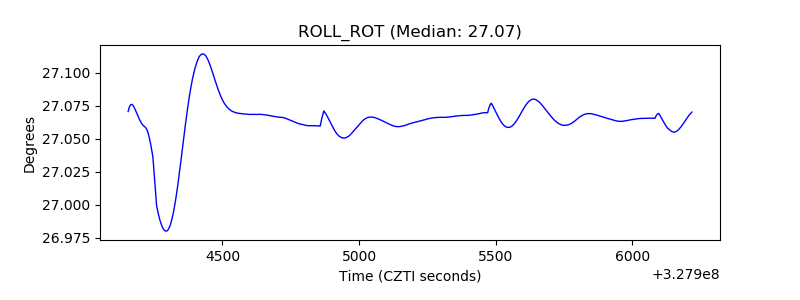 |
| _Roll_DEC | 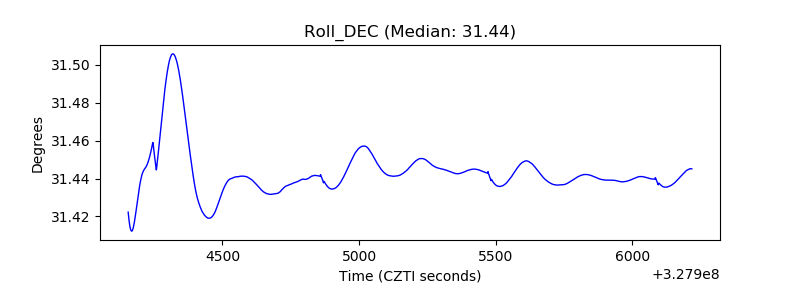 |
| _Roll_RA | 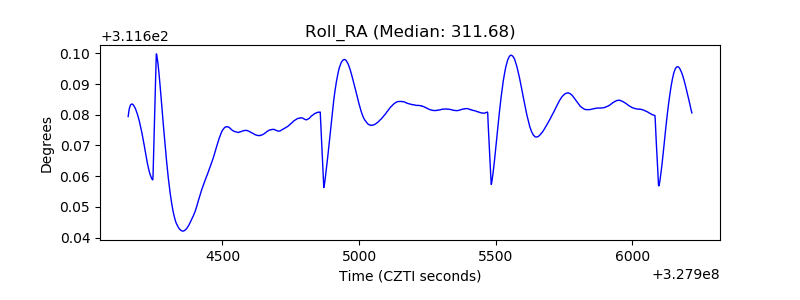 |
| Veto Counter | 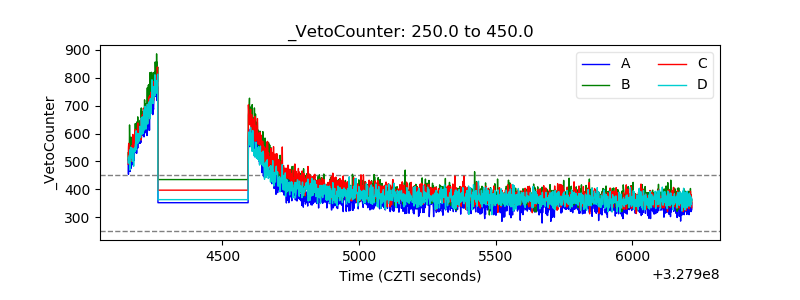 |