| Param | Original file | Final file |
|---|---|---|
| Filename | modeM0/AS1A07_018T09_9000003682_25151cztM0_level2.evt | modeM0/AS1A07_018T09_9000003682_25151cztM0_level2_quad_clean.evt |
| Size (bytes) | 1,435,129,920 | 227,240,640 |
| Size | 1.3 GB | 216.7 MB |
| Events in quadrant A | 8,583,981 | 1,429,788 |
| Events in quadrant B | 8,908,617 | 1,453,864 |
| Events in quadrant C | 11,599,912 | 1,382,717 |
| Events in quadrant D | 13,125,429 | 1,344,624 |
| Mode M0 | |||
|---|---|---|---|
| Quadrant | BADHDUFLAG | Total packets | Discarded packets |
| A | 0 | 37419 | 0 |
| B | 0 | 38132 | 0 |
| C | 0 | 47565 | 0 |
| D | 0 | 50782 | 0 |
| Mode M9 | |||
|---|---|---|---|
| Quadrant | BADHDUFLAG | Total packets | Discarded packets |
| A | 0 | 22 | 0 |
| B | 0 | 23 | 0 |
| C | 0 | 23 | 0 |
| D | 0 | 23 | 0 |
| Quadrant | Total seconds | Saturated seconds | Saturation percentage |
|---|---|---|---|
| A | 18452 | 134 | 0.726209% |
| B | 18452 | 178 | 0.964665% |
| C | 18452 | 299 | 1.620421% |
| D | 18452 | 1008 | 5.462822% |
Noise dominated data is calculated using 1-second bins in cleaned event files. If a bin has >2000 counts, and if more than 50% of those come from <1% of pixels, then it is considered to be noise-dominated and hence unusable.
| Quadrant | # 1 sec bins | Bins with >0 counts | Bins with >2000 counts | High rate bins dominated by noise | Noise dominated (total time) | Noise dominated (detector-on time) | Marked lightcurve |
|---|---|---|---|---|---|---|---|
| A | 20432 | 18452 | 0 | 0 | 0.00% | 0.00% | 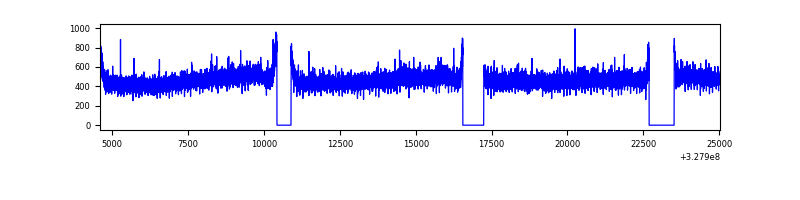 |
| B | 20432 | 18452 | 15 | 15 | 0.07% | 0.08% | 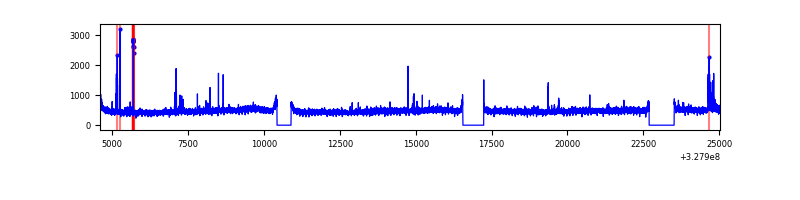 |
| C | 20432 | 18452 | 1 | 1 | 0.00% | 0.01% | 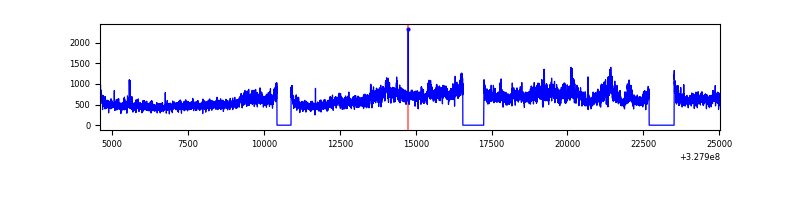 |
| D | 20432 | 18452 | 845 | 845 | 4.14% | 4.58% | 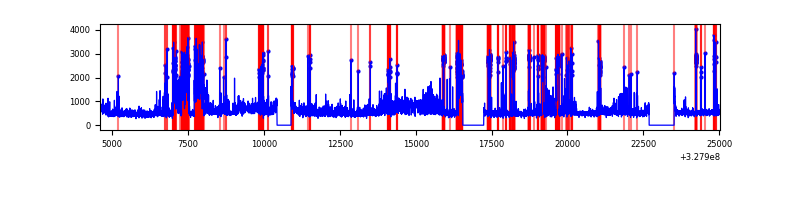 |
Top three noisy pixels from each quadrant. If the there are fewer than three noisy pixels in the level2.evt file, extra rows are filled as -1
| Pixel properties | Quadrant properties | ||||||
|---|---|---|---|---|---|---|---|
| Quadrant | DetID | PixID | Counts | Sigma | Mean | Median | Sigma |
| A | 13 | 254 | 28588 | 59.15 | 2225 | 2173 | 446.6 |
| A | 3 | 137 | 21004 | 42.16 | 2225 | 2173 | 446.6 |
| A | 0 | 226 | 18653 | 36.9 | 2225 | 2173 | 446.6 |
| B | 0 | 229 | 127805 | 295.78 | 2209 | 2150 | 424.8 |
| B | 3 | 64 | 95463 | 219.65 | 2209 | 2150 | 424.8 |
| B | 12 | 111 | 53625 | 121.17 | 2209 | 2150 | 424.8 |
| C | 7 | 247 | 2905777 | 5852.63 | 2124 | 2137 | 496.1 |
| C | 14 | 238 | 336037 | 673.01 | 2124 | 2137 | 496.1 |
| C | 3 | 233 | 47250 | 90.93 | 2124 | 2137 | 496.1 |
| D | 1 | 52 | 4011969 | 7801.96 | 2112 | 2050 | 514.0 |
| D | 8 | 195 | 572088 | 1109.1 | 2112 | 2050 | 514.0 |
| D | 2 | 244 | 367568 | 711.18 | 2112 | 2050 | 514.0 |
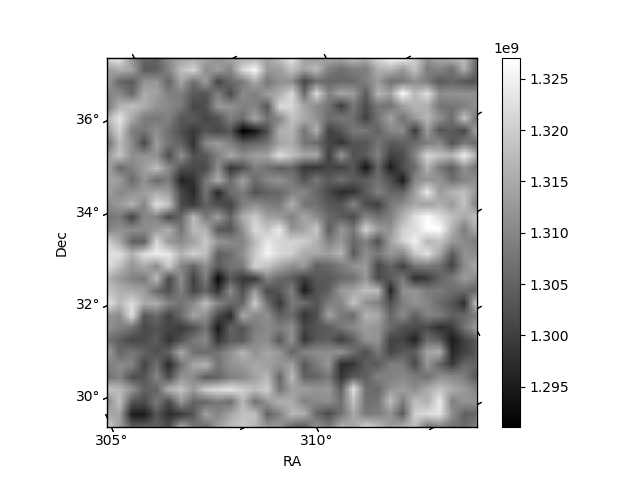
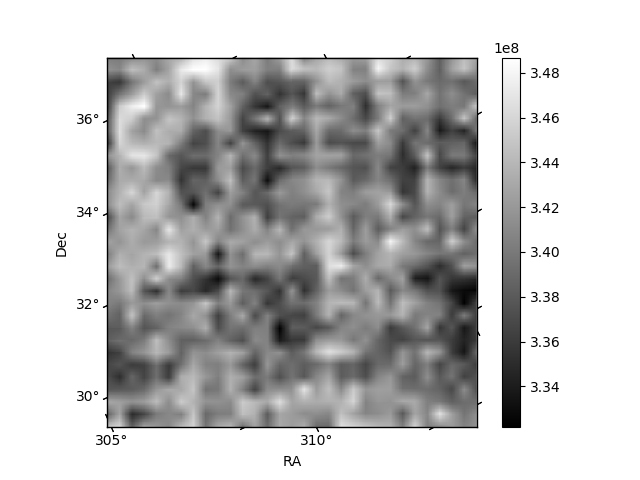
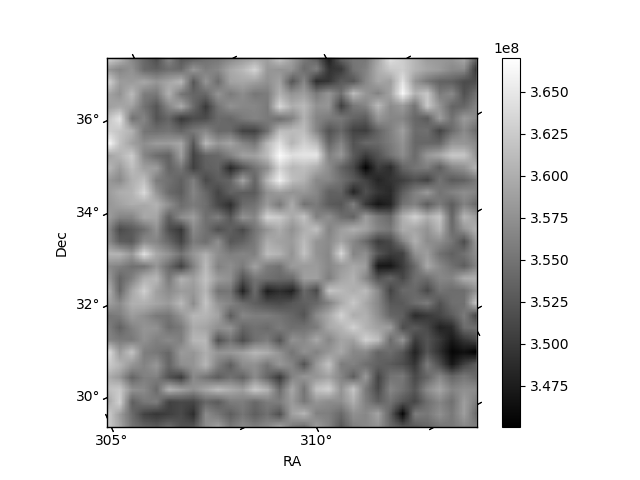
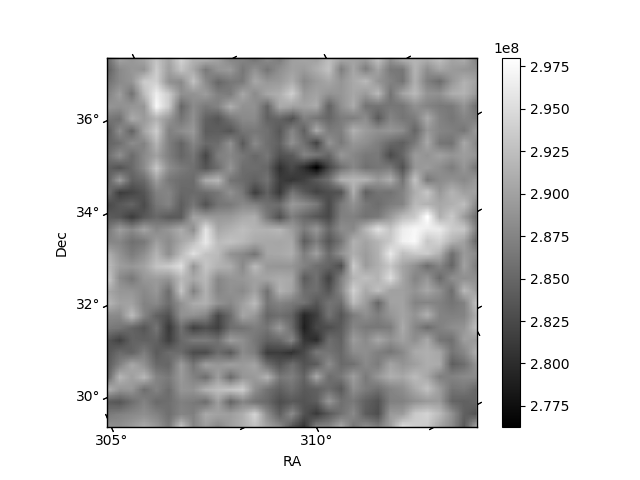
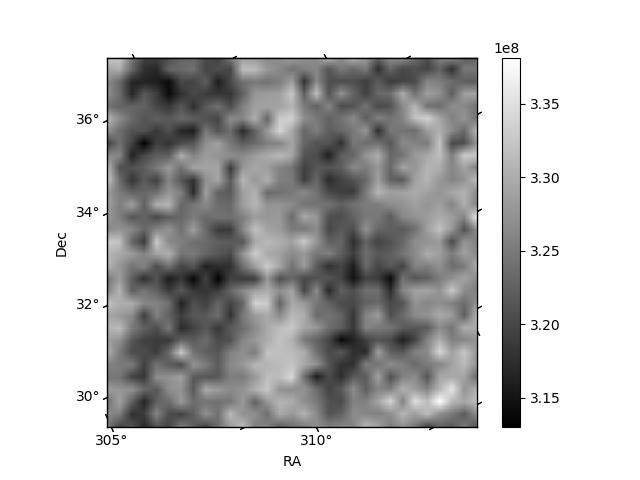
Histogram calculated using DETX and DETY for each event in the final _common_clean file
| Quadrant A |  |
 |
Quadrant B |
|---|---|---|---|
| Quadrant D |  |
 |
Quadrant C |
| Plot type | Count rate plots | Images |
|---|---|---|
| Comparison with Poisson distribution Blue bars denote a histogram of data divided into 1 sec bins. Red curve is a Poisson curve with rate = median count rate of data. |
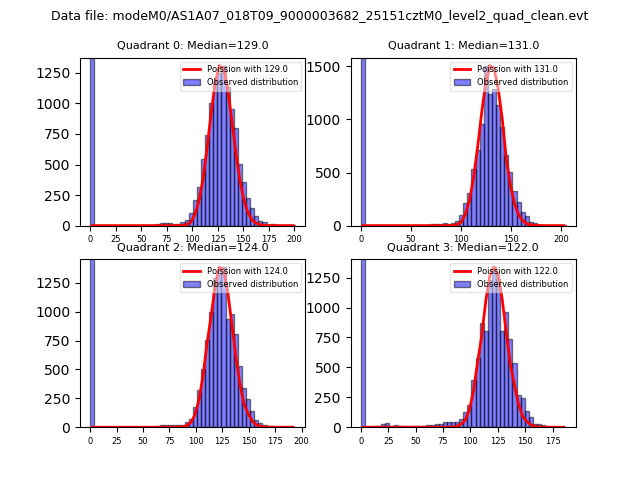 |
 |
| Quadrant-wise count rates Data is divided into 100 sec bins |
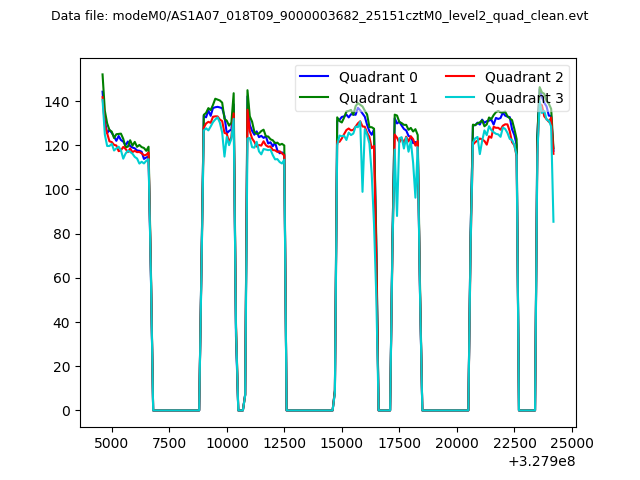 |
|
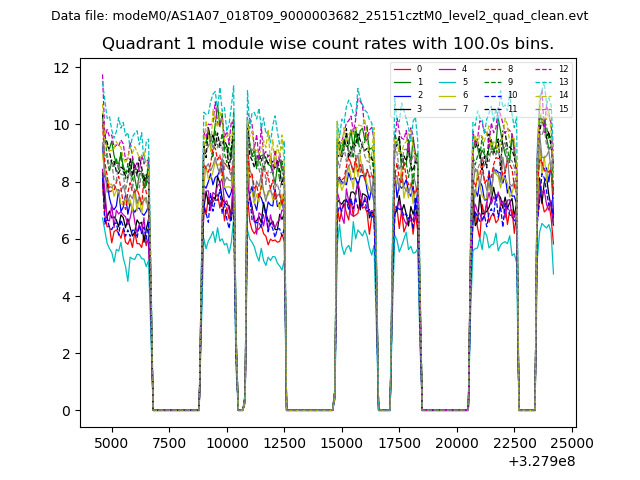
| Module-wise count rates for Quadrant A Data is divided into 100 sec bins |
 |
 |
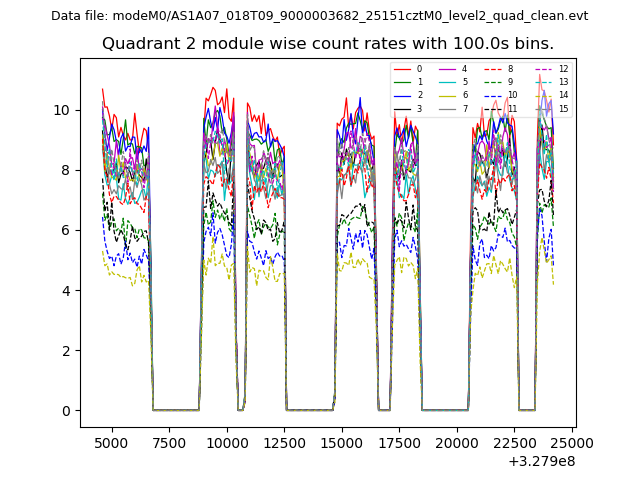
| Module-wise count rates for Quadrant B Data is divided into 100 sec bins |
 |
 |
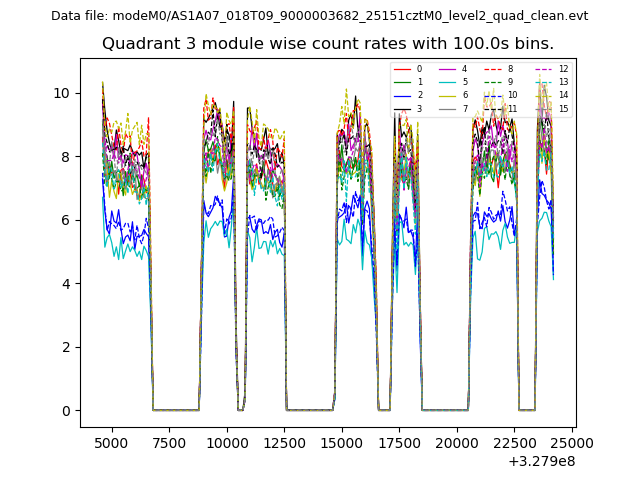
| Module-wise count rates for Quadrant C Data is divided into 100 sec bins |
 |
 |
| Module-wise count rates for Quadrant D Data is divided into 100 sec bins |
 |
 |
| Parameter | Plot |
|---|---|
| CZT HV Monitor | 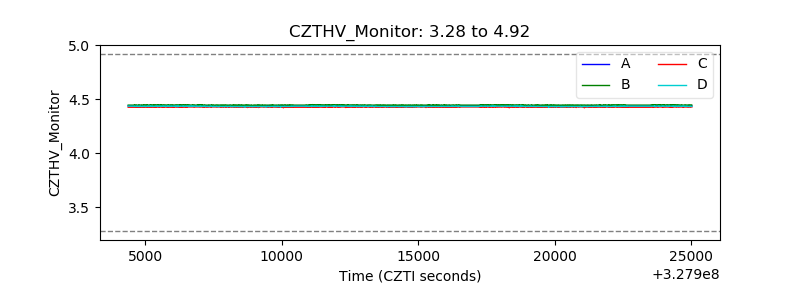 |
| D_VDD | 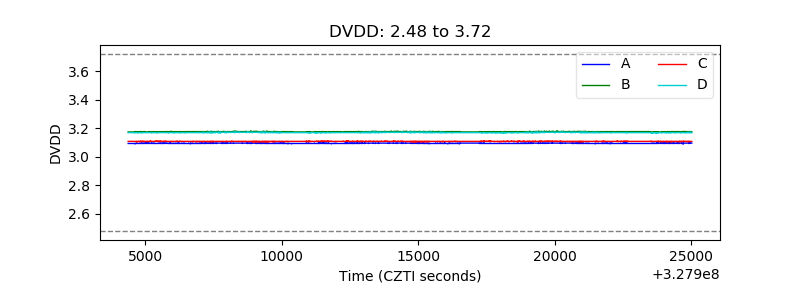 |
| Temperature 1 | 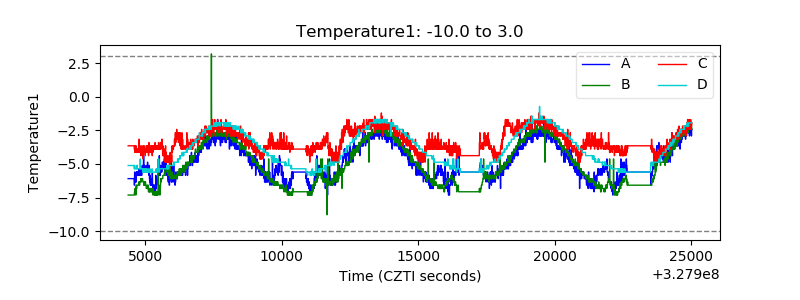 |
| Veto HV Monitor | 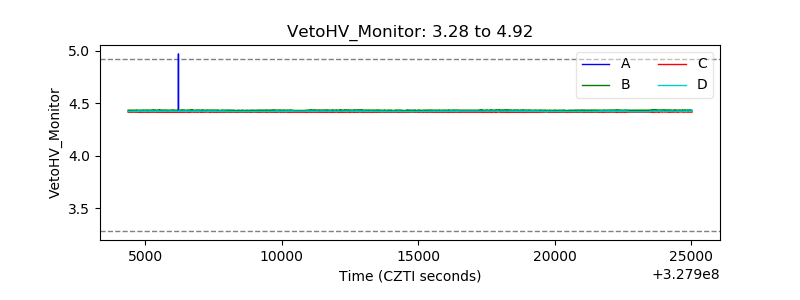 |
| Veto LLD | 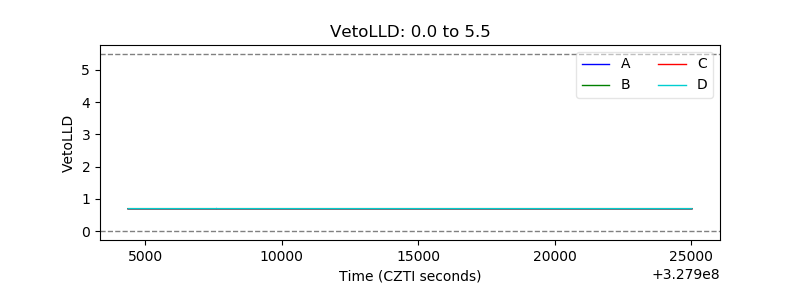 |
| Alpha Counter | 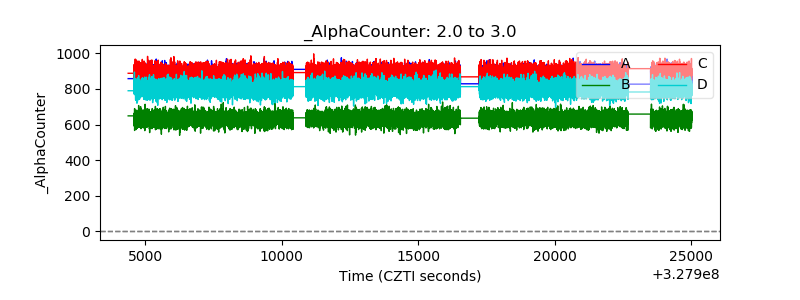 |
| _CPM_Rate | 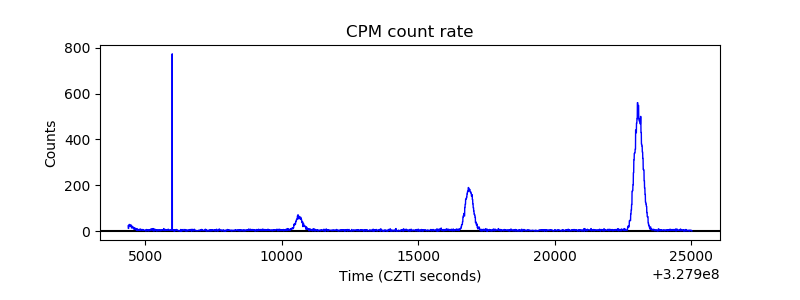 |
| CZT Counter | 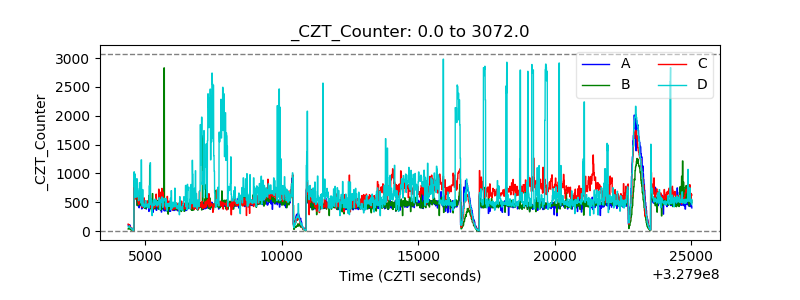 |
| +2.5 Volts monitor |  |
| +5 Volts monitor |  |
| _ROLL_ROT | 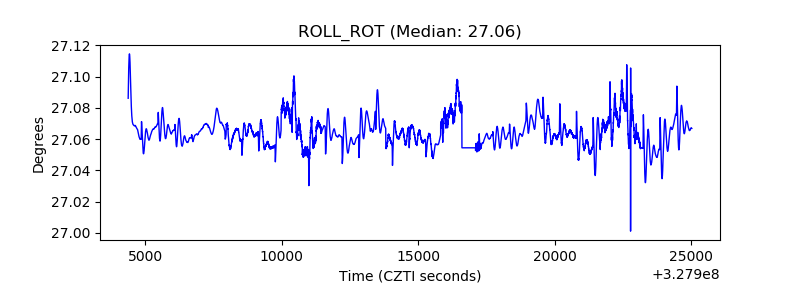 |
| _Roll_DEC | 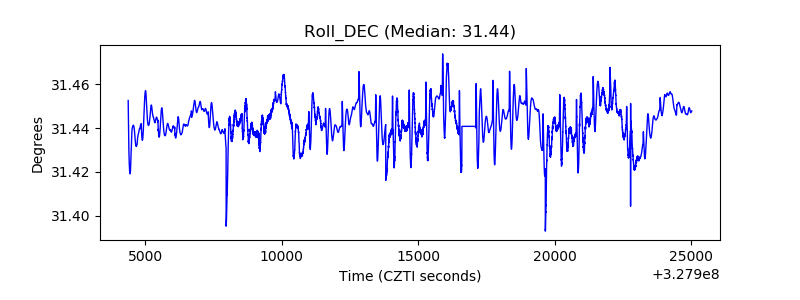 |
| _Roll_RA | 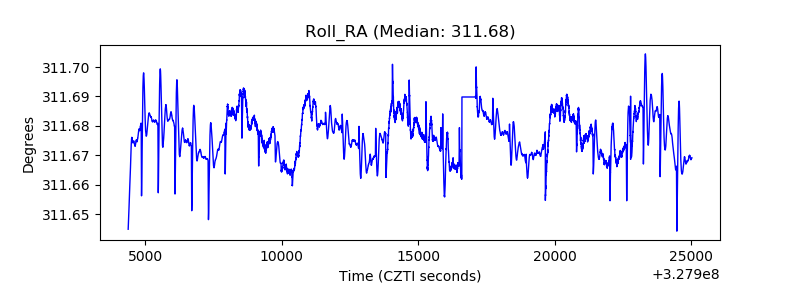 |
| Veto Counter | 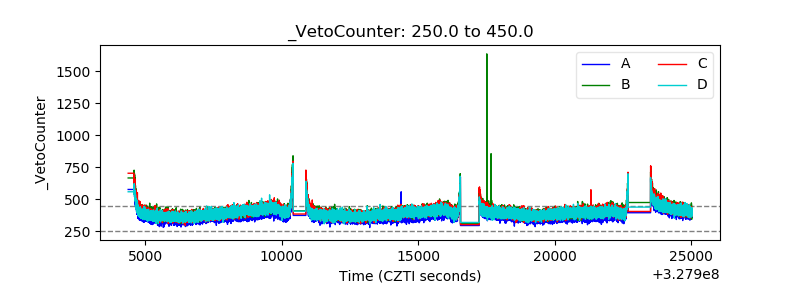 |