| Param | Original file | Final file |
|---|---|---|
| Filename | modeM0/AS1A07_018T09_9000003682_25152cztM0_level2.evt | modeM0/AS1A07_018T09_9000003682_25152cztM0_level2_quad_clean.evt |
| Size (bytes) | 490,933,440 | 70,081,920 |
| Size | 468.2 MB | 66.8 MB |
| Events in quadrant A | 3,176,617 | 425,788 |
| Events in quadrant B | 3,400,817 | 428,757 |
| Events in quadrant C | 3,877,440 | 409,216 |
| Events in quadrant D | 3,971,016 | 403,841 |
| Mode M0 | |||
|---|---|---|---|
| Quadrant | BADHDUFLAG | Total packets | Discarded packets |
| A | 0 | 13388 | 0 |
| B | 0 | 13994 | 0 |
| C | 0 | 15975 | 0 |
| D | 0 | 15784 | 0 |
| Mode M9 | |||
|---|---|---|---|
| Quadrant | BADHDUFLAG | Total packets | Discarded packets |
| A | 0 | 10 | 0 |
| B | 0 | 10 | 0 |
| C | 0 | 10 | 0 |
| D | 0 | 10 | 0 |
| Quadrant | Total seconds | Saturated seconds | Saturation percentage |
|---|---|---|---|
| A | 6516 | 50 | 0.767342% |
| B | 6516 | 88 | 1.350522% |
| C | 6516 | 77 | 1.181707% |
| D | 6516 | 128 | 1.964395% |
Noise dominated data is calculated using 1-second bins in cleaned event files. If a bin has >2000 counts, and if more than 50% of those come from <1% of pixels, then it is considered to be noise-dominated and hence unusable.
| Quadrant | # 1 sec bins | Bins with >0 counts | Bins with >2000 counts | High rate bins dominated by noise | Noise dominated (total time) | Noise dominated (detector-on time) | Marked lightcurve |
|---|---|---|---|---|---|---|---|
| A | 7496 | 6516 | 0 | 0 | 0.00% | 0.00% | 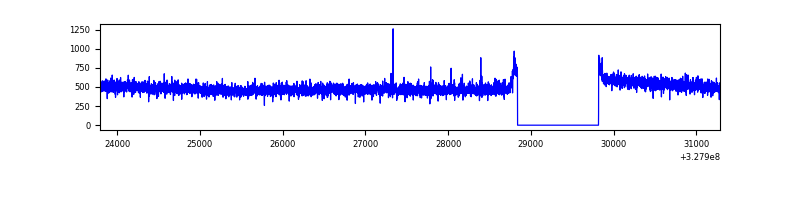 |
| B | 7496 | 6516 | 27 | 27 | 0.36% | 0.41% | 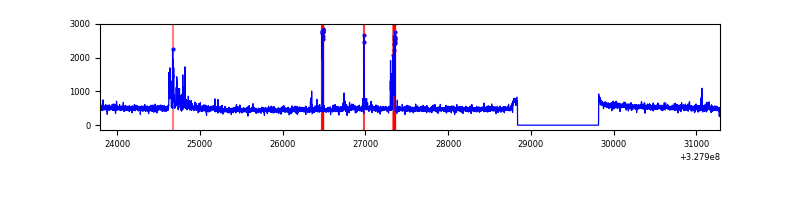 |
| C | 7496 | 6516 | 0 | 0 | 0.00% | 0.00% | 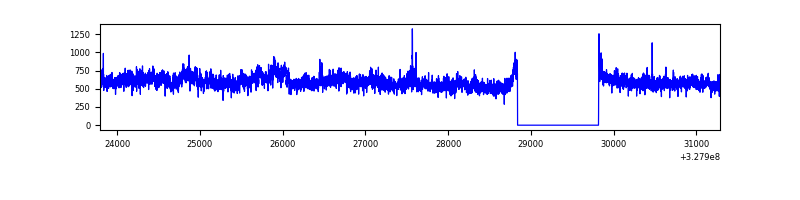 |
| D | 7496 | 6516 | 86 | 86 | 1.15% | 1.32% | 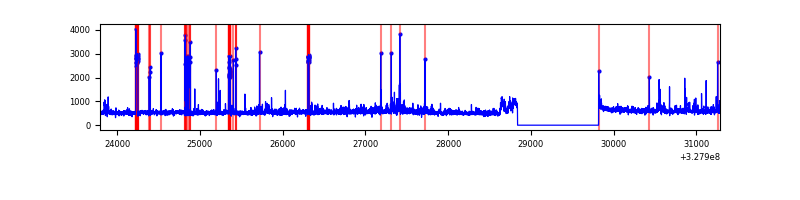 |
Top three noisy pixels from each quadrant. If the there are fewer than three noisy pixels in the level2.evt file, extra rows are filled as -1
| Pixel properties | Quadrant properties | ||||||
|---|---|---|---|---|---|---|---|
| Quadrant | DetID | PixID | Counts | Sigma | Mean | Median | Sigma |
| A | 13 | 254 | 10100 | 56.38 | 819 | 801 | 164.9 |
| A | 13 | 158 | 9962 | 55.55 | 819 | 801 | 164.9 |
| A | 13 | 207 | 8749 | 48.19 | 819 | 801 | 164.9 |
| B | 0 | 229 | 236156 | 1510.95 | 806 | 787 | 155.8 |
| B | 12 | 111 | 19261 | 118.59 | 806 | 787 | 155.8 |
| B | 11 | 111 | 17479 | 107.15 | 806 | 787 | 155.8 |
| C | 7 | 247 | 703032 | 3871.35 | 776 | 779 | 181.4 |
| C | 14 | 238 | 123781 | 678.08 | 776 | 779 | 181.4 |
| C | 3 | 233 | 18487 | 97.62 | 776 | 779 | 181.4 |
| D | 1 | 52 | 581976 | 3029.43 | 787 | 765 | 191.9 |
| D | 8 | 195 | 295210 | 1534.73 | 787 | 765 | 191.9 |
| D | 12 | 235 | 90569 | 468.08 | 787 | 765 | 191.9 |
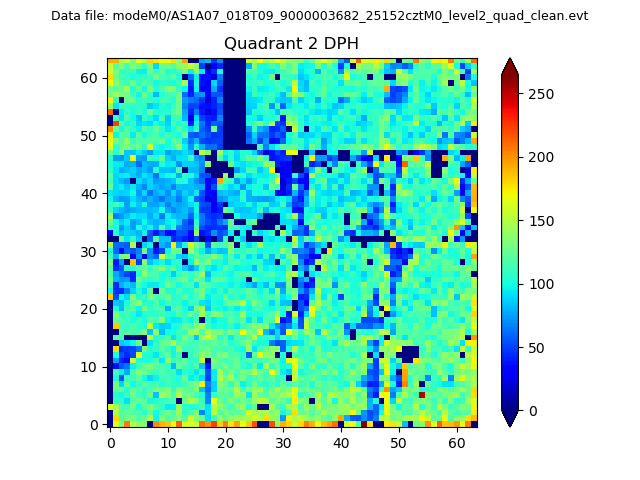
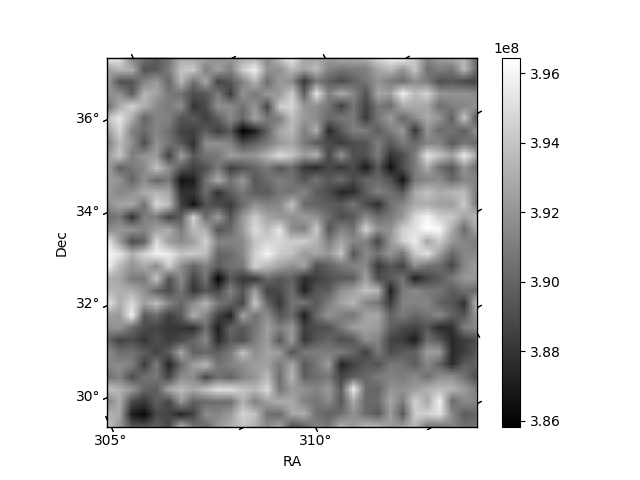
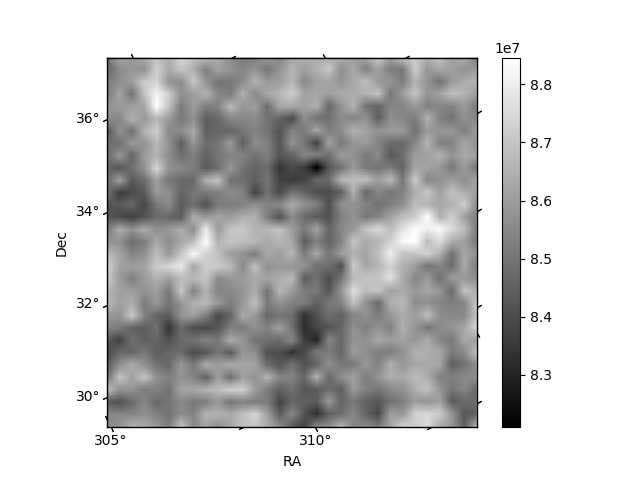
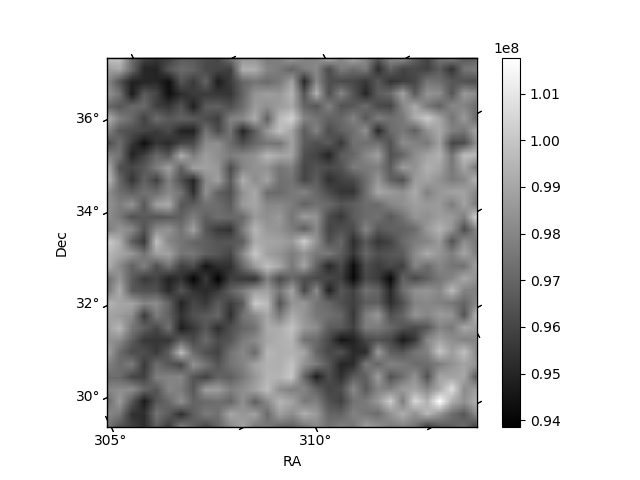
Histogram calculated using DETX and DETY for each event in the final _common_clean file
| Quadrant A | 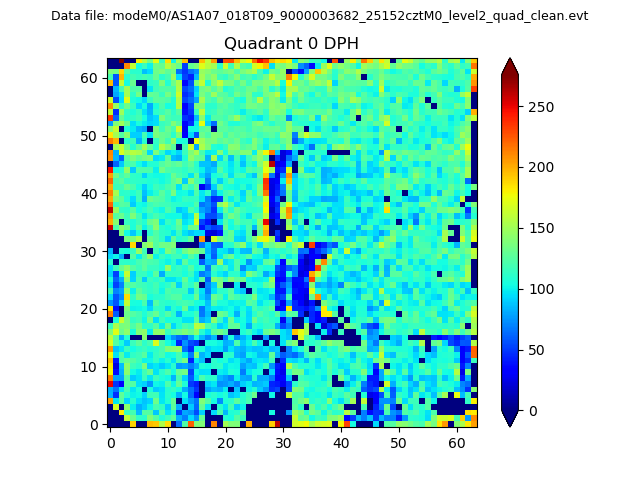 |
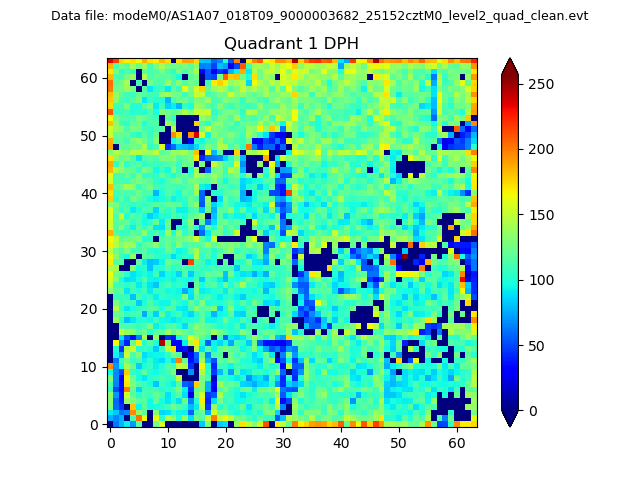 |
Quadrant B |
|---|---|---|---|
| Quadrant D | 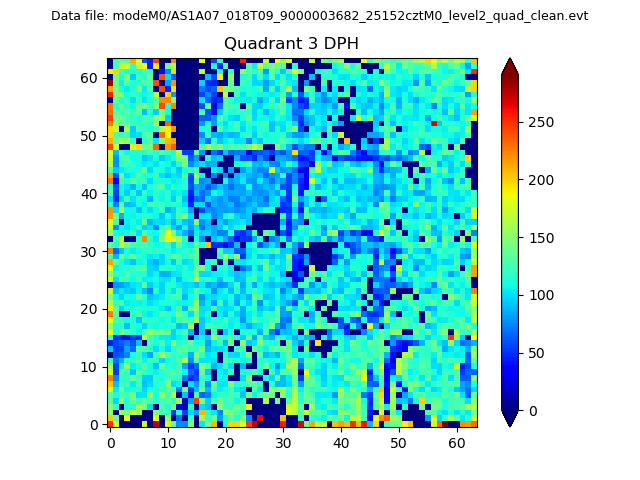 |
 |
Quadrant C |
| Plot type | Count rate plots | Images |
|---|---|---|
| Comparison with Poisson distribution Blue bars denote a histogram of data divided into 1 sec bins. Red curve is a Poisson curve with rate = median count rate of data. |
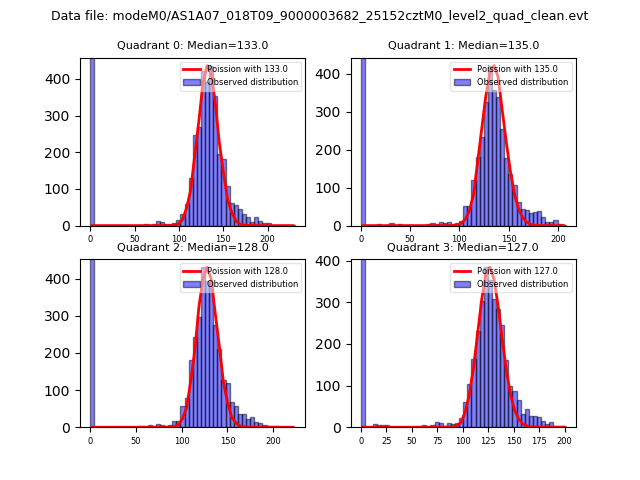 |
 |
| Quadrant-wise count rates Data is divided into 100 sec bins |
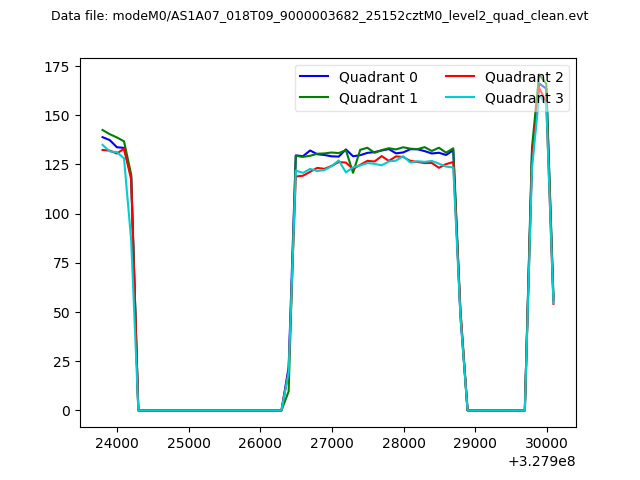 |
|
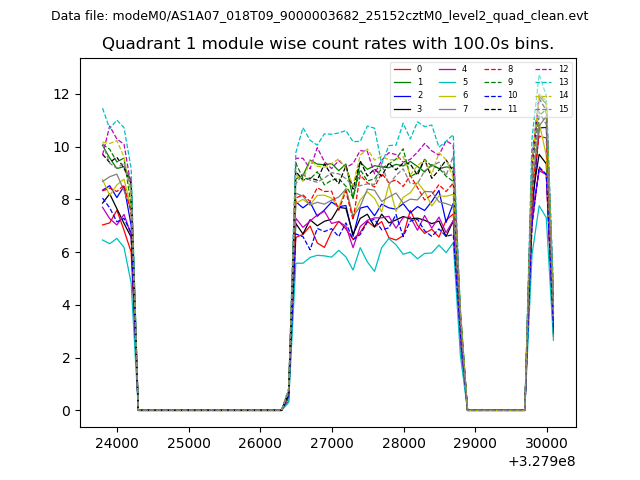
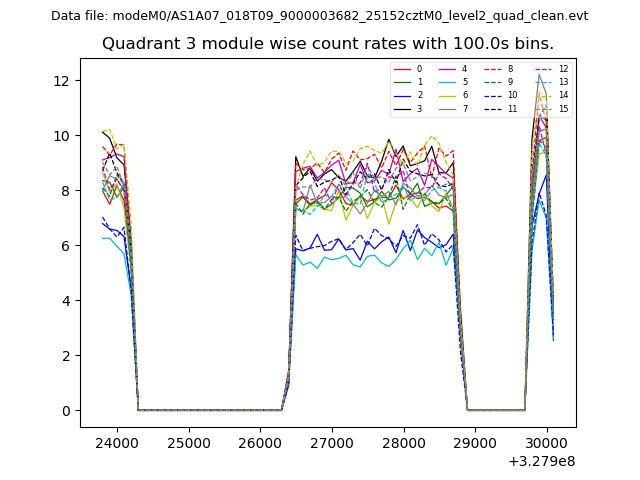
| Module-wise count rates for Quadrant A Data is divided into 100 sec bins |
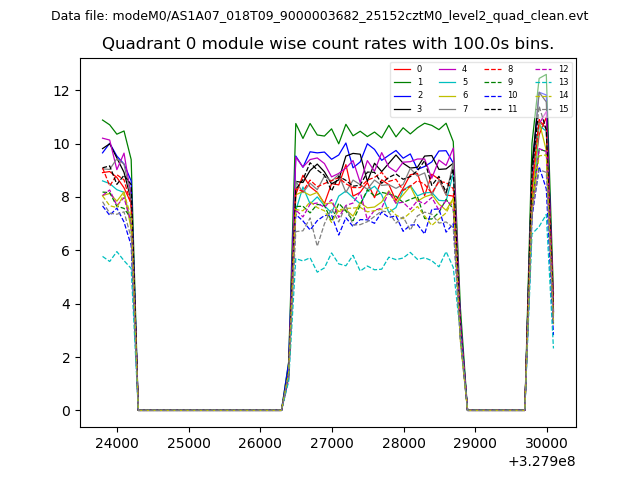 |
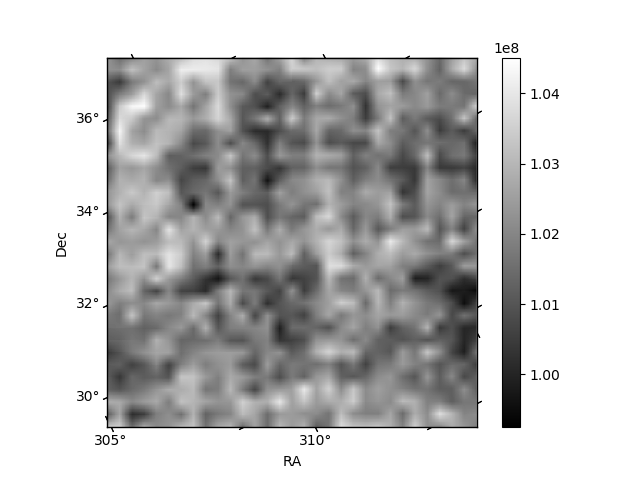 |
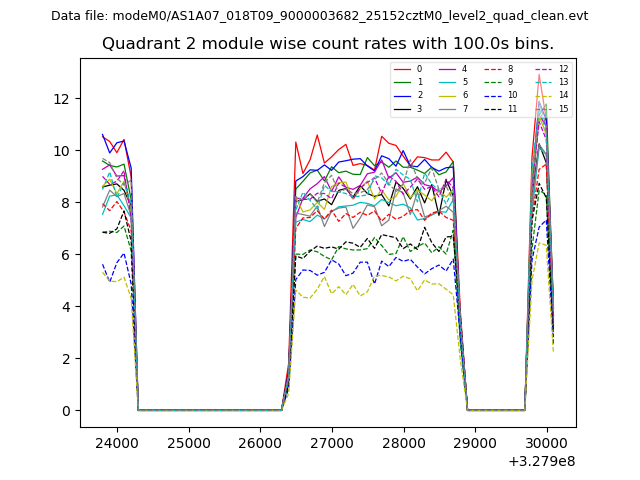
| Module-wise count rates for Quadrant B Data is divided into 100 sec bins |
 |
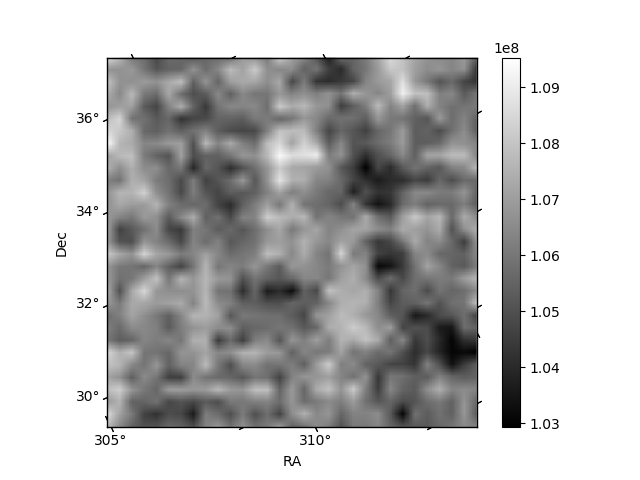 |
| Module-wise count rates for Quadrant C Data is divided into 100 sec bins |
 |
 |
| Module-wise count rates for Quadrant D Data is divided into 100 sec bins |
 |
 |
| Parameter | Plot |
|---|---|
| CZT HV Monitor | 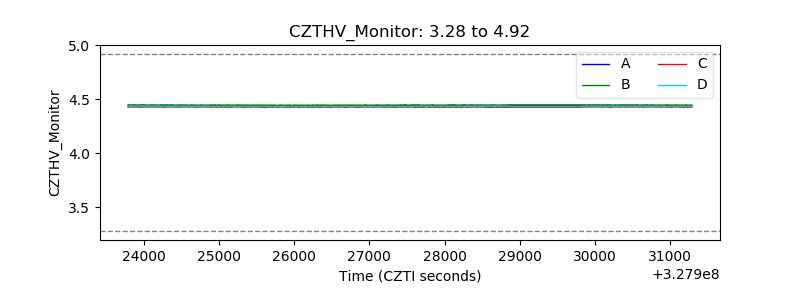 |
| D_VDD | 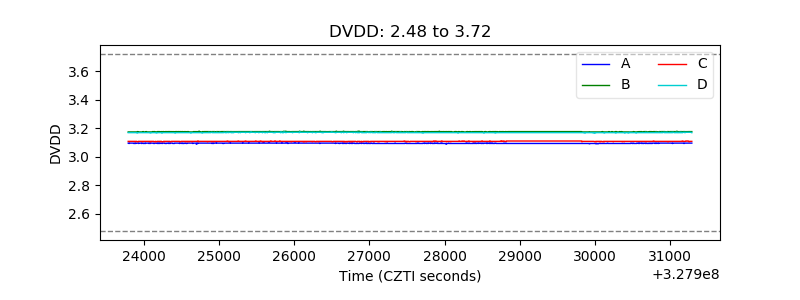 |
| Temperature 1 | 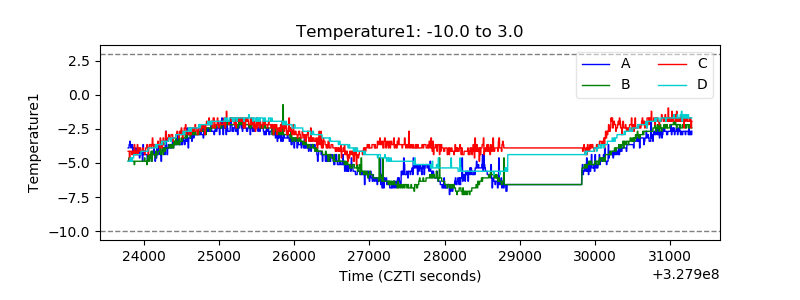 |
| Veto HV Monitor | 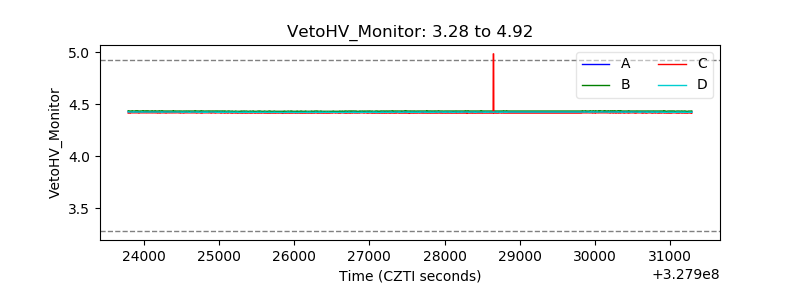 |
| Veto LLD | 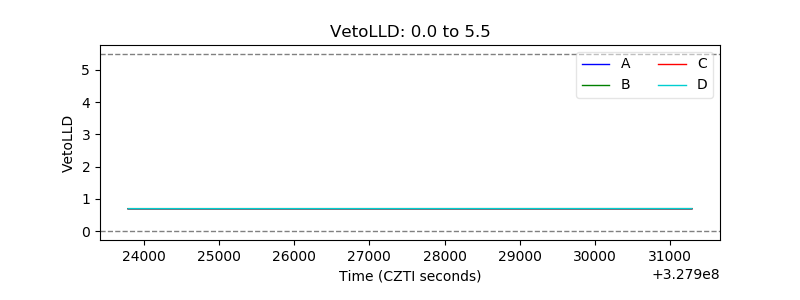 |
| Alpha Counter | 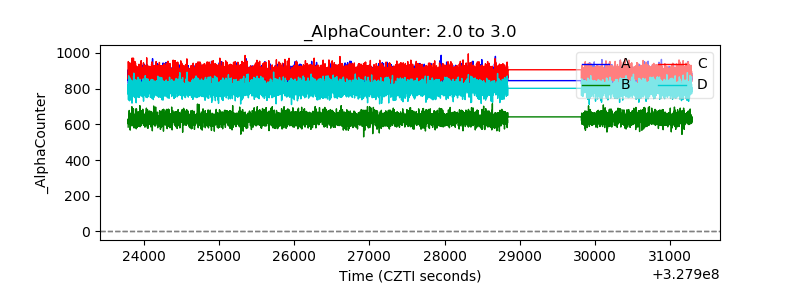 |
| _CPM_Rate | 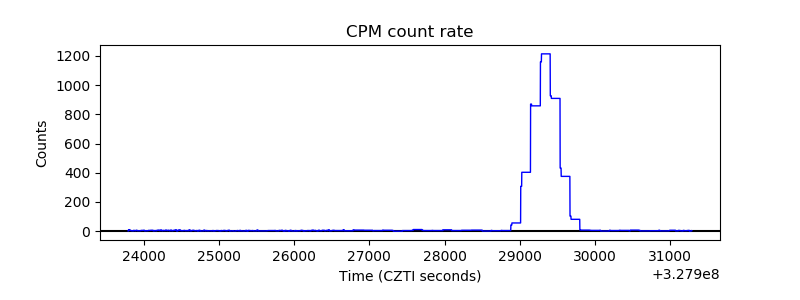 |
| CZT Counter | 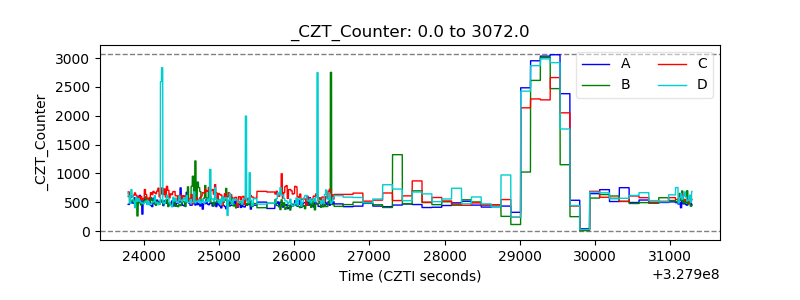 |
| +2.5 Volts monitor |  |
| +5 Volts monitor |  |
| _ROLL_ROT | 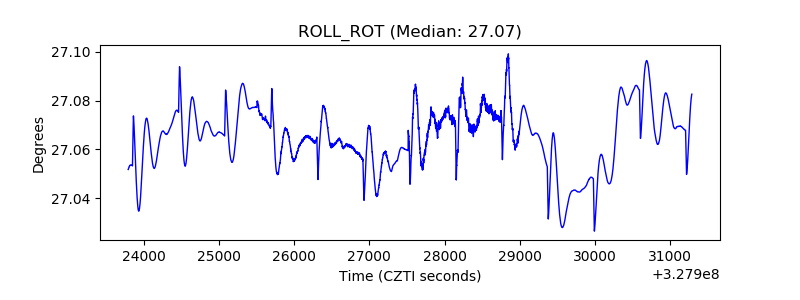 |
| _Roll_DEC | 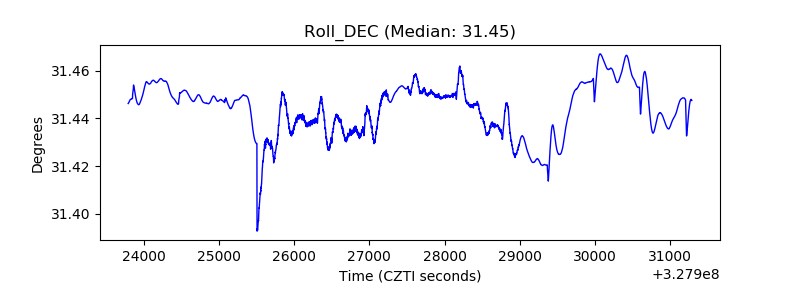 |
| _Roll_RA | 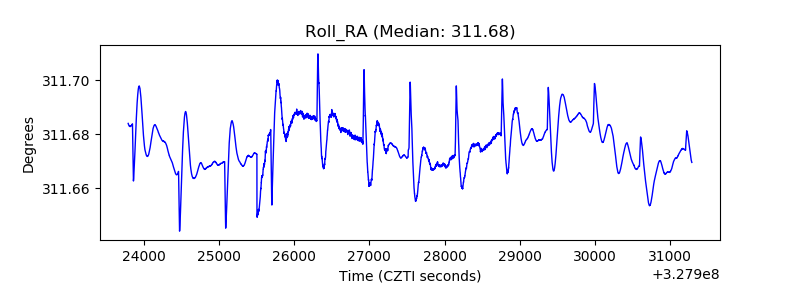 |
| Veto Counter | 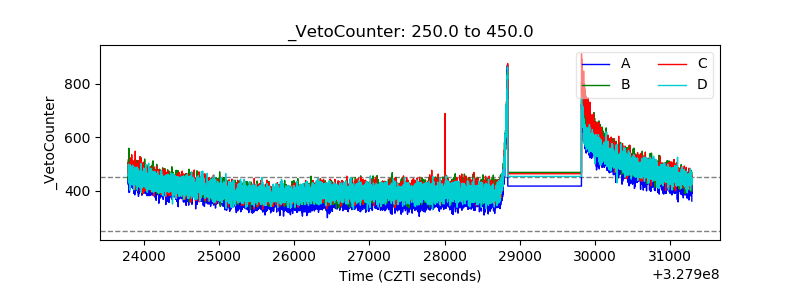 |