| Param | Original file | Final file |
|---|---|---|
| Filename | modeM0/AS1A07_018T09_9000003682_25156cztM0_level2.evt | modeM0/AS1A07_018T09_9000003682_25156cztM0_level2_quad_clean.evt |
| Size (bytes) | 517,556,160 | 77,538,240 |
| Size | 493.6 MB | 73.9 MB |
| Events in quadrant A | 3,467,188 | 486,418 |
| Events in quadrant B | 3,515,351 | 491,588 |
| Events in quadrant C | 3,968,879 | 472,723 |
| Events in quadrant D | 4,302,818 | 464,687 |
| Mode M0 | |||
|---|---|---|---|
| Quadrant | BADHDUFLAG | Total packets | Discarded packets |
| A | 0 | 14431 | 0 |
| B | 0 | 14488 | 0 |
| C | 0 | 15817 | 0 |
| D | 0 | 17157 | 0 |
| Mode M9 | |||
|---|---|---|---|
| Quadrant | BADHDUFLAG | Total packets | Discarded packets |
| A | 0 | 21 | 0 |
| B | 0 | 22 | 0 |
| C | 0 | 22 | 0 |
| D | 0 | 22 | 0 |
| Quadrant | Total seconds | Saturated seconds | Saturation percentage |
|---|---|---|---|
| A | 6196 | 77 | 1.242737% |
| B | 6196 | 99 | 1.597805% |
| C | 6196 | 175 | 2.824403% |
| D | 6196 | 183 | 2.953518% |
Noise dominated data is calculated using 1-second bins in cleaned event files. If a bin has >2000 counts, and if more than 50% of those come from <1% of pixels, then it is considered to be noise-dominated and hence unusable.
| Quadrant | # 1 sec bins | Bins with >0 counts | Bins with >2000 counts | High rate bins dominated by noise | Noise dominated (total time) | Noise dominated (detector-on time) | Marked lightcurve |
|---|---|---|---|---|---|---|---|
| A | 7476 | 6196 | 0 | 0 | 0.00% | 0.00% | 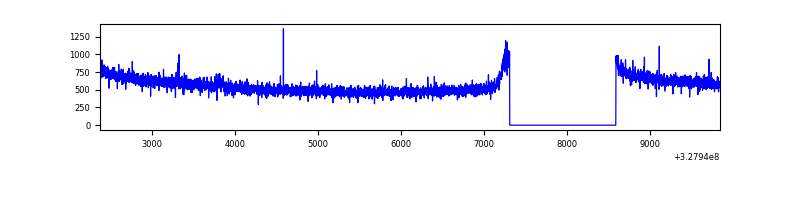 |
| B | 7476 | 6196 | 8 | 8 | 0.11% | 0.13% | 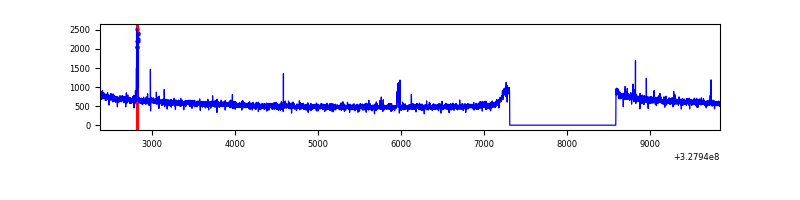 |
| C | 7476 | 6196 | 6 | 6 | 0.08% | 0.10% | 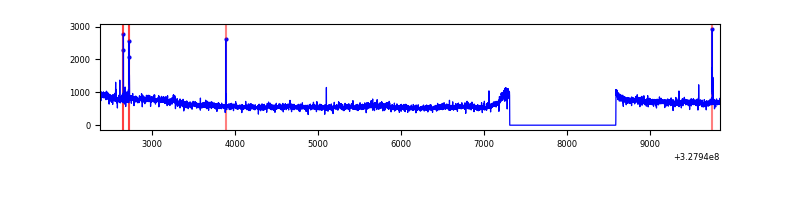 |
| D | 7476 | 6196 | 87 | 87 | 1.16% | 1.40% | 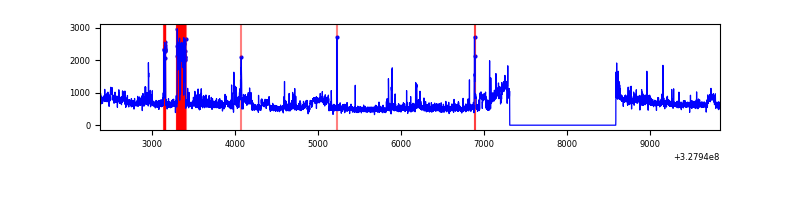 |
Top three noisy pixels from each quadrant. If the there are fewer than three noisy pixels in the level2.evt file, extra rows are filled as -1
| Pixel properties | Quadrant properties | ||||||
|---|---|---|---|---|---|---|---|
| Quadrant | DetID | PixID | Counts | Sigma | Mean | Median | Sigma |
| A | 13 | 254 | 9855 | 50.58 | 897 | 882 | 177.4 |
| A | 0 | 226 | 7878 | 39.44 | 897 | 882 | 177.4 |
| A | 3 | 137 | 7590 | 37.81 | 897 | 882 | 177.4 |
| B | 0 | 190 | 35340 | 209.2 | 888 | 870 | 164.8 |
| B | 12 | 111 | 19299 | 111.85 | 888 | 870 | 164.8 |
| B | 11 | 111 | 17432 | 100.52 | 888 | 870 | 164.8 |
| C | 7 | 247 | 327406 | 1625.93 | 867 | 875 | 200.8 |
| C | 14 | 238 | 141248 | 698.97 | 867 | 875 | 200.8 |
| C | 7 | 87 | 87756 | 432.62 | 867 | 875 | 200.8 |
| D | 1 | 52 | 601876 | 2837.11 | 877 | 854 | 211.8 |
| D | 8 | 195 | 239132 | 1124.79 | 877 | 854 | 211.8 |
| D | 12 | 235 | 164767 | 773.75 | 877 | 854 | 211.8 |
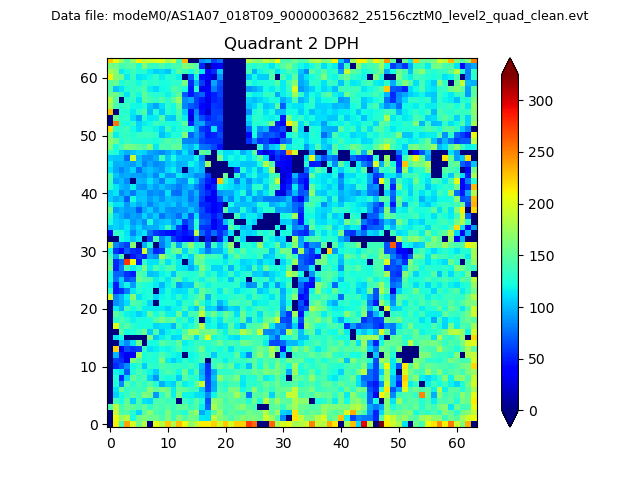
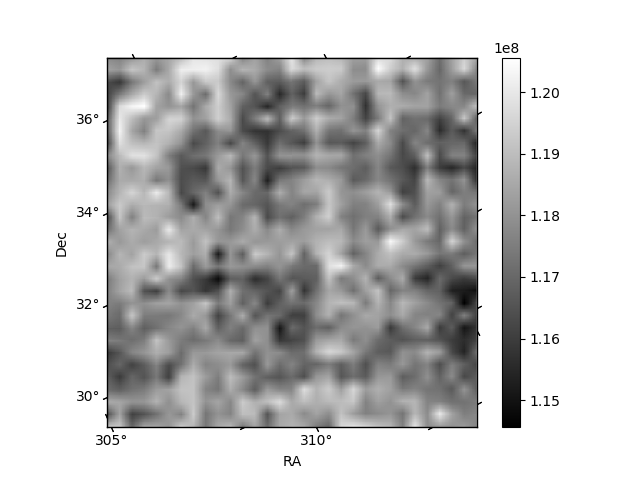
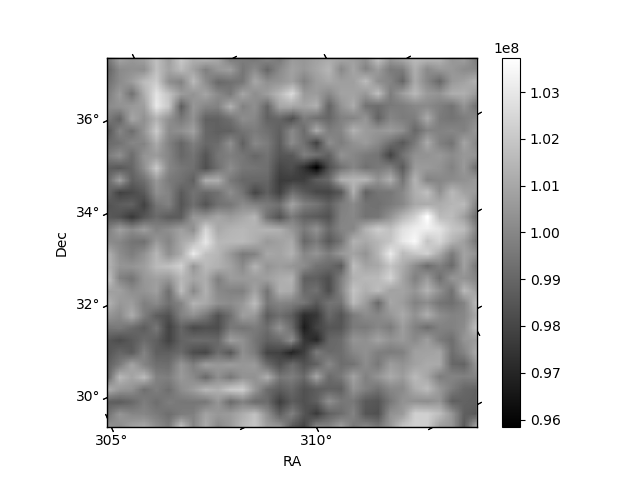
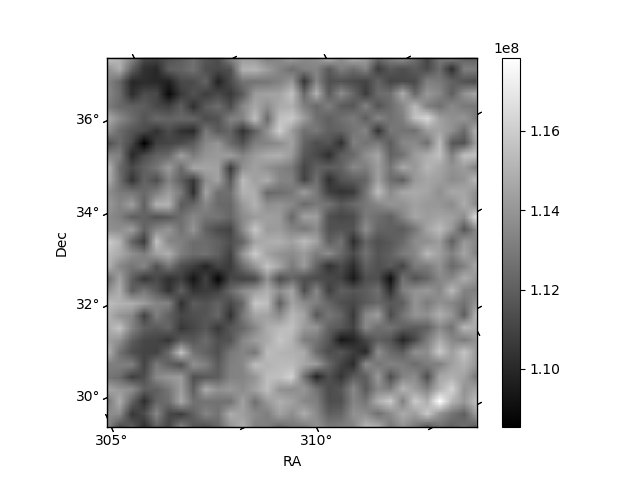
Histogram calculated using DETX and DETY for each event in the final _common_clean file
| Quadrant A | 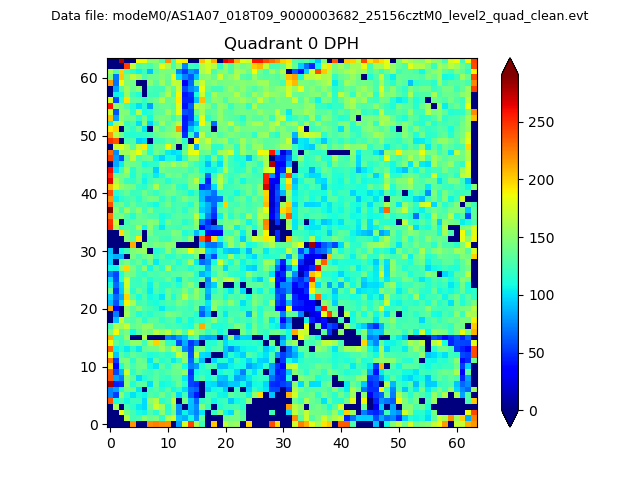 |
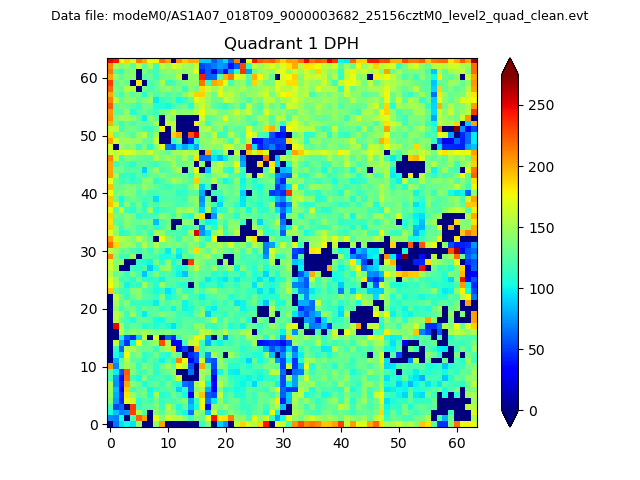 |
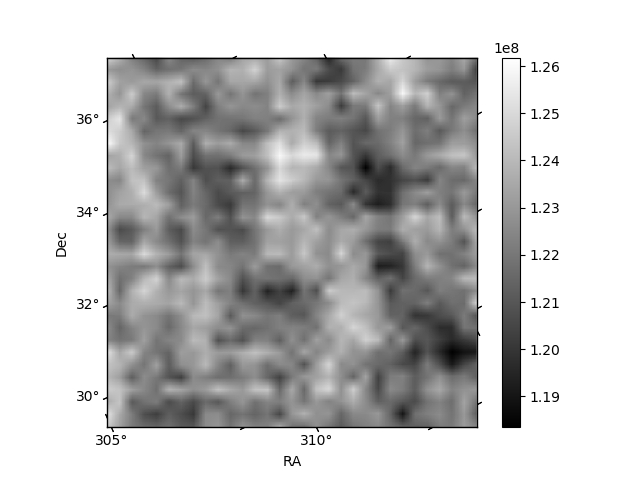
Quadrant B |
|---|---|---|---|
| Quadrant D | 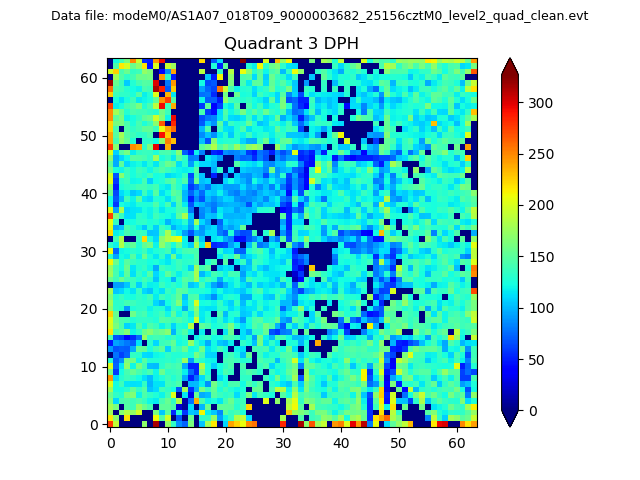 |
 |
Quadrant C |
| Plot type | Count rate plots | Images |
|---|---|---|
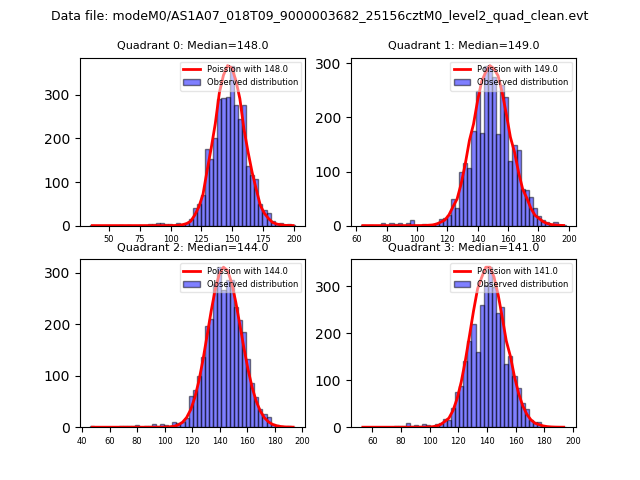
| Comparison with Poisson distribution Blue bars denote a histogram of data divided into 1 sec bins. Red curve is a Poisson curve with rate = median count rate of data. |
 |
 |
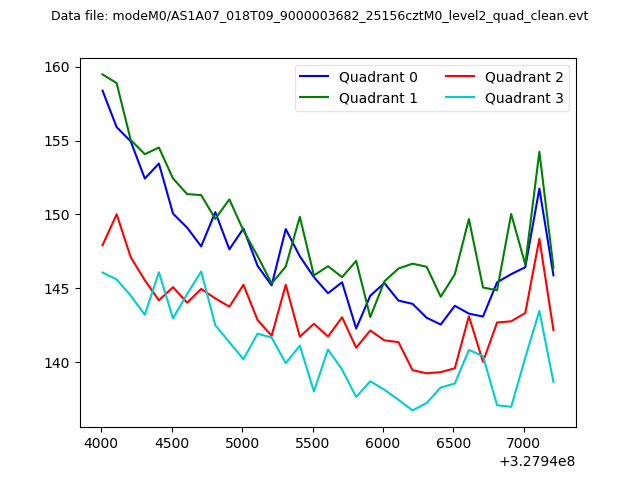
| Quadrant-wise count rates Data is divided into 100 sec bins |
 |
|
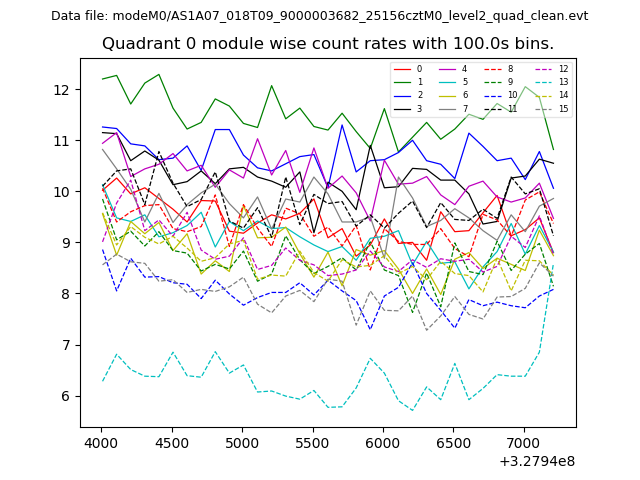
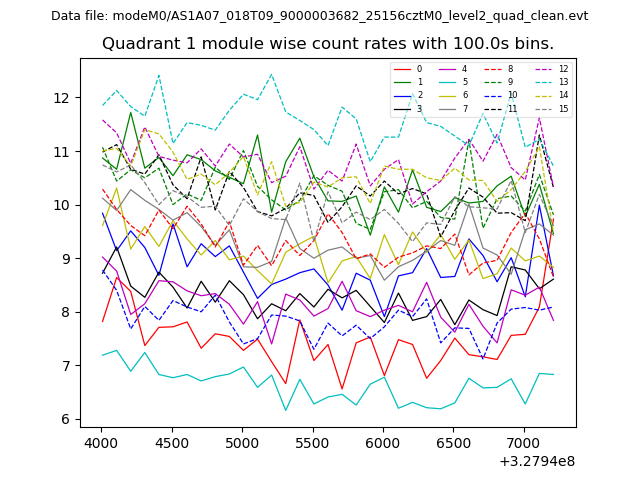
| Module-wise count rates for Quadrant A Data is divided into 100 sec bins |
 |
 |
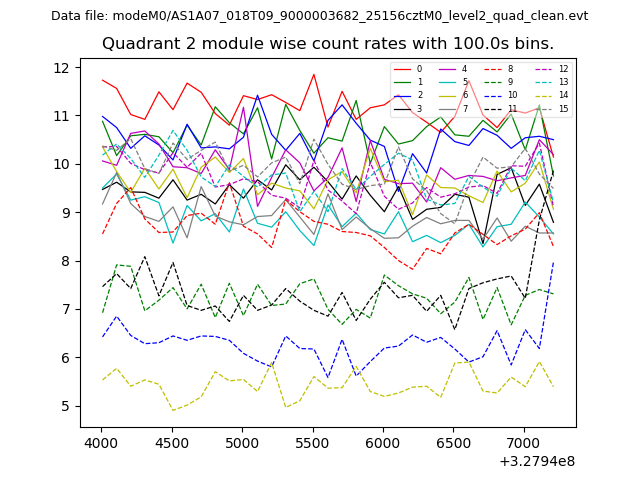
| Module-wise count rates for Quadrant B Data is divided into 100 sec bins |
 |
 |
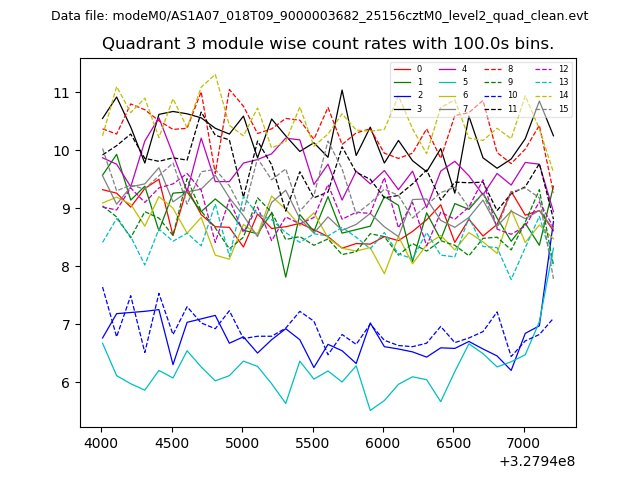
| Module-wise count rates for Quadrant C Data is divided into 100 sec bins |
 |
 |
| Module-wise count rates for Quadrant D Data is divided into 100 sec bins |
 |
 |
| Parameter | Plot |
|---|---|
| CZT HV Monitor | 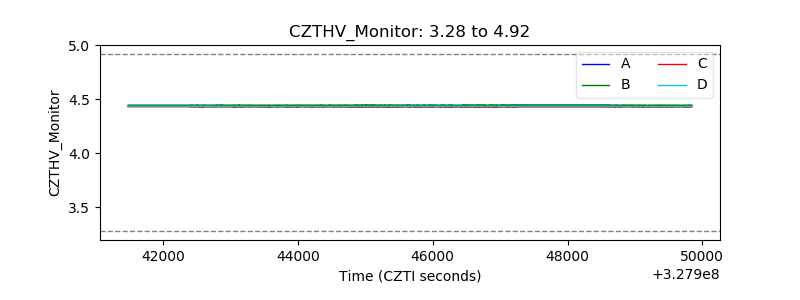 |
| D_VDD | 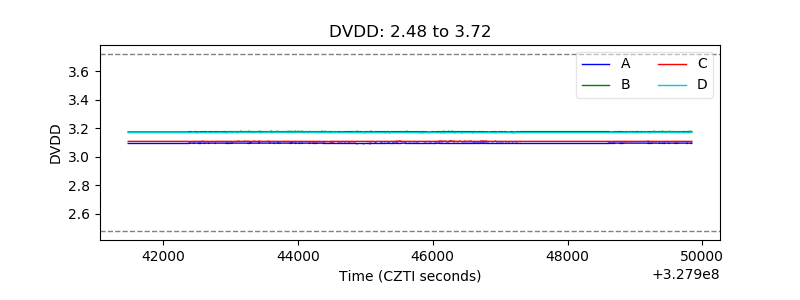 |
| Temperature 1 | 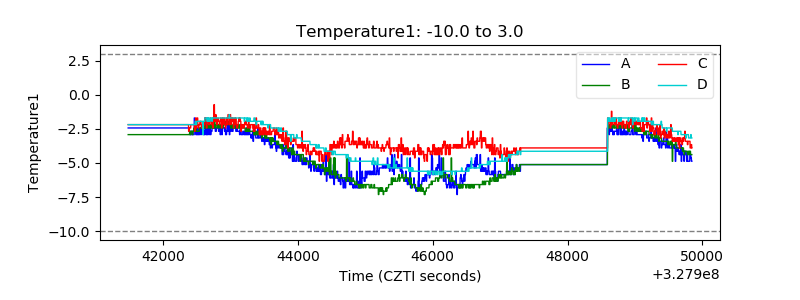 |
| Veto HV Monitor | 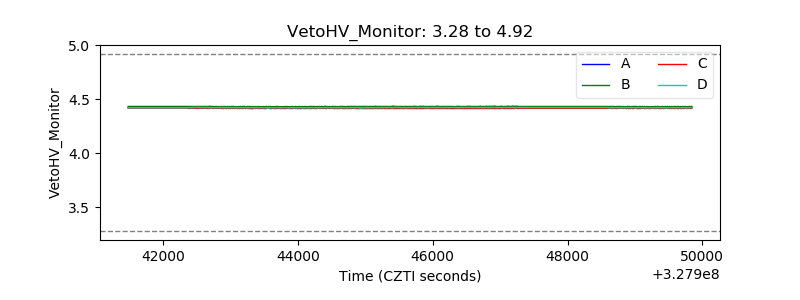 |
| Veto LLD | 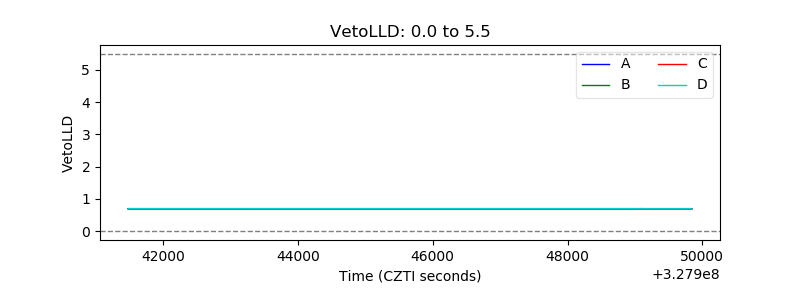 |
| Alpha Counter | 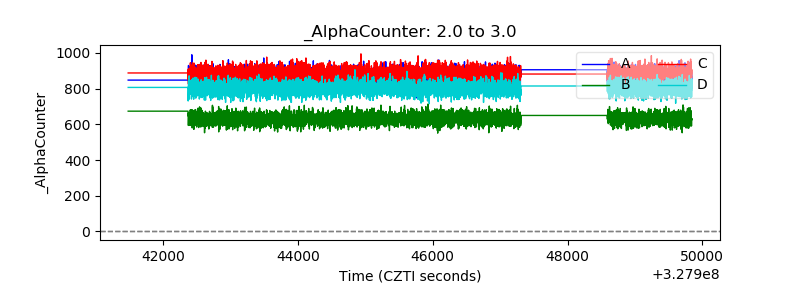 |
| _CPM_Rate | 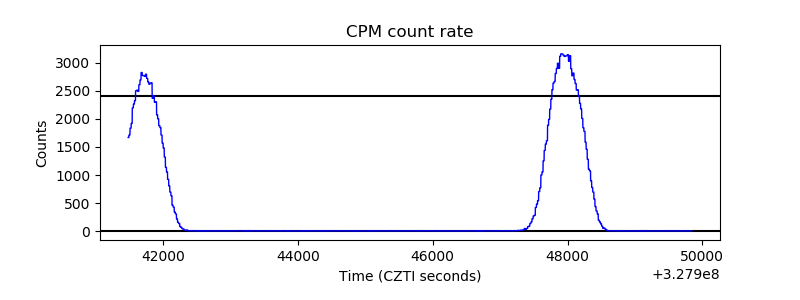 |
| CZT Counter | 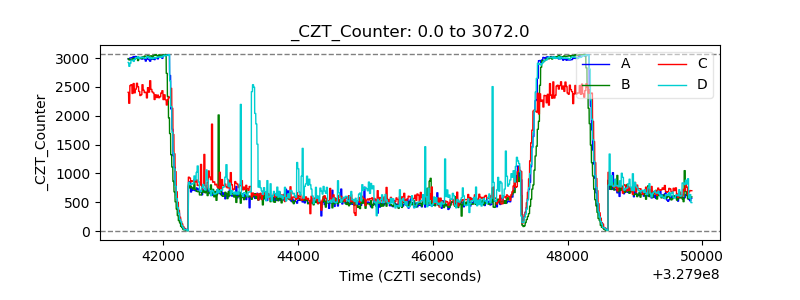 |
| +2.5 Volts monitor |  |
| +5 Volts monitor | 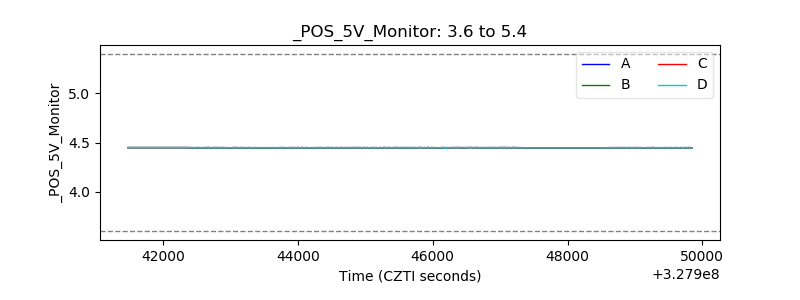 |
| _ROLL_ROT | 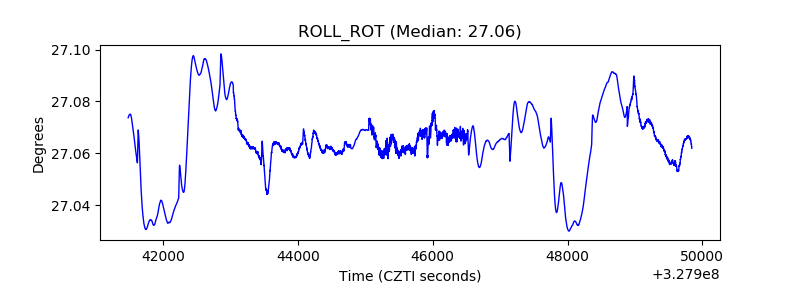 |
| _Roll_DEC | 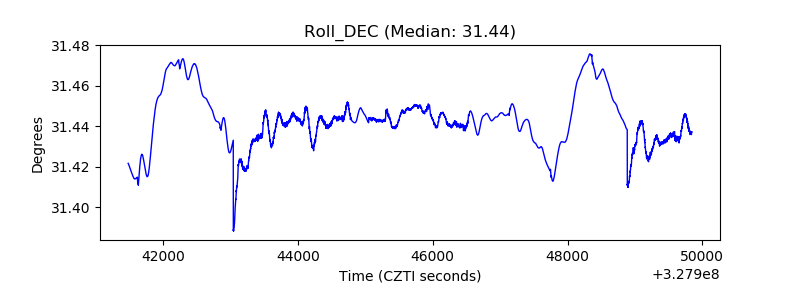 |
| _Roll_RA | 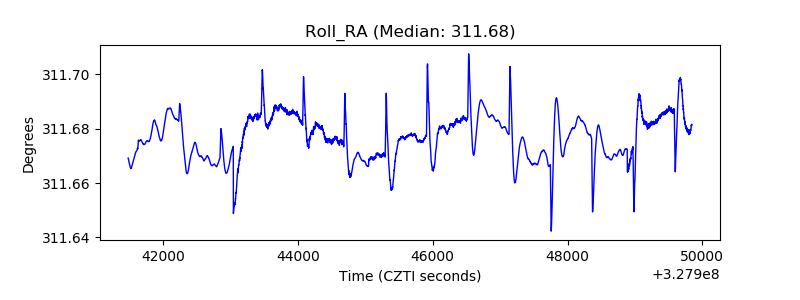 |
| Veto Counter | 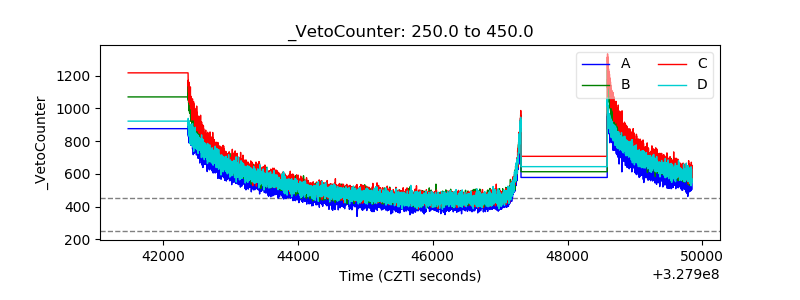 |