| Param | Original file | Final file |
|---|---|---|
| Filename | modeM0/AS1A07_018T09_9000003682_25157cztM0_level2.evt | modeM0/AS1A07_018T09_9000003682_25157cztM0_level2_quad_clean.evt |
| Size (bytes) | 504,731,520 | 93,024,000 |
| Size | 481.3 MB | 88.7 MB |
| Events in quadrant A | 3,396,575 | 604,089 |
| Events in quadrant B | 3,457,479 | 617,575 |
| Events in quadrant C | 3,880,911 | 594,114 |
| Events in quadrant D | 4,136,916 | 575,019 |
| Mode M0 | |||
|---|---|---|---|
| Quadrant | BADHDUFLAG | Total packets | Discarded packets |
| A | 0 | 14106 | 0 |
| B | 0 | 14264 | 0 |
| C | 0 | 15915 | 0 |
| D | 0 | 16464 | 0 |
| Mode M9 | |||
|---|---|---|---|
| Quadrant | BADHDUFLAG | Total packets | Discarded packets |
| A | 0 | 24 | 0 |
| B | 0 | 25 | 0 |
| C | 0 | 25 | 0 |
| D | 0 | 25 | 0 |
| Quadrant | Total seconds | Saturated seconds | Saturation percentage |
|---|---|---|---|
| A | 6106 | 70 | 1.146413% |
| B | 6106 | 81 | 1.326564% |
| C | 6106 | 179 | 2.931543% |
| D | 6106 | 186 | 3.046184% |
Noise dominated data is calculated using 1-second bins in cleaned event files. If a bin has >2000 counts, and if more than 50% of those come from <1% of pixels, then it is considered to be noise-dominated and hence unusable.
| Quadrant | # 1 sec bins | Bins with >0 counts | Bins with >2000 counts | High rate bins dominated by noise | Noise dominated (total time) | Noise dominated (detector-on time) | Marked lightcurve |
|---|---|---|---|---|---|---|---|
| A | 7451 | 6106 | 0 | 0 | 0.00% | 0.00% | 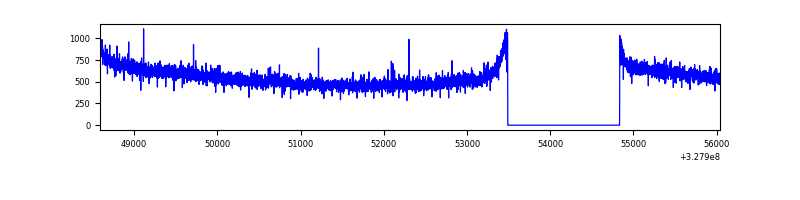 |
| B | 7451 | 6106 | 0 | 0 | 0.00% | 0.00% | 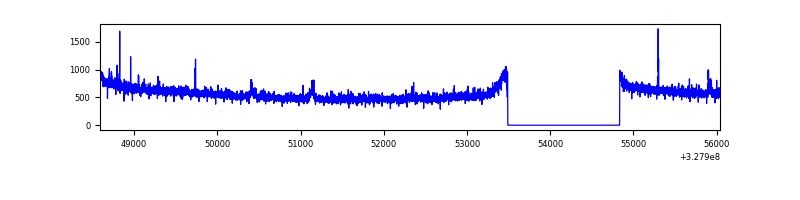 |
| C | 7451 | 6106 | 1 | 1 | 0.01% | 0.02% | 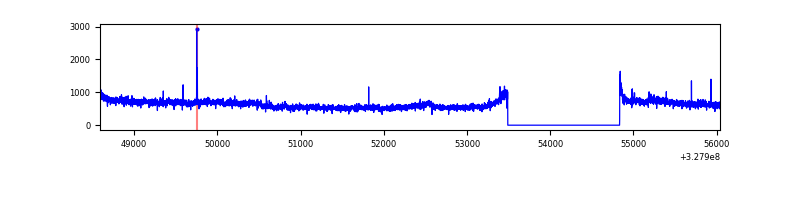 |
| D | 7451 | 6106 | 115 | 115 | 1.54% | 1.88% | 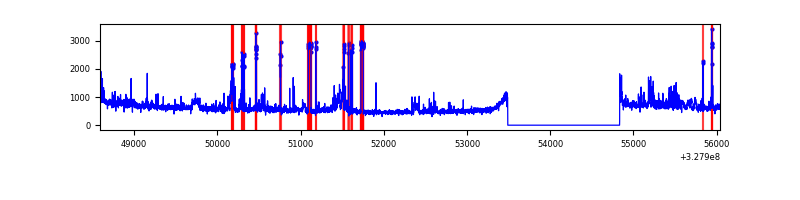 |
Top three noisy pixels from each quadrant. If the there are fewer than three noisy pixels in the level2.evt file, extra rows are filled as -1
| Pixel properties | Quadrant properties | ||||||
|---|---|---|---|---|---|---|---|
| Quadrant | DetID | PixID | Counts | Sigma | Mean | Median | Sigma |
| A | 15 | 192 | 12753 | 68.15 | 877 | 861 | 174.5 |
| A | 13 | 254 | 9967 | 52.18 | 877 | 861 | 174.5 |
| A | 0 | 226 | 7519 | 38.15 | 877 | 861 | 174.5 |
| B | 12 | 111 | 18966 | 111.27 | 876 | 859 | 162.7 |
| B | 11 | 111 | 16983 | 99.08 | 876 | 859 | 162.7 |
| B | 0 | 190 | 16332 | 95.08 | 876 | 859 | 162.7 |
| C | 7 | 247 | 226054 | 1138.31 | 858 | 866 | 197.8 |
| C | 14 | 238 | 139442 | 700.49 | 858 | 866 | 197.8 |
| C | 7 | 87 | 135974 | 682.96 | 858 | 866 | 197.8 |
| D | 1 | 52 | 738637 | 3578.08 | 859 | 837 | 206.2 |
| D | 8 | 195 | 107632 | 517.92 | 859 | 837 | 206.2 |
| D | 12 | 235 | 59099 | 282.55 | 859 | 837 | 206.2 |
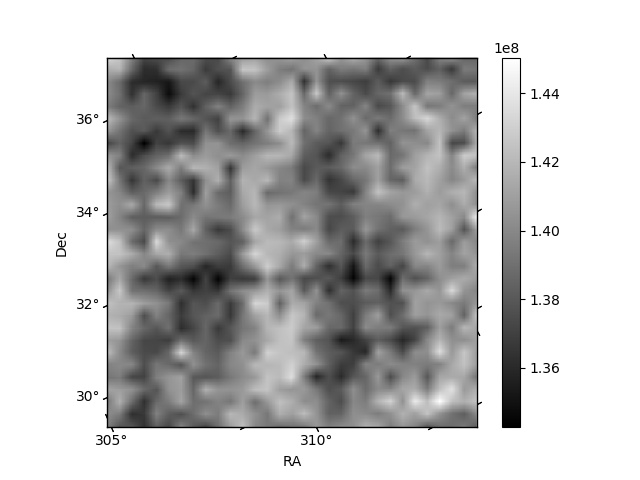
Histogram calculated using DETX and DETY for each event in the final _common_clean file
| Quadrant A |  |
 |
Quadrant B |
|---|---|---|---|
| Quadrant D |  |
 |
Quadrant C |
| Plot type | Count rate plots | Images |
|---|---|---|
| Comparison with Poisson distribution Blue bars denote a histogram of data divided into 1 sec bins. Red curve is a Poisson curve with rate = median count rate of data. |
 |
 |
| Quadrant-wise count rates Data is divided into 100 sec bins |
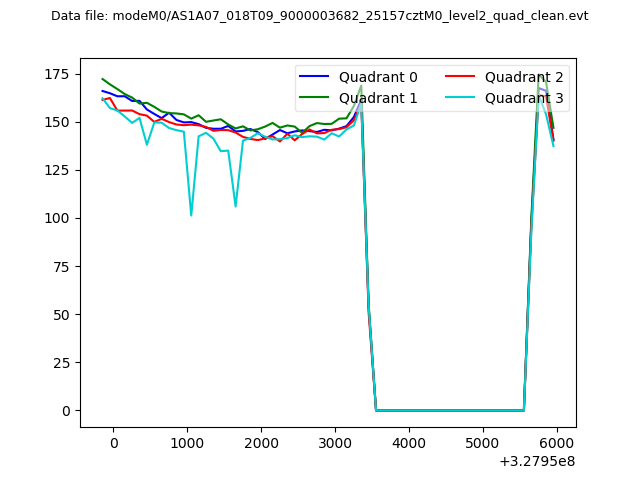 |
|
| Module-wise count rates for Quadrant A Data is divided into 100 sec bins |
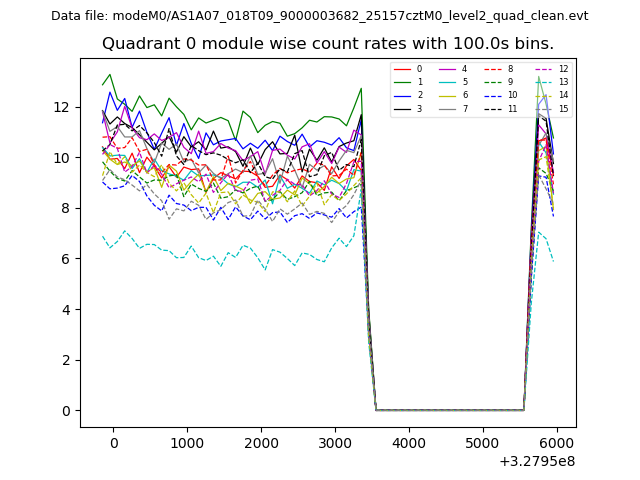 |
 |
| Module-wise count rates for Quadrant B Data is divided into 100 sec bins |
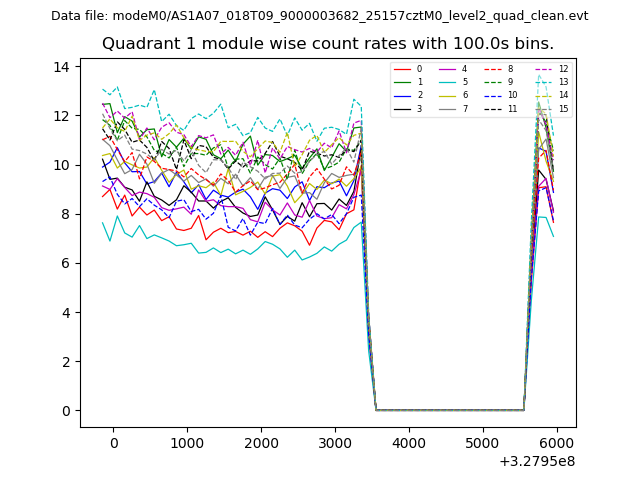 |
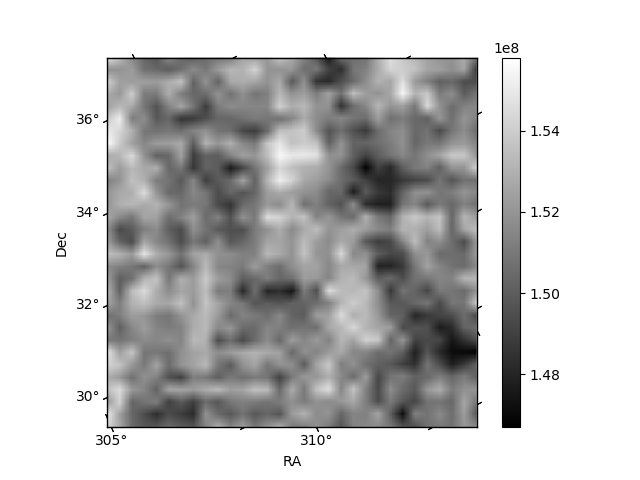 |
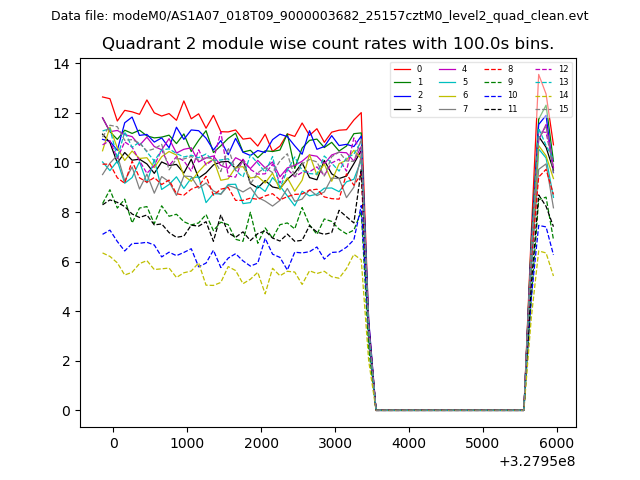
| Module-wise count rates for Quadrant C Data is divided into 100 sec bins |
 |
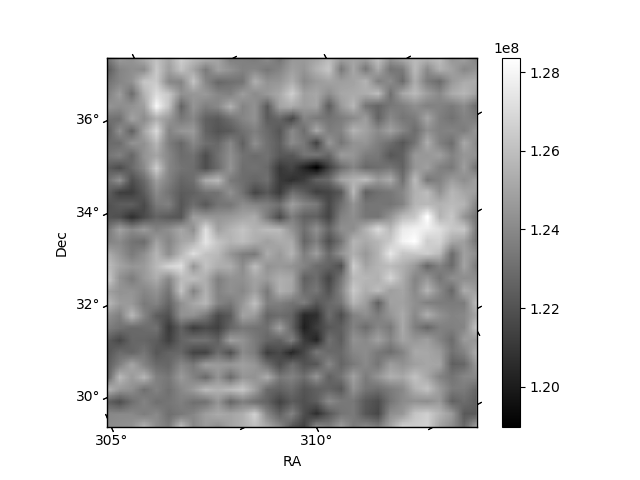 |
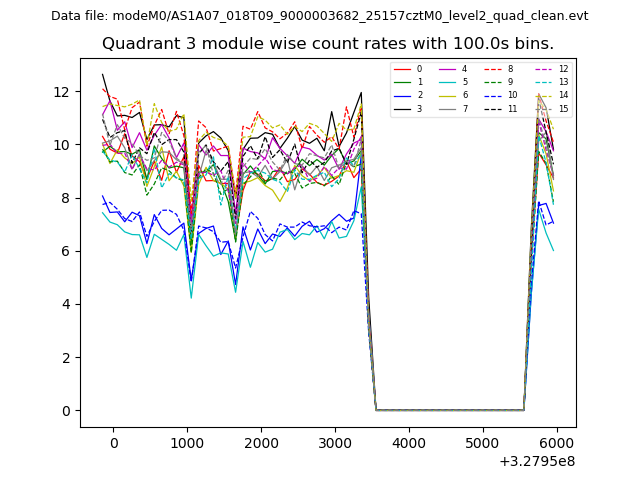
| Module-wise count rates for Quadrant D Data is divided into 100 sec bins |
 |
 |
| Parameter | Plot |
|---|---|
| CZT HV Monitor | 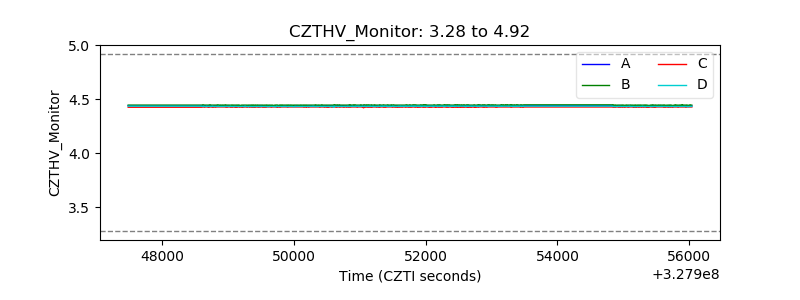 |
| D_VDD | 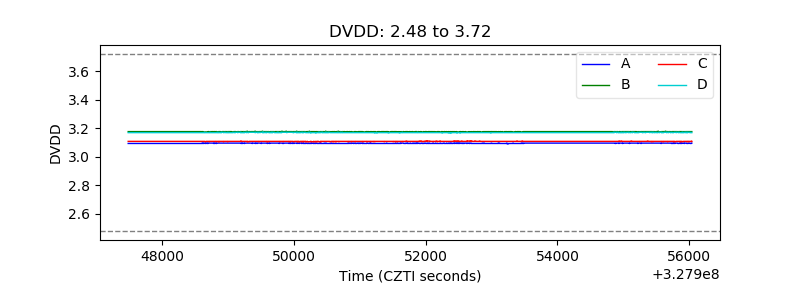 |
| Temperature 1 | 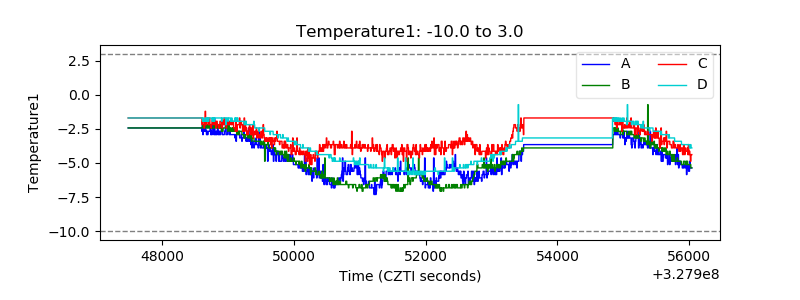 |
| Veto HV Monitor | 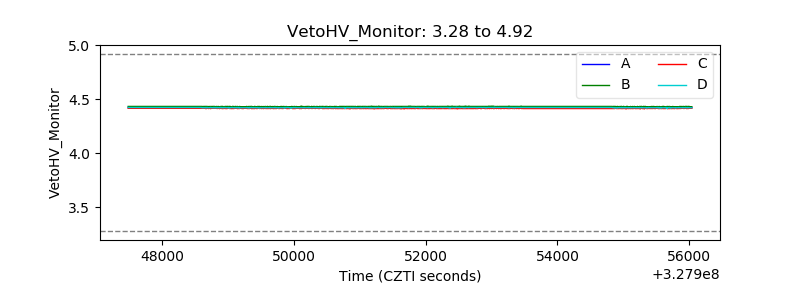 |
| Veto LLD | 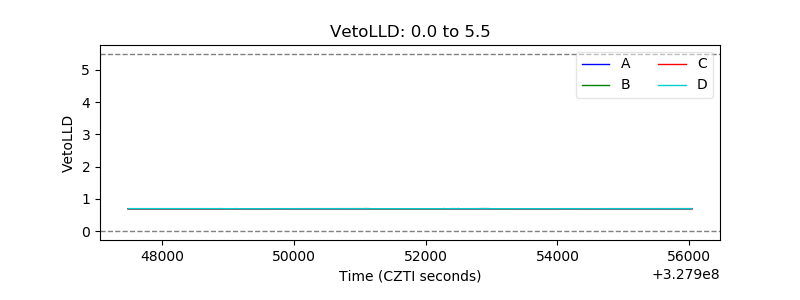 |
| Alpha Counter | 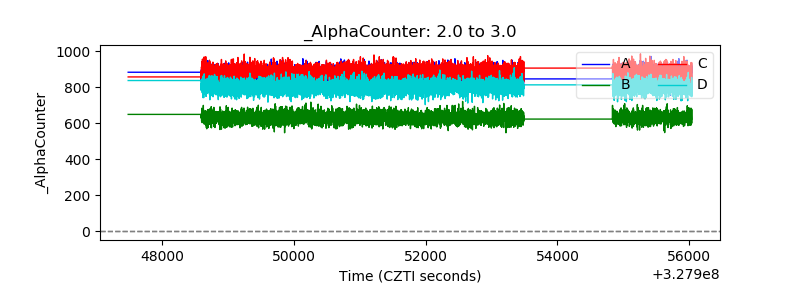 |
| _CPM_Rate | 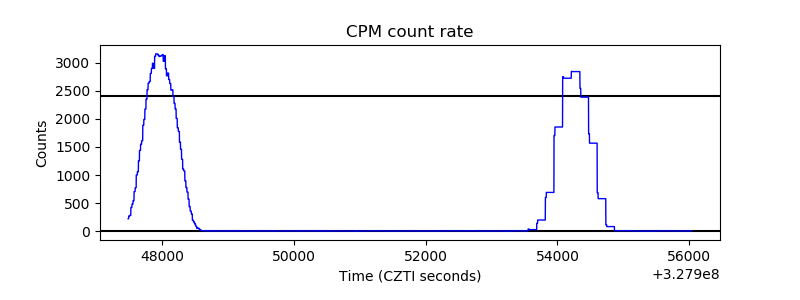 |
| CZT Counter |  |
| +2.5 Volts monitor |  |
| +5 Volts monitor | 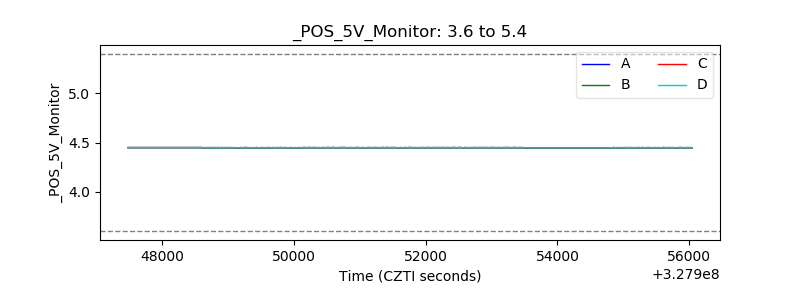 |
| _ROLL_ROT | 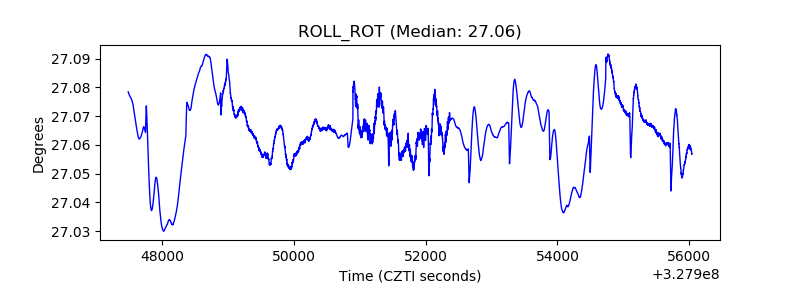 |
| _Roll_DEC |  |
| _Roll_RA |  |
| Veto Counter | 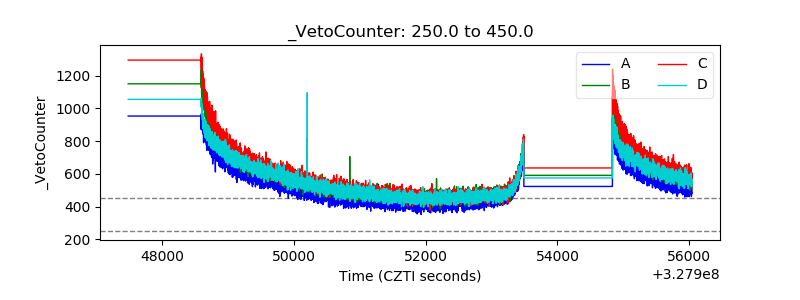 |