| Param | Original file | Final file |
|---|---|---|
| Filename | modeM0/AS1A07_018T09_9000003682_25158cztM0_level2.evt | modeM0/AS1A07_018T09_9000003682_25158cztM0_level2_quad_clean.evt |
| Size (bytes) | 514,607,040 | 101,839,680 |
| Size | 490.8 MB | 97.1 MB |
| Events in quadrant A | 3,331,962 | 671,260 |
| Events in quadrant B | 3,409,302 | 691,207 |
| Events in quadrant C | 3,682,033 | 666,430 |
| Events in quadrant D | 4,738,211 | 619,525 |
| Mode M0 | |||
|---|---|---|---|
| Quadrant | BADHDUFLAG | Total packets | Discarded packets |
| A | 0 | 13885 | 0 |
| B | 0 | 14079 | 0 |
| C | 0 | 14977 | 0 |
| D | 0 | 18213 | 0 |
| Mode M9 | |||
|---|---|---|---|
| Quadrant | BADHDUFLAG | Total packets | Discarded packets |
| A | 0 | 27 | 0 |
| B | 0 | 27 | 0 |
| C | 0 | 27 | 0 |
| D | 0 | 27 | 0 |
| Quadrant | Total seconds | Saturated seconds | Saturation percentage |
|---|---|---|---|
| A | 6244 | 100 | 1.601537% |
| B | 6245 | 119 | 1.905524% |
| C | 6245 | 208 | 3.330665% |
| D | 6245 | 495 | 7.926341% |
Noise dominated data is calculated using 1-second bins in cleaned event files. If a bin has >2000 counts, and if more than 50% of those come from <1% of pixels, then it is considered to be noise-dominated and hence unusable.
| Quadrant | # 1 sec bins | Bins with >0 counts | Bins with >2000 counts | High rate bins dominated by noise | Noise dominated (total time) | Noise dominated (detector-on time) | Marked lightcurve |
|---|---|---|---|---|---|---|---|
| A | 8914 | 6245 | 0 | 0 | 0.00% | 0.00% | 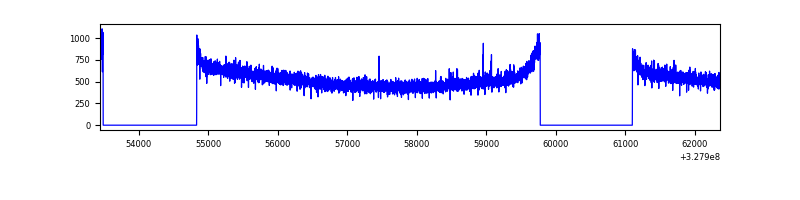 |
| B | 8915 | 6245 | 1 | 1 | 0.01% | 0.02% | 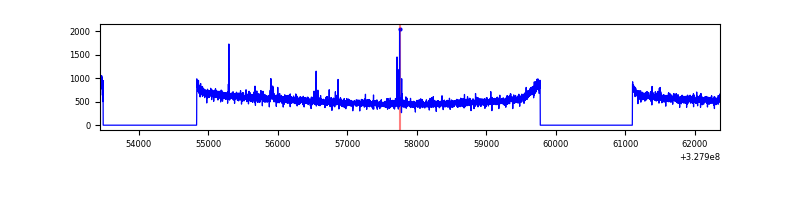 |
| C | 8915 | 6245 | 0 | 0 | 0.00% | 0.00% | 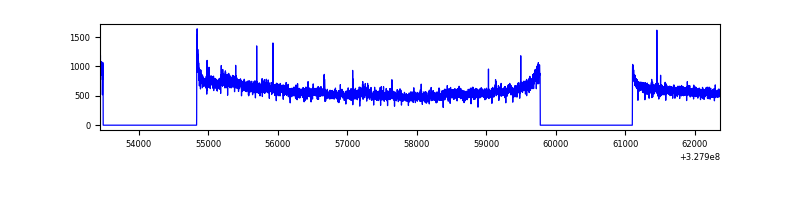 |
| D | 8914 | 6245 | 363 | 363 | 4.07% | 5.81% | 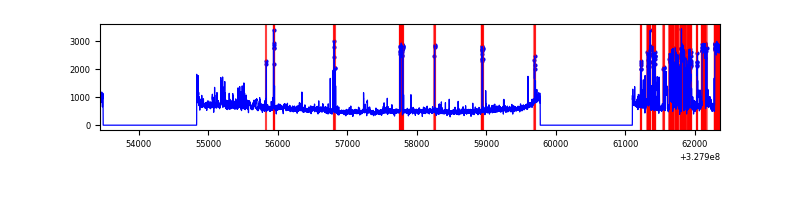 |
Top three noisy pixels from each quadrant. If the there are fewer than three noisy pixels in the level2.evt file, extra rows are filled as -1
| Pixel properties | Quadrant properties | ||||||
|---|---|---|---|---|---|---|---|
| Quadrant | DetID | PixID | Counts | Sigma | Mean | Median | Sigma |
| A | 13 | 254 | 9981 | 52.97 | 863 | 848 | 172.4 |
| A | 3 | 137 | 7601 | 39.17 | 863 | 848 | 172.4 |
| A | 0 | 226 | 7253 | 37.15 | 863 | 848 | 172.4 |
| B | 12 | 111 | 19032 | 111.83 | 865 | 844 | 162.6 |
| B | 11 | 111 | 16912 | 98.8 | 865 | 844 | 162.6 |
| B | 14 | 111 | 15460 | 89.87 | 865 | 844 | 162.6 |
| C | 7 | 247 | 137458 | 696.77 | 848 | 857 | 196.0 |
| C | 14 | 238 | 134237 | 680.34 | 848 | 857 | 196.0 |
| C | 7 | 87 | 74015 | 373.16 | 848 | 857 | 196.0 |
| D | 1 | 52 | 1409730 | 7044.87 | 830 | 807 | 200.0 |
| D | 8 | 195 | 126432 | 628.15 | 830 | 807 | 200.0 |
| D | 12 | 235 | 63204 | 312.0 | 830 | 807 | 200.0 |
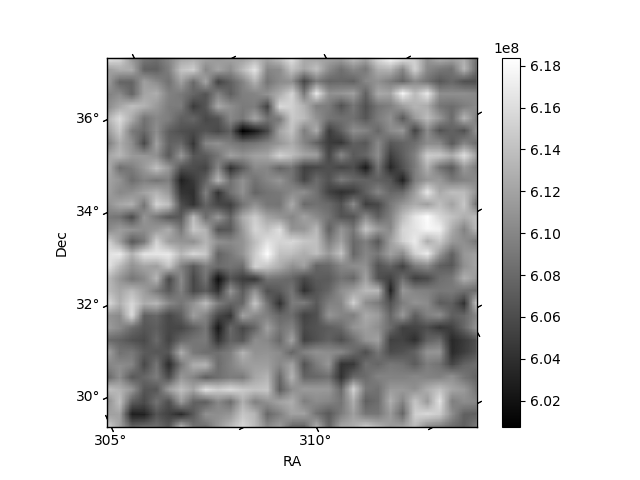
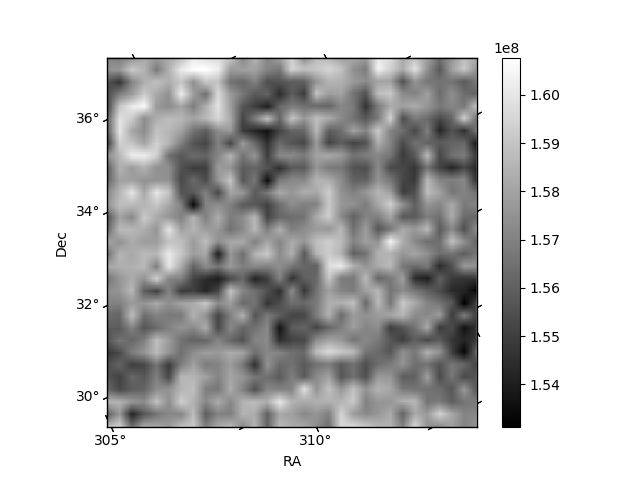
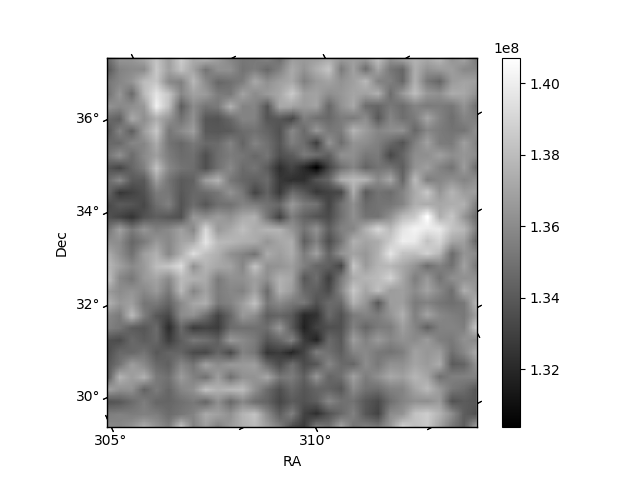
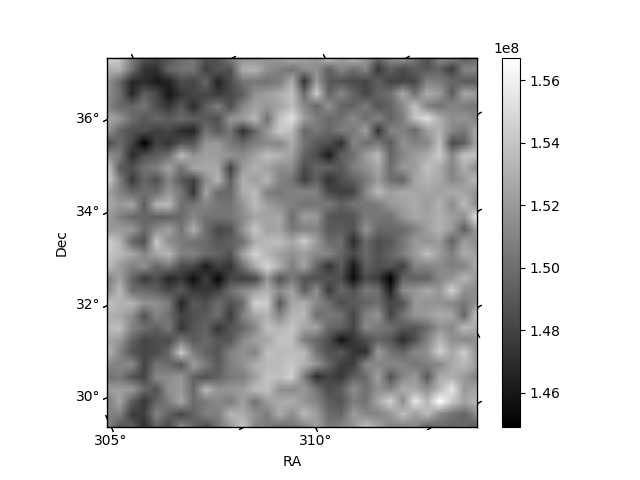
Histogram calculated using DETX and DETY for each event in the final _common_clean file
| Quadrant A | 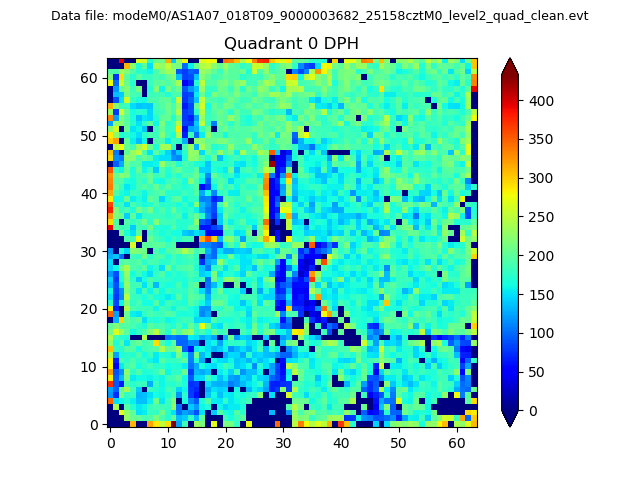 |
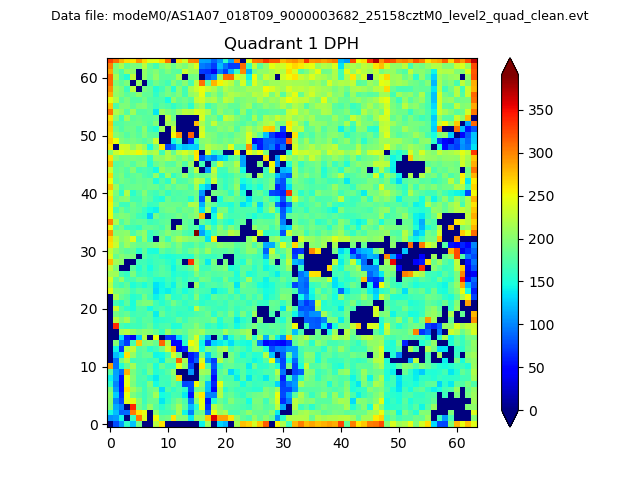 |
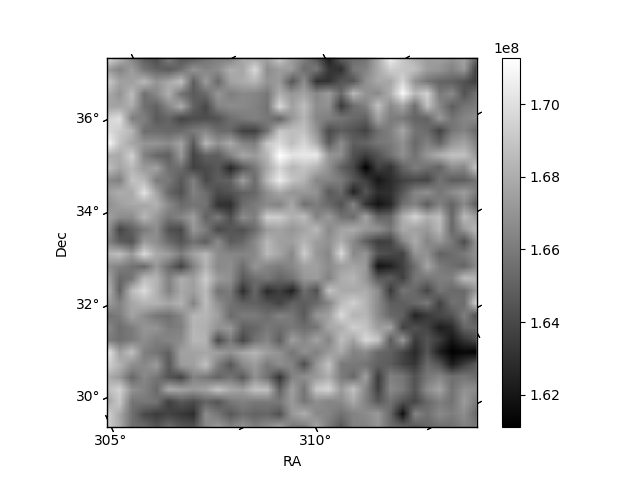
Quadrant B |
|---|---|---|---|
| Quadrant D | 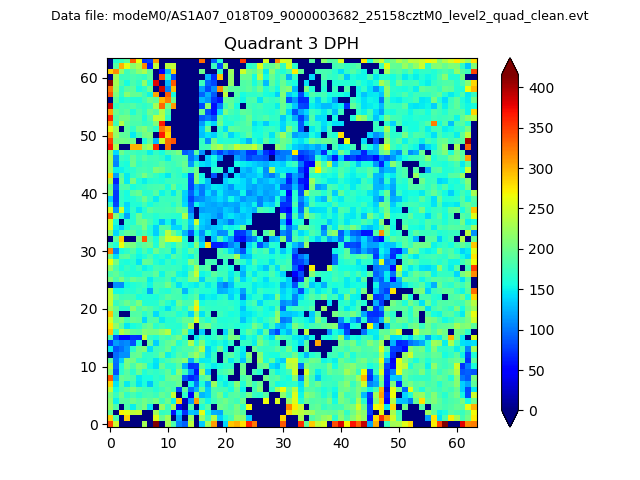 |
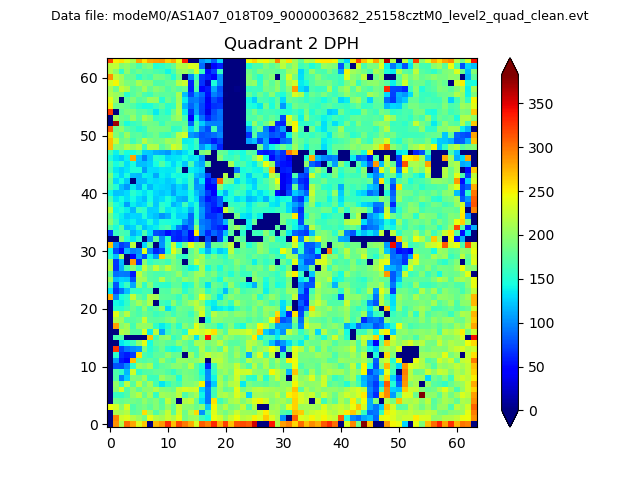 |
Quadrant C |
| Plot type | Count rate plots | Images |
|---|---|---|
| Comparison with Poisson distribution Blue bars denote a histogram of data divided into 1 sec bins. Red curve is a Poisson curve with rate = median count rate of data. |
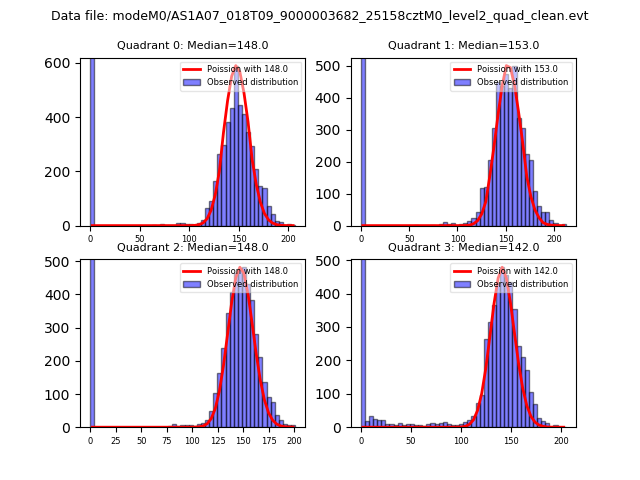 |
 |
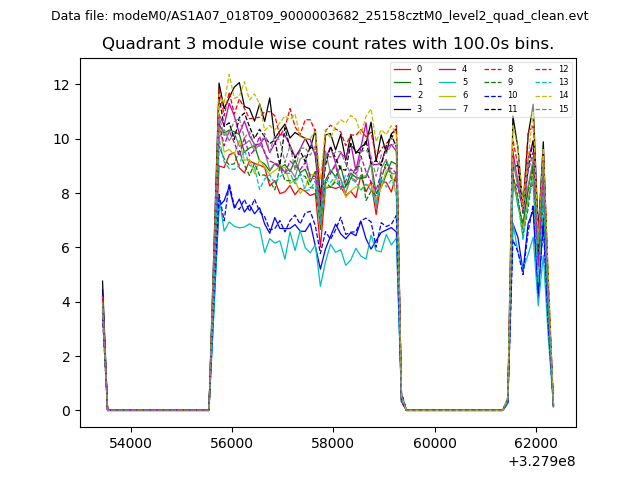
| Quadrant-wise count rates Data is divided into 100 sec bins |
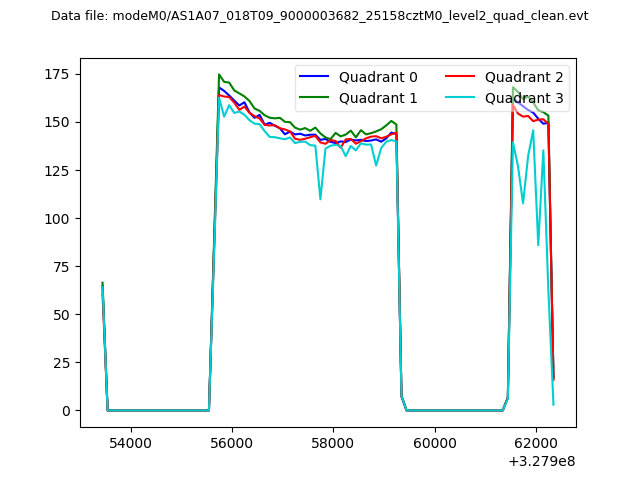 |
|
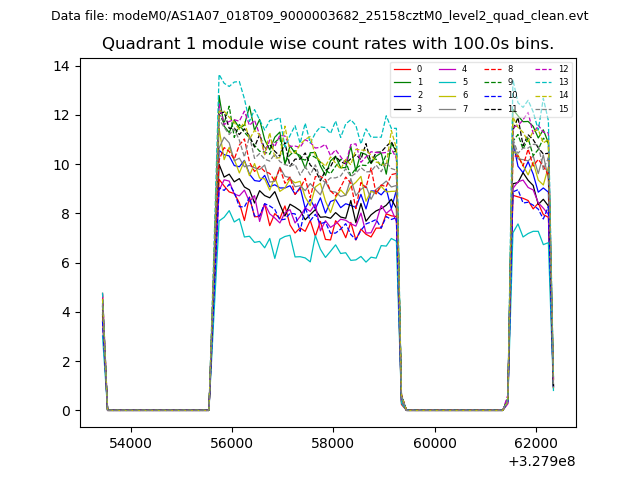
| Module-wise count rates for Quadrant A Data is divided into 100 sec bins |
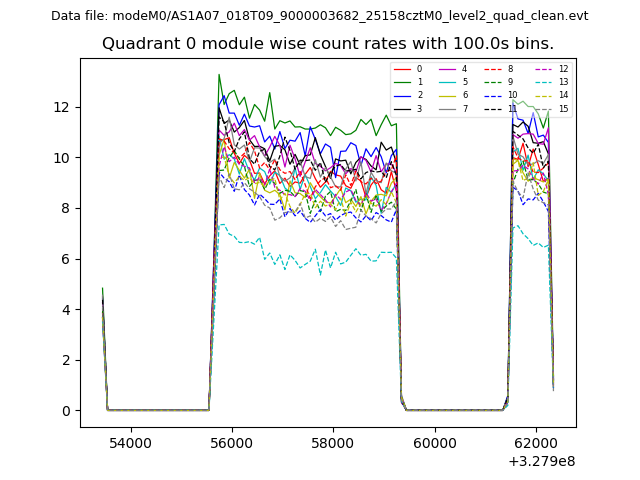 |
 |
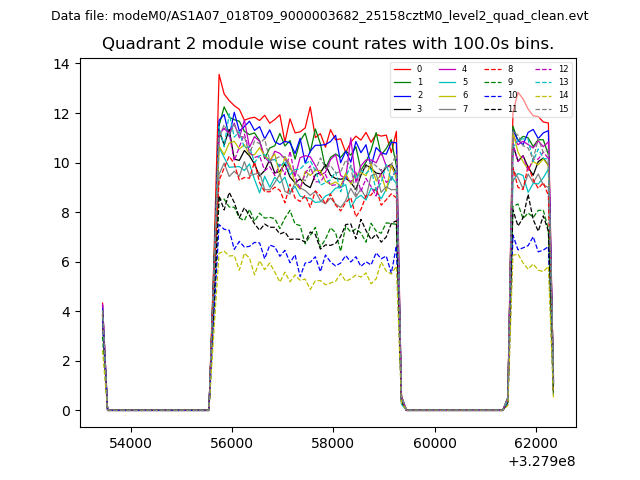
| Module-wise count rates for Quadrant B Data is divided into 100 sec bins |
 |
 |
| Module-wise count rates for Quadrant C Data is divided into 100 sec bins |
 |
 |
| Module-wise count rates for Quadrant D Data is divided into 100 sec bins |
 |
 |
| Parameter | Plot |
|---|---|
| CZT HV Monitor | 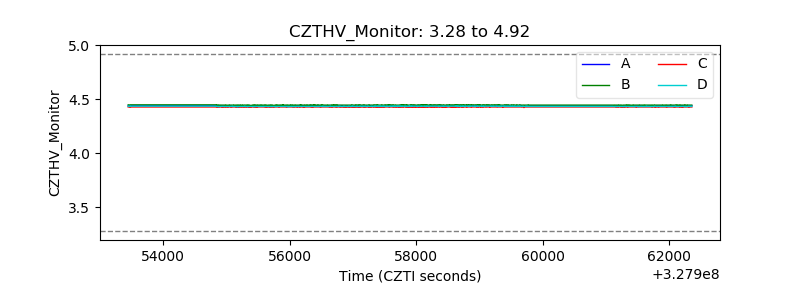 |
| D_VDD | 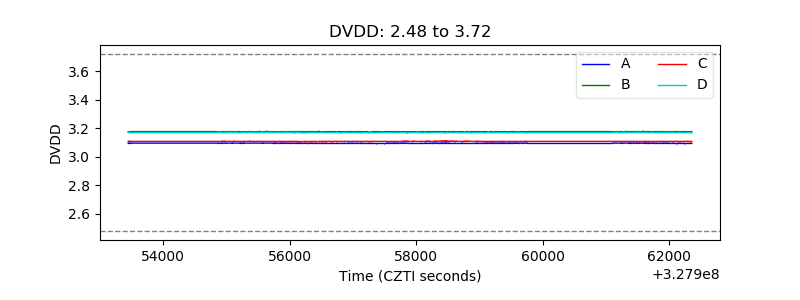 |
| Temperature 1 | 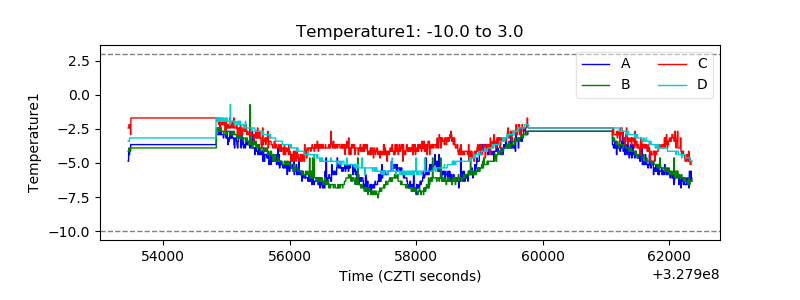 |
| Veto HV Monitor | 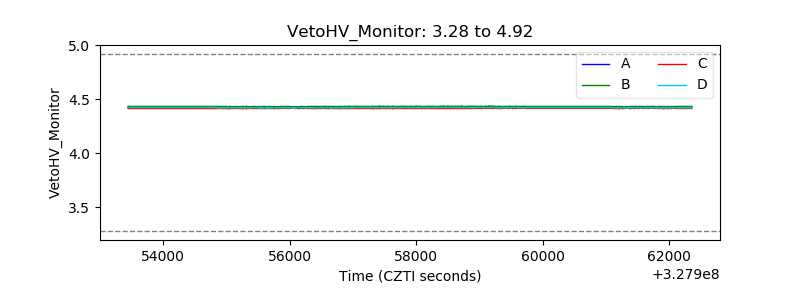 |
| Veto LLD | 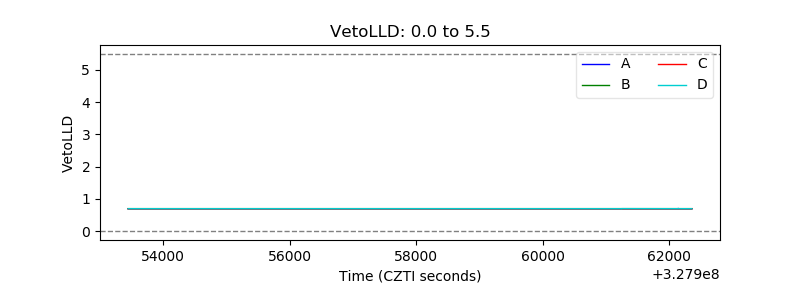 |
| Alpha Counter | 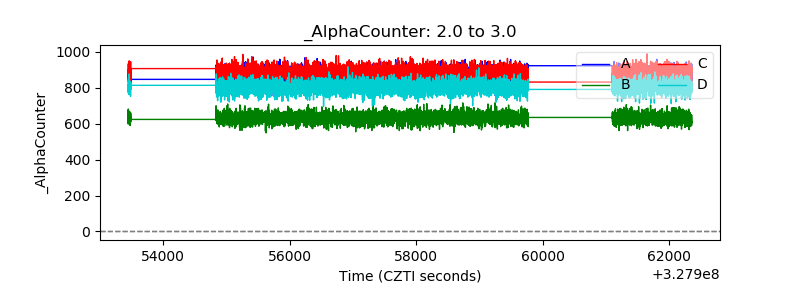 |
| _CPM_Rate | 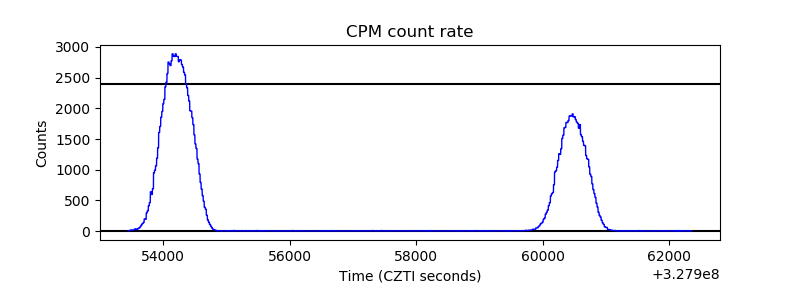 |
| CZT Counter |  |
| +2.5 Volts monitor |  |
| +5 Volts monitor |  |
| _ROLL_ROT | 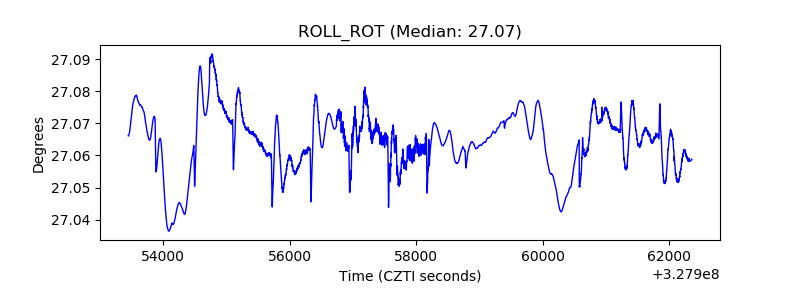 |
| _Roll_DEC | 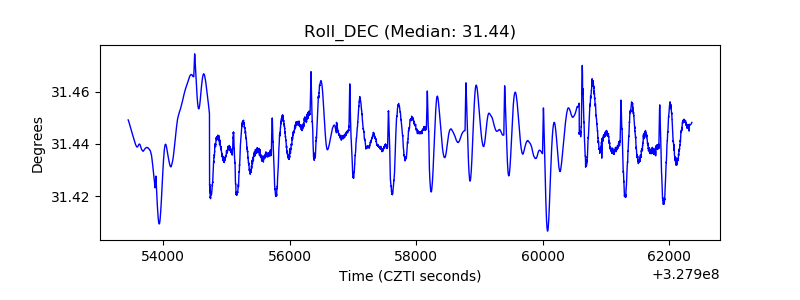 |
| _Roll_RA | 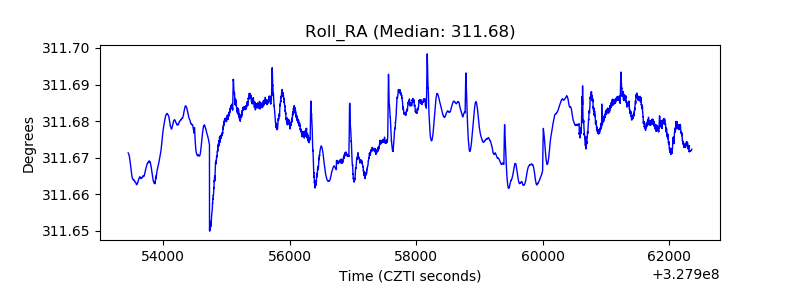 |
| Veto Counter | 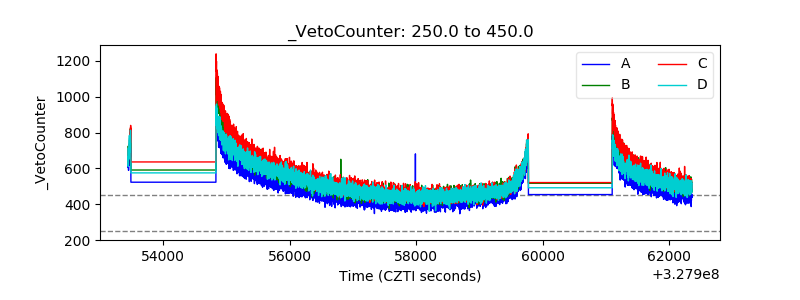 |