| Param | Original file | Final file |
|---|---|---|
| Filename | modeM0/AS1A07_018T09_9000003682_25159cztM0_level2.evt | modeM0/AS1A07_018T09_9000003682_25159cztM0_level2_quad_clean.evt |
| Size (bytes) | 259,168,320 | 35,933,760 |
| Size | 247.2 MB | 34.3 MB |
| Events in quadrant A | 1,301,151 | 247,599 |
| Events in quadrant B | 1,343,499 | 254,202 |
| Events in quadrant C | 1,924,505 | 232,449 |
| Events in quadrant D | 3,115,604 | 180,967 |
| Mode M0 | |||
|---|---|---|---|
| Quadrant | BADHDUFLAG | Total packets | Discarded packets |
| A | 0 | 5378 | 0 |
| B | 0 | 5487 | 0 |
| C | 0 | 7330 | 0 |
| D | 0 | 10944 | 0 |
| Mode M9 | |||
|---|---|---|---|
| Quadrant | BADHDUFLAG | Total packets | Discarded packets |
| A | 0 | 14 | 0 |
| B | 0 | 14 | 0 |
| C | 0 | 14 | 0 |
| D | 0 | 14 | 0 |
| Quadrant | Total seconds | Saturated seconds | Saturation percentage |
|---|---|---|---|
| A | 2399 | 51 | 2.125886% |
| B | 2399 | 64 | 2.667778% |
| C | 2399 | 312 | 13.005419% |
| D | 2399 | 634 | 26.427678% |
Noise dominated data is calculated using 1-second bins in cleaned event files. If a bin has >2000 counts, and if more than 50% of those come from <1% of pixels, then it is considered to be noise-dominated and hence unusable.
| Quadrant | # 1 sec bins | Bins with >0 counts | Bins with >2000 counts | High rate bins dominated by noise | Noise dominated (total time) | Noise dominated (detector-on time) | Marked lightcurve |
|---|---|---|---|---|---|---|---|
| A | 3724 | 2400 | 0 | 0 | 0.00% | 0.00% | 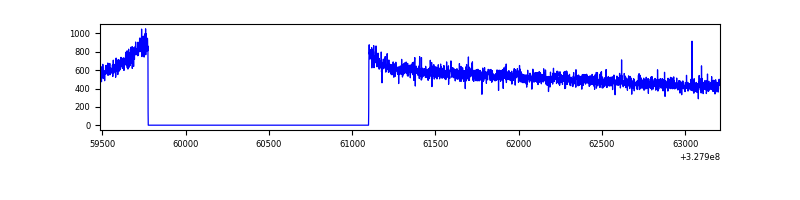 |
| B | 3724 | 2399 | 0 | 0 | 0.00% | 0.00% | 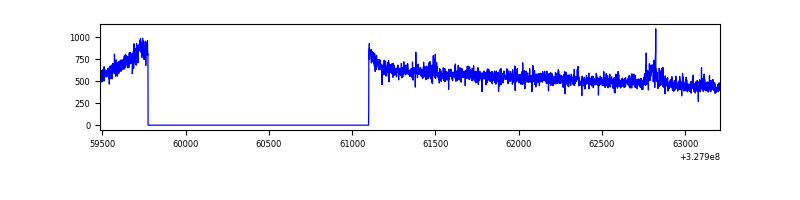 |
| C | 3724 | 2399 | 129 | 129 | 3.46% | 5.38% | 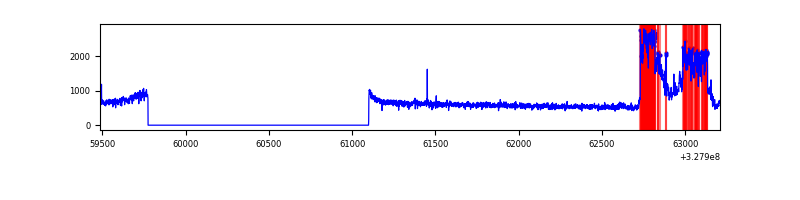 |
| D | 3724 | 2400 | 605 | 605 | 16.25% | 25.21% | 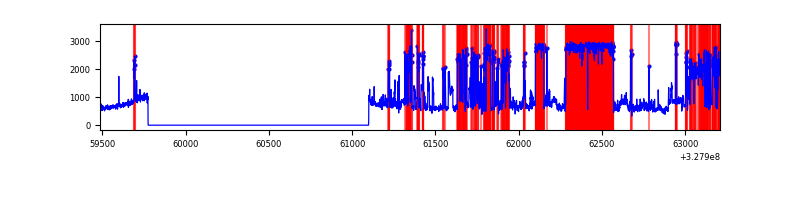 |
Top three noisy pixels from each quadrant. If the there are fewer than three noisy pixels in the level2.evt file, extra rows are filled as -1
| Pixel properties | Quadrant properties | ||||||
|---|---|---|---|---|---|---|---|
| Quadrant | DetID | PixID | Counts | Sigma | Mean | Median | Sigma |
| A | 13 | 254 | 3999 | 53.1 | 337 | 330 | 69.1 |
| A | 3 | 137 | 3057 | 39.46 | 337 | 330 | 69.1 |
| A | 0 | 226 | 2810 | 35.89 | 337 | 330 | 69.1 |
| B | 0 | 189 | 9155 | 134.06 | 338 | 330 | 65.8 |
| B | 0 | 229 | 8952 | 130.98 | 338 | 330 | 65.8 |
| B | 12 | 111 | 7581 | 110.15 | 338 | 330 | 65.8 |
| C | 9 | 54 | 571228 | 7303.59 | 327 | 329 | 78.2 |
| C | 14 | 238 | 51428 | 653.72 | 327 | 329 | 78.2 |
| C | 7 | 247 | 20937 | 263.64 | 327 | 329 | 78.2 |
| D | 1 | 52 | 1930775 | 27049.06 | 289 | 281 | 71.4 |
| D | 8 | 195 | 62475 | 871.43 | 289 | 281 | 71.4 |
| D | 12 | 235 | 24497 | 339.3 | 289 | 281 | 71.4 |
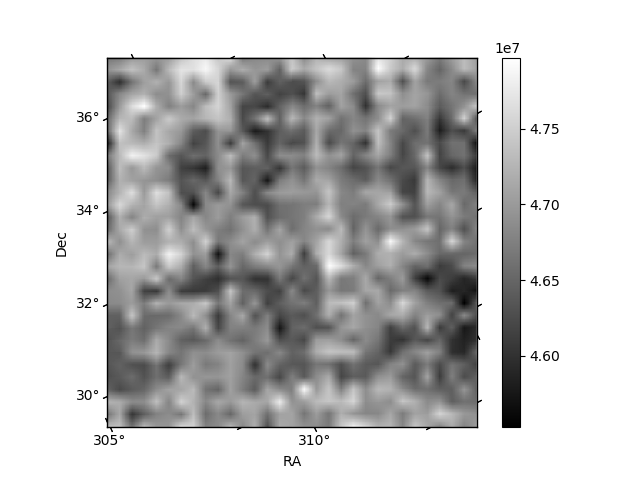
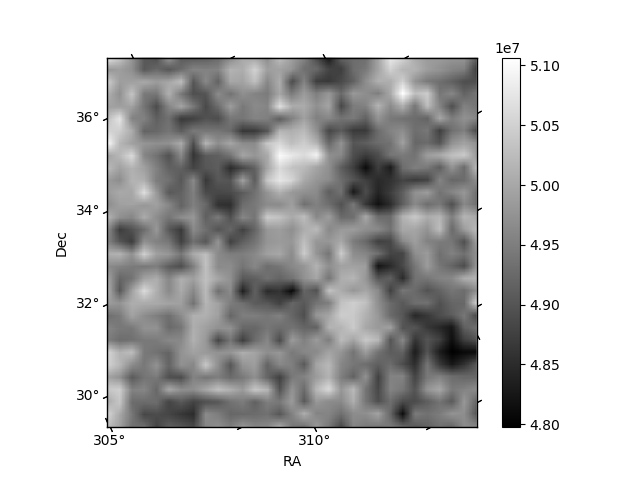
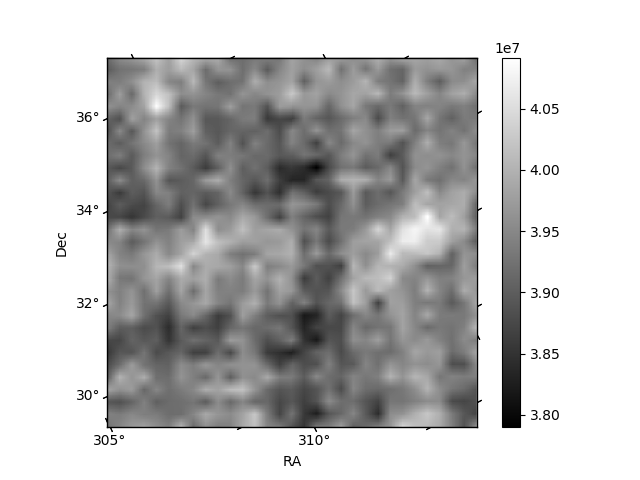
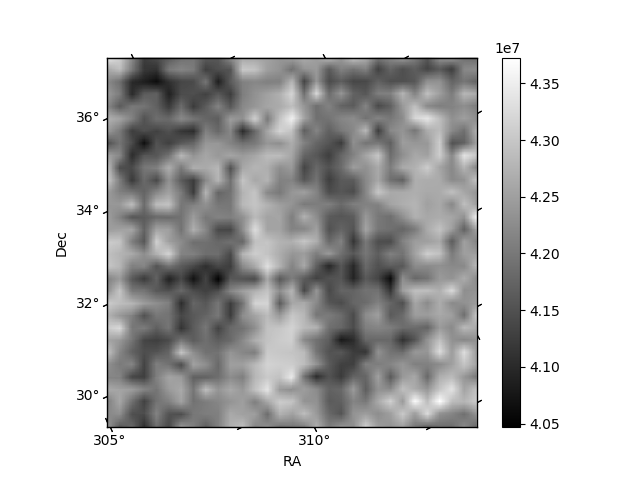
Histogram calculated using DETX and DETY for each event in the final _common_clean file
| Quadrant A |  |
 |
Quadrant B |
|---|---|---|---|
| Quadrant D |  |
 |
Quadrant C |
| Plot type | Count rate plots | Images |
|---|---|---|
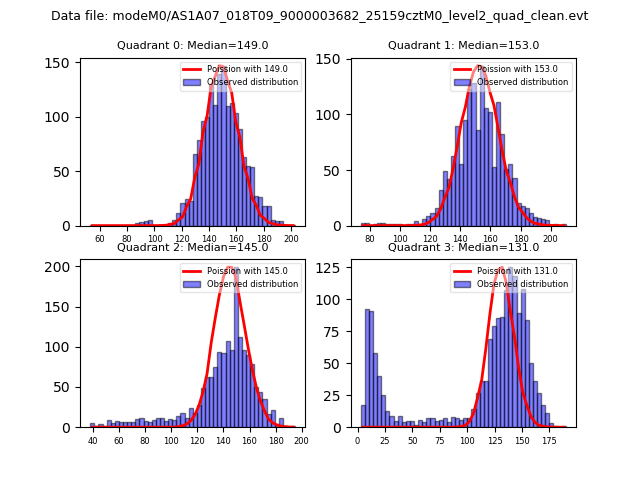
| Comparison with Poisson distribution Blue bars denote a histogram of data divided into 1 sec bins. Red curve is a Poisson curve with rate = median count rate of data. |
 |
 |
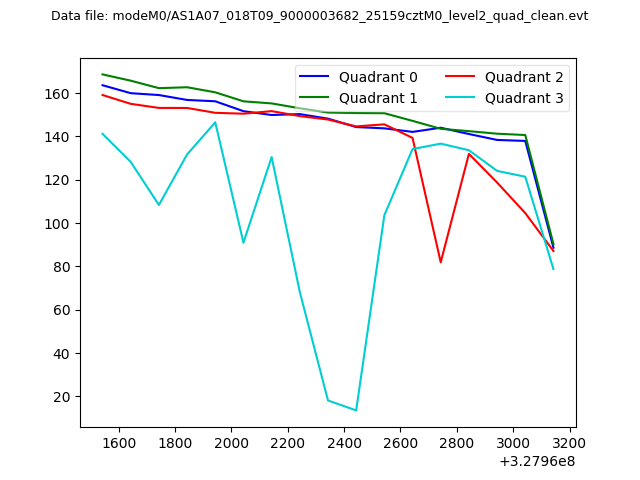
| Quadrant-wise count rates Data is divided into 100 sec bins |
 |
|
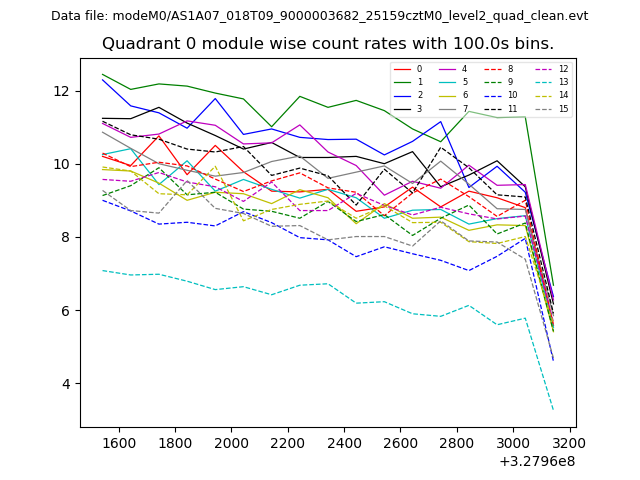
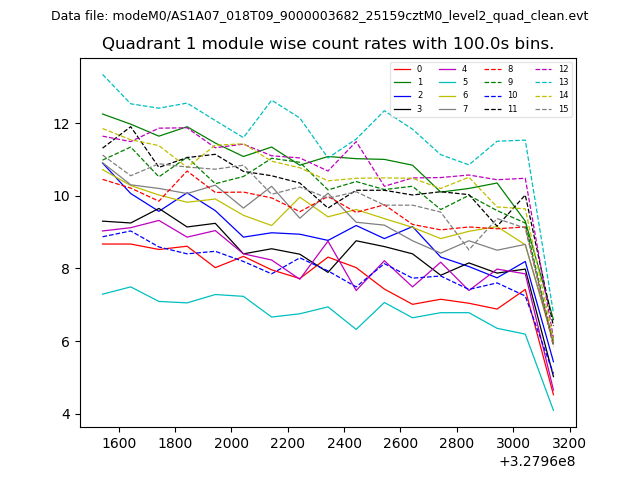
| Module-wise count rates for Quadrant A Data is divided into 100 sec bins |
 |
 |
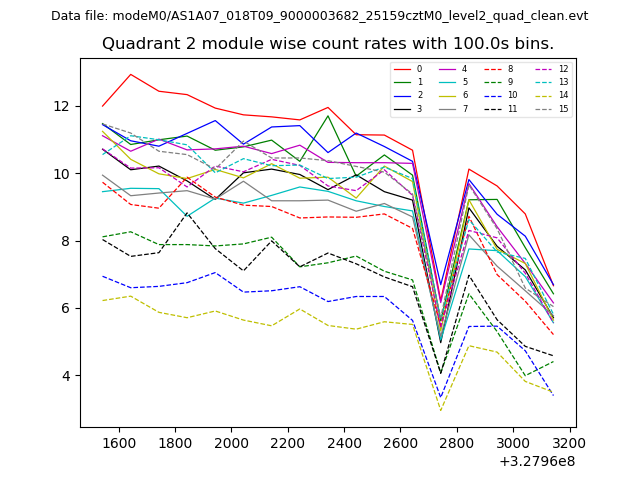
| Module-wise count rates for Quadrant B Data is divided into 100 sec bins |
 |
 |
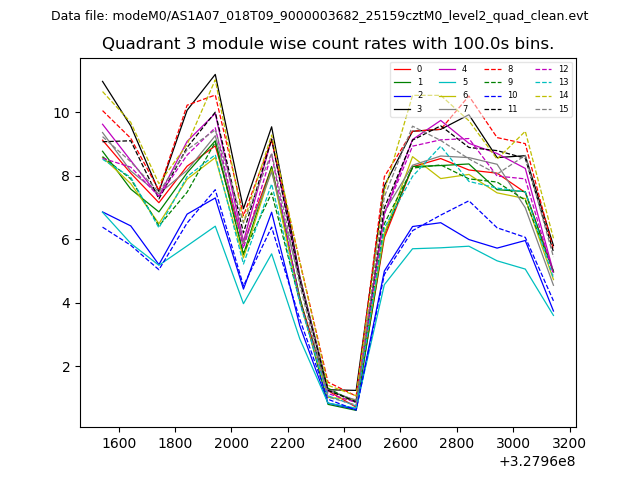
| Module-wise count rates for Quadrant C Data is divided into 100 sec bins |
 |
 |
| Module-wise count rates for Quadrant D Data is divided into 100 sec bins |
 |
 |
| Parameter | Plot |
|---|---|
| CZT HV Monitor | 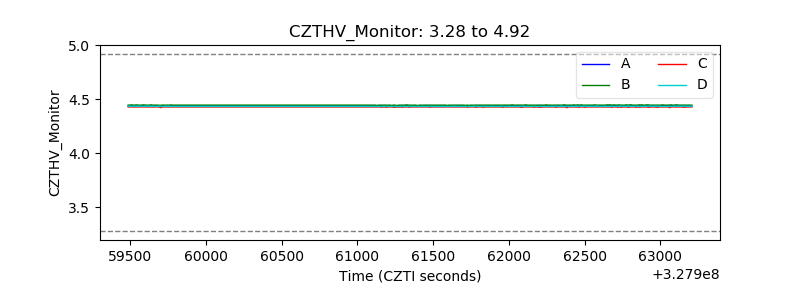 |
| D_VDD | 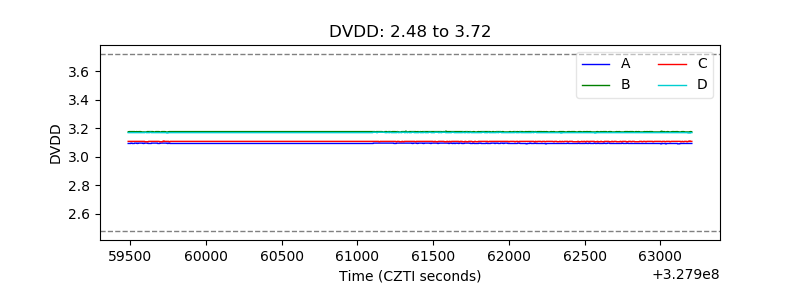 |
| Temperature 1 | 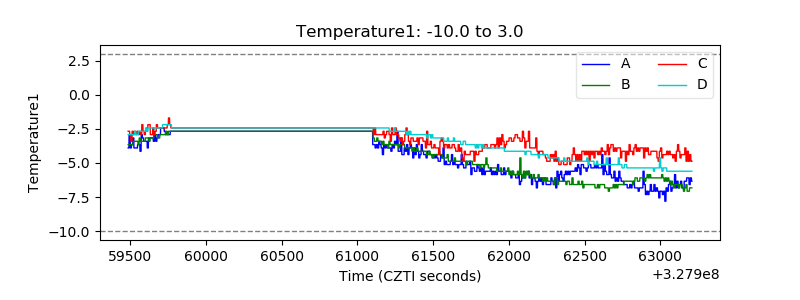 |
| Veto HV Monitor | 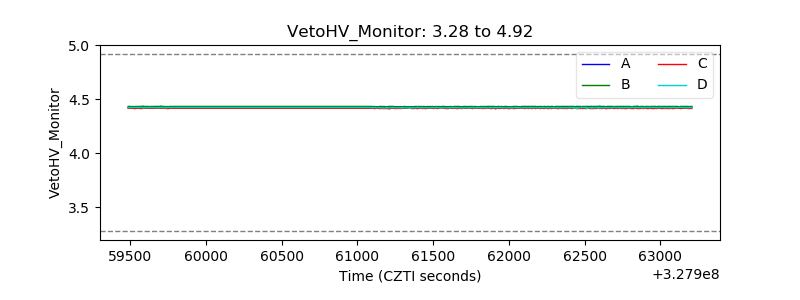 |
| Veto LLD | 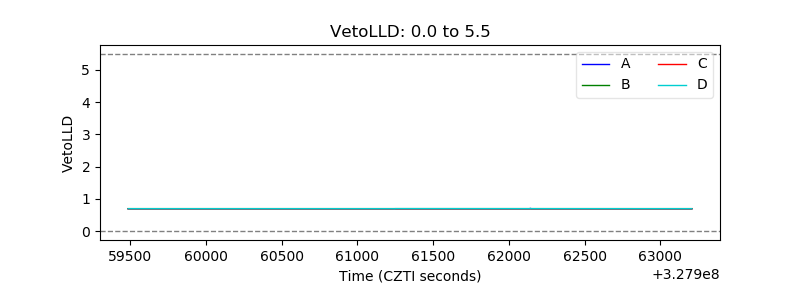 |
| Alpha Counter | 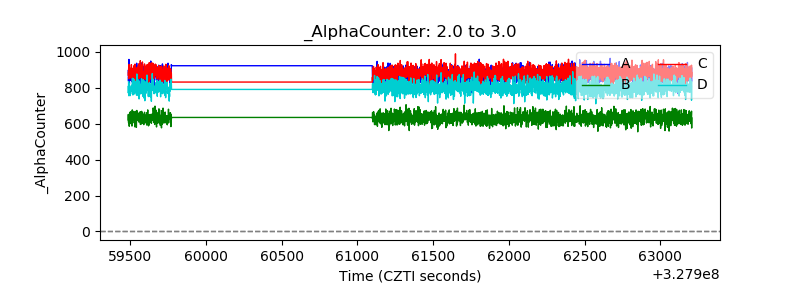 |
| _CPM_Rate | 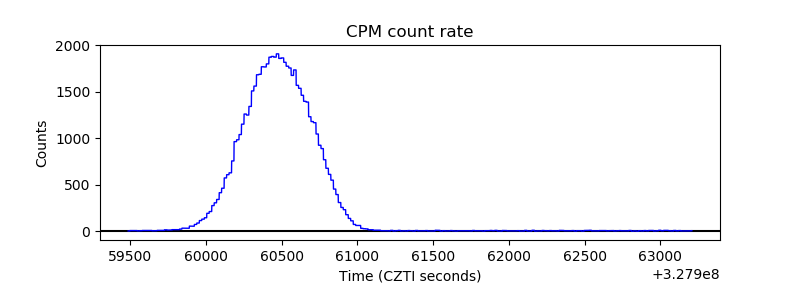 |
| CZT Counter | 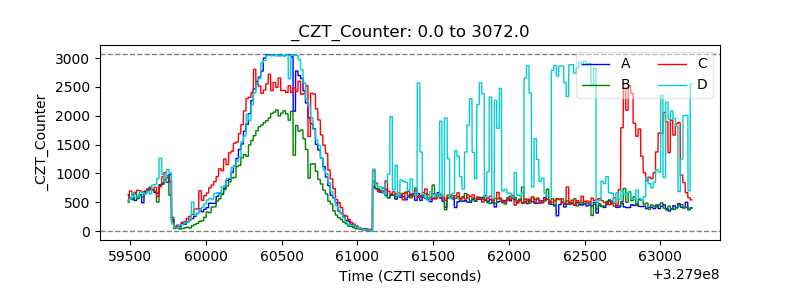 |
| +2.5 Volts monitor |  |
| +5 Volts monitor |  |
| _ROLL_ROT | 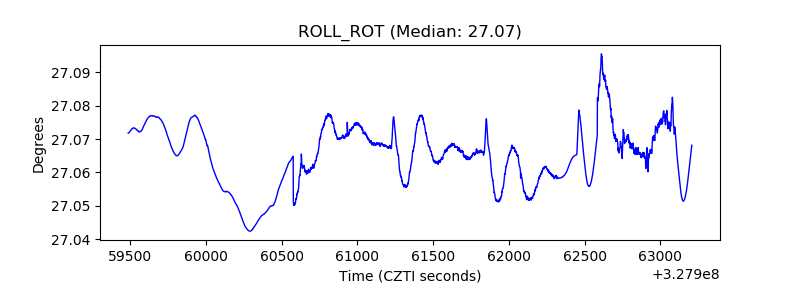 |
| _Roll_DEC | 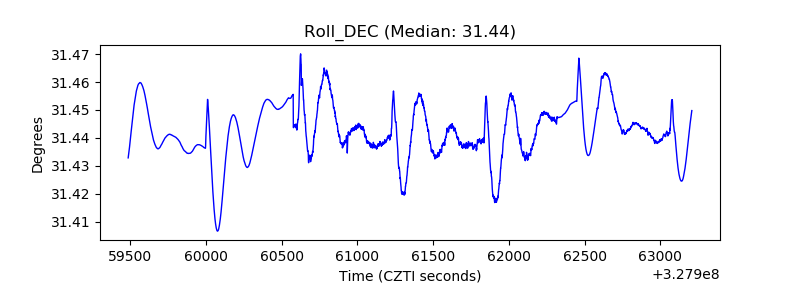 |
| _Roll_RA | 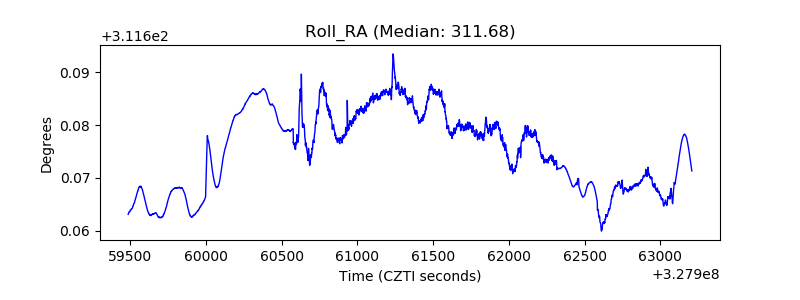 |
| Veto Counter | 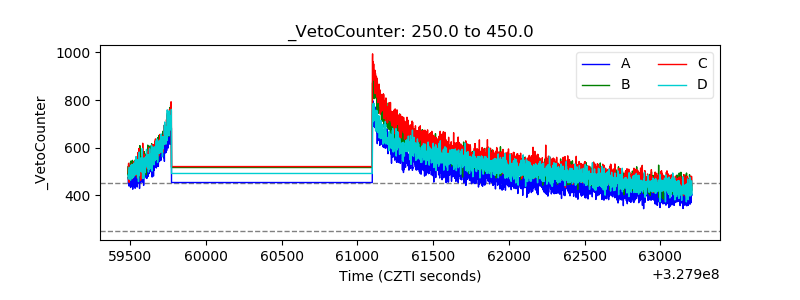 |