| Param | Original file | Final file |
|---|---|---|
| Filename | modeM0/AS1A07_171T02_9000003686cztM0_level2.fits | modeM0/AS1A07_171T02_9000003686cztM0_level2_quad_clean.evt |
| Size (bytes) | 392,973,120 | 439,496,640 |
| Size | 374.8 MB | 419.1 MB |
| Events in quadrant A | 2,421,614 | 2,763,628 |
| Events in quadrant B | 2,245,918 | 2,670,812 |
| Events in quadrant C | 2,348,154 | 2,621,858 |
| Events in quadrant D | 2,057,476 | 2,427,461 |
| Mode SS | |||
|---|---|---|---|
| Quadrant | BADHDUFLAG | Total packets | Discarded packets |
| A | 0 | 772 | 0 |
| B | 0 | 766 | 0 |
| C | 0 | 774 | 0 |
| D | 0 | 774 | 0 |
| Mode M0 | |||
|---|---|---|---|
| Quadrant | BADHDUFLAG | Total packets | Discarded packets |
| A | 0 | 84381 | 0 |
| B | 0 | 104467 | 0 |
| C | 0 | 88935 | 0 |
| D | 0 | 93918 | 0 |
| Mode M9 | |||
|---|---|---|---|
| Quadrant | BADHDUFLAG | Total packets | Discarded packets |
| A | 0 | 42 | 0 |
| B | 0 | 42 | 0 |
| C | 0 | 42 | 0 |
| D | 0 | 42 | 0 |
| Quadrant | Total seconds | Saturated seconds | Saturation percentage |
|---|---|---|---|
| A | 41400 | 302 | 0.729469% |
| B | 41417 | 2498 | 6.031340% |
| C | 41400 | 807 | 1.949275% |
| D | 41407 | 470 | 1.135074% |
Noise dominated data is calculated using 1-second bins in cleaned event files. If a bin has >2000 counts, and if more than 50% of those come from <1% of pixels, then it is considered to be noise-dominated and hence unusable.
| Quadrant | # 1 sec bins | Bins with >0 counts | Bins with >2000 counts | High rate bins dominated by noise | Noise dominated (total time) | Noise dominated (detector-on time) | Marked lightcurve |
|---|---|---|---|---|---|---|---|
| A | 45724 | 41397 | 0 | 0 | 0.00% | 0.00% | 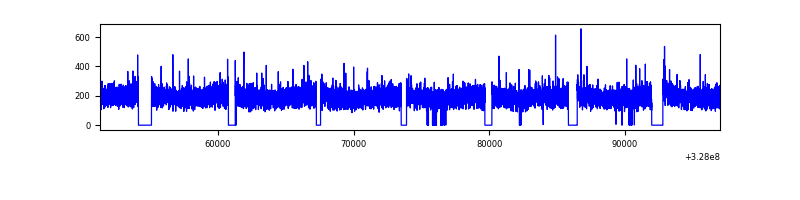 |
| B | 45724 | 41379 | 0 | 0 | 0.00% | 0.00% |  |
| C | 45724 | 41397 | 0 | 0 | 0.00% | 0.00% |  |
| D | 45724 | 41402 | 0 | 0 | 0.00% | 0.00% | 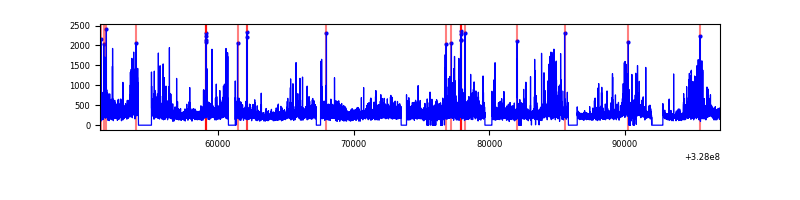 |
Top three noisy pixels from each quadrant. If the there are fewer than three noisy pixels in the level2.evt file, extra rows are filled as -1
| Pixel properties | Quadrant properties | ||||||
|---|---|---|---|---|---|---|---|
| Quadrant | DetID | PixID | Counts | Sigma | Mean | Median | Sigma |
| A | 0 | 29 | 2276 | 10.65 | 629 | 590 | 158.3 |
| A | 7 | 110 | 1908 | 8.32 | 629 | 590 | 158.3 |
| A | 9 | 19 | 1825 | 7.8 | 629 | 590 | 158.3 |
| B | 2 | 9 | 1837 | 10.87 | 594 | 569 | 116.6 |
| B | 2 | 8 | 1545 | 8.37 | 594 | 569 | 116.6 |
| B | 5 | 128 | 1468 | 7.71 | 594 | 569 | 116.6 |
| C | 1 | 81 | 1881 | 8.21 | 620 | 580 | 158.4 |
| C | 1 | 80 | 1834 | 7.91 | 620 | 580 | 158.4 |
| C | 12 | 241 | 1692 | 7.02 | 620 | 580 | 158.4 |
| D | 3 | 14 | 1548 | 6.48 | 587 | 536 | 156.2 |
| D | 7 | 3 | 1480 | 6.05 | 587 | 536 | 156.2 |
| D | 15 | 46 | 1462 | 5.93 | 587 | 536 | 156.2 |
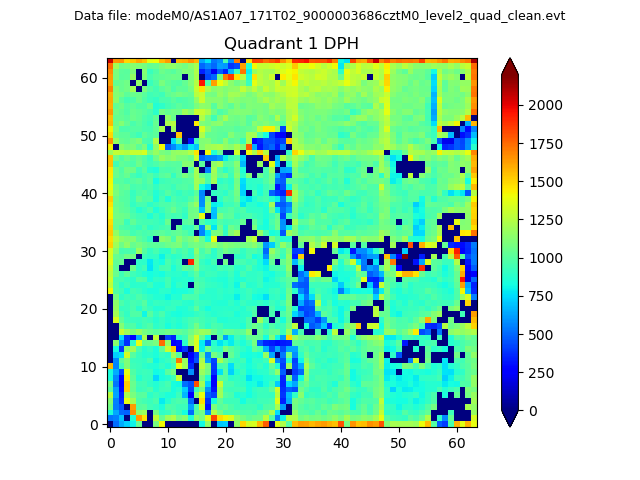
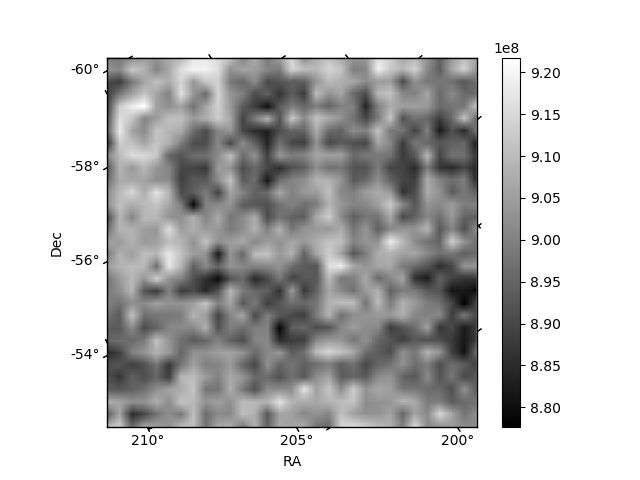
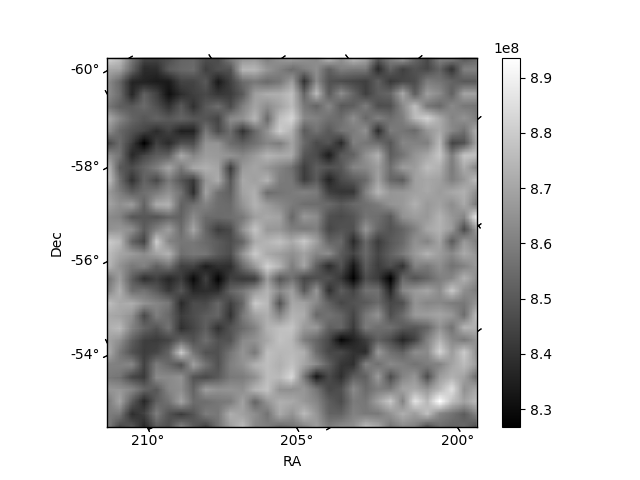
Histogram calculated using DETX and DETY for each event in the final _common_clean file
| Quadrant A |  |
 |
Quadrant B |
|---|---|---|---|
| Quadrant D |  |
 |
Quadrant C |
| Plot type | Count rate plots | Images |
|---|---|---|
| Comparison with Poisson distribution Blue bars denote a histogram of data divided into 1 sec bins. Red curve is a Poisson curve with rate = median count rate of data. |
 |
 |
| Quadrant-wise count rates Data is divided into 100 sec bins |
 |
|
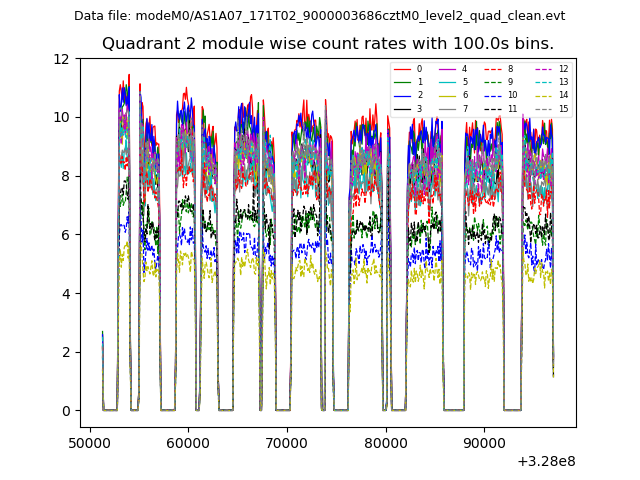
| Module-wise count rates for Quadrant A Data is divided into 100 sec bins |
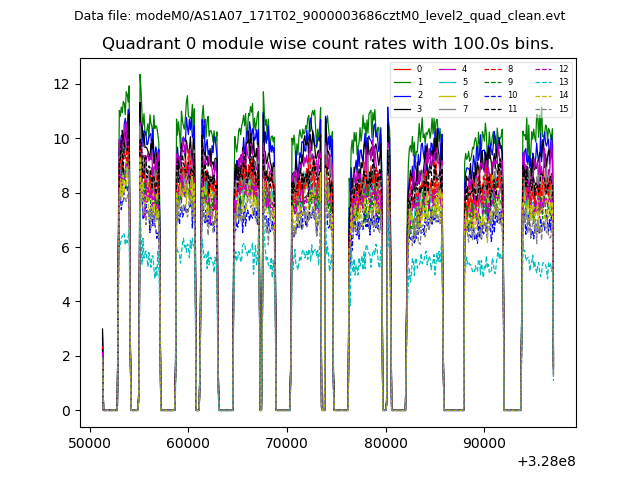 |
 |
| Module-wise count rates for Quadrant B Data is divided into 100 sec bins |
 |
 |
| Module-wise count rates for Quadrant C Data is divided into 100 sec bins |
 |
 |
| Module-wise count rates for Quadrant D Data is divided into 100 sec bins |
 |
 |
| Parameter | Plot |
|---|---|
| CZT HV Monitor |  |
| D_VDD |  |
| Temperature 1 |  |
| Veto HV Monitor |  |
| Veto LLD |  |
| Alpha Counter |  |
| _CPM_Rate | 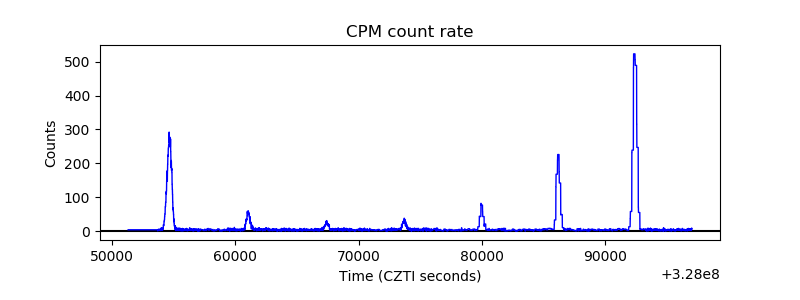 |
| CZT Counter |  |
| +2.5 Volts monitor | 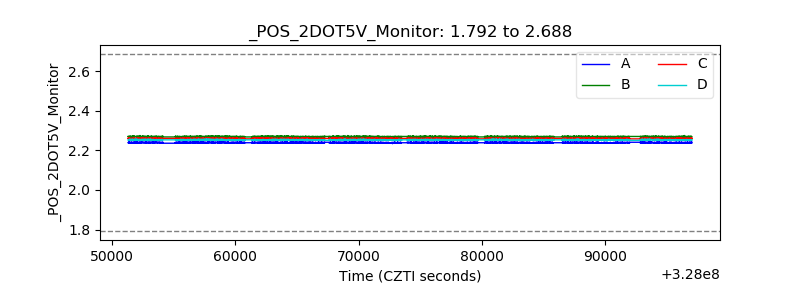 |
| +5 Volts monitor |  |
| _ROLL_ROT | 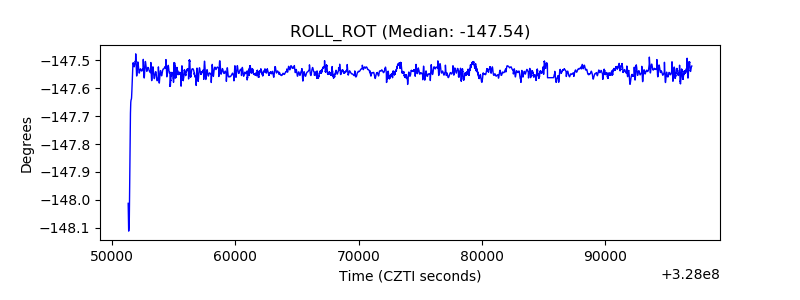 |
| _Roll_DEC | 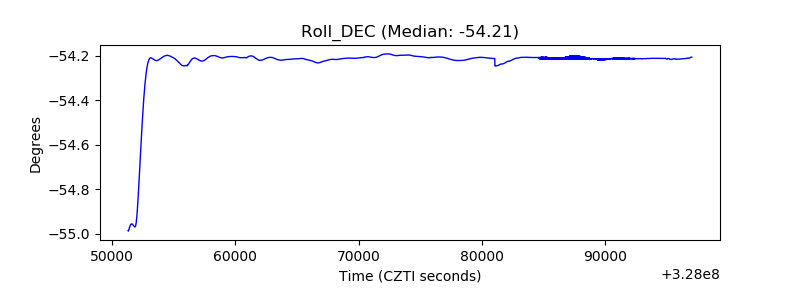 |
| _Roll_RA |  |
| Veto Counter |  |