| Param | Original file | Final file |
|---|---|---|
| Filename | modeM0/AS1A07_171T02_9000003686_25174cztM0_level2.evt | modeM0/AS1A07_171T02_9000003686_25174cztM0_level2_quad_clean.evt |
| Size (bytes) | 317,200,320 | 57,070,080 |
| Size | 302.5 MB | 54.4 MB |
| Events in quadrant A | 2,029,308 | 363,365 |
| Events in quadrant B | 2,242,582 | 370,956 |
| Events in quadrant C | 2,422,805 | 352,426 |
| Events in quadrant D | 2,623,550 | 343,545 |
| Mode M0 | |||
|---|---|---|---|
| Quadrant | BADHDUFLAG | Total packets | Discarded packets |
| A | 0 | 8710 | 0 |
| B | 0 | 9322 | 0 |
| C | 0 | 9750 | 0 |
| D | 0 | 10623 | 0 |
| Mode M9 | |||
|---|---|---|---|
| Quadrant | BADHDUFLAG | Total packets | Discarded packets |
| A | 0 | 10 | 0 |
| B | 0 | 10 | 0 |
| C | 0 | 10 | 0 |
| D | 0 | 10 | 0 |
| Quadrant | Total seconds | Saturated seconds | Saturation percentage |
|---|---|---|---|
| A | 4227 | 9 | 0.212917% |
| B | 4227 | 32 | 0.757038% |
| C | 4227 | 142 | 3.359357% |
| D | 4227 | 56 | 1.324817% |
Noise dominated data is calculated using 1-second bins in cleaned event files. If a bin has >2000 counts, and if more than 50% of those come from <1% of pixels, then it is considered to be noise-dominated and hence unusable.
| Quadrant | # 1 sec bins | Bins with >0 counts | Bins with >2000 counts | High rate bins dominated by noise | Noise dominated (total time) | Noise dominated (detector-on time) | Marked lightcurve |
|---|---|---|---|---|---|---|---|
| A | 5192 | 4227 | 0 | 0 | 0.00% | 0.00% | 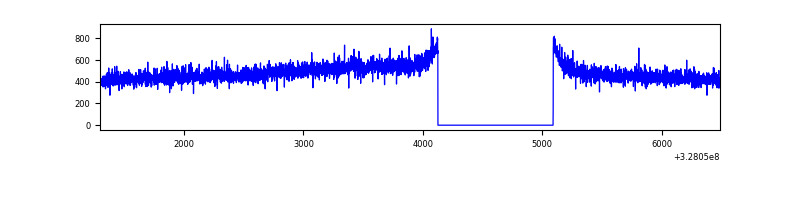 |
| B | 5192 | 4227 | 5 | 5 | 0.10% | 0.12% | 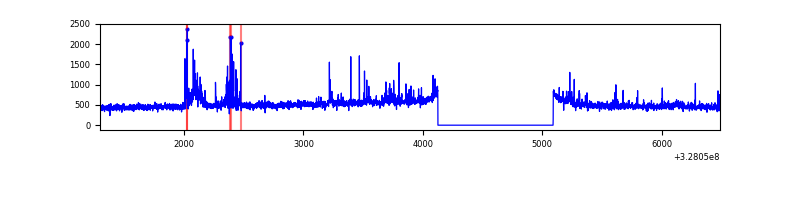 |
| C | 5192 | 4227 | 131 | 131 | 2.52% | 3.10% | 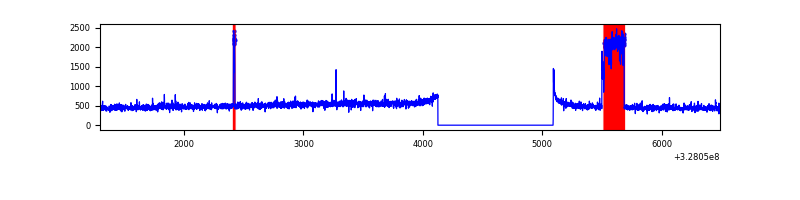 |
| D | 5192 | 4227 | 46 | 46 | 0.89% | 1.09% | 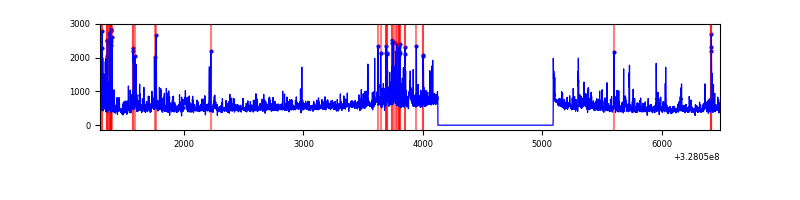 |
Top three noisy pixels from each quadrant. If the there are fewer than three noisy pixels in the level2.evt file, extra rows are filled as -1
| Pixel properties | Quadrant properties | ||||||
|---|---|---|---|---|---|---|---|
| Quadrant | DetID | PixID | Counts | Sigma | Mean | Median | Sigma |
| A | 13 | 254 | 6934 | 60.48 | 525 | 515 | 106.1 |
| A | 3 | 137 | 4788 | 40.26 | 525 | 515 | 106.1 |
| A | 0 | 226 | 4485 | 37.4 | 525 | 515 | 106.1 |
| B | 3 | 64 | 139630 | 1387.94 | 526 | 513 | 100.2 |
| B | 0 | 190 | 21959 | 213.96 | 526 | 513 | 100.2 |
| B | 12 | 111 | 12158 | 116.18 | 526 | 513 | 100.2 |
| C | 7 | 247 | 328513 | 2771.44 | 508 | 511 | 118.4 |
| C | 14 | 238 | 81608 | 685.23 | 508 | 511 | 118.4 |
| C | 7 | 220 | 15982 | 130.72 | 508 | 511 | 118.4 |
| D | 8 | 195 | 263404 | 1937.06 | 506 | 496 | 135.7 |
| D | 12 | 233 | 145027 | 1064.88 | 506 | 496 | 135.7 |
| D | 1 | 52 | 144150 | 1058.42 | 506 | 496 | 135.7 |
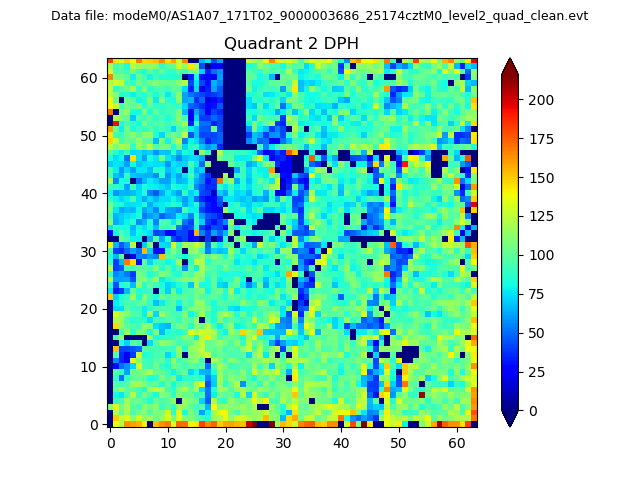
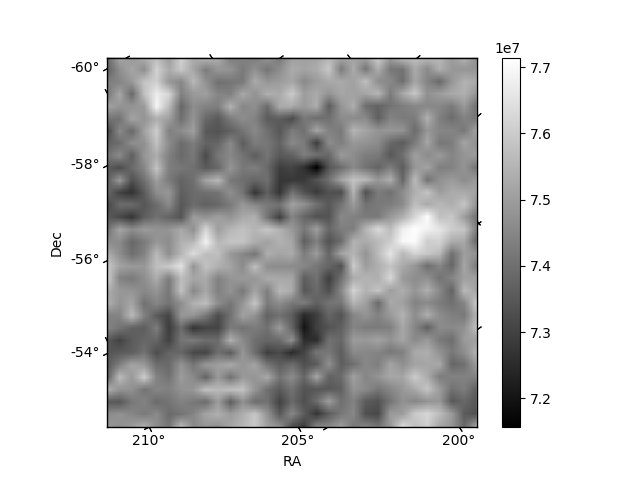
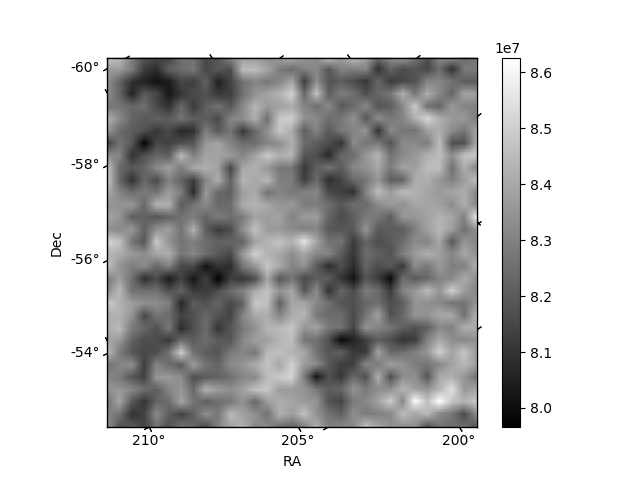
Histogram calculated using DETX and DETY for each event in the final _common_clean file
| Quadrant A | 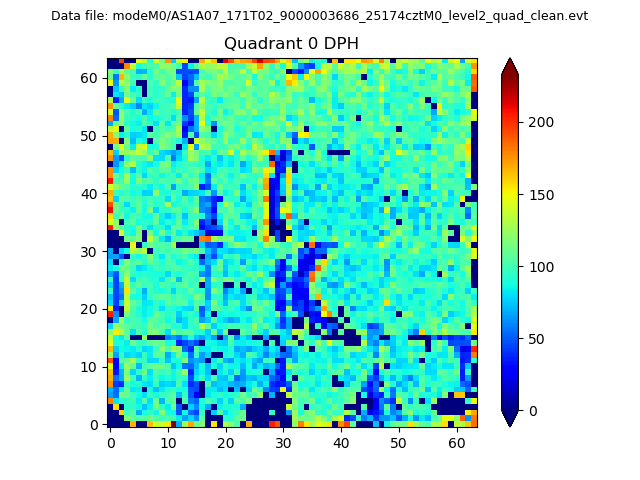 |
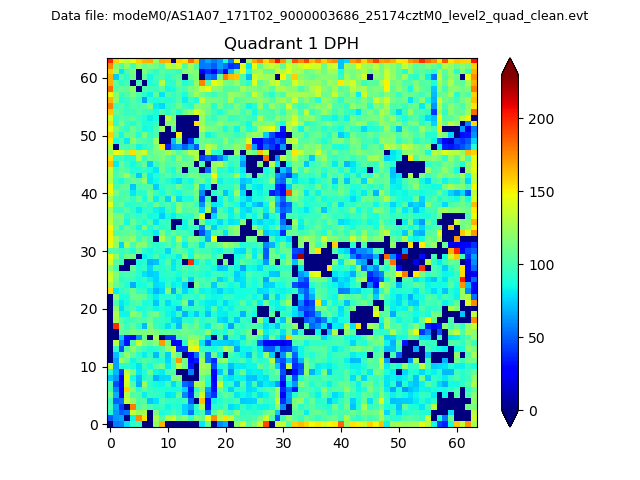 |
Quadrant B |
|---|---|---|---|
| Quadrant D | 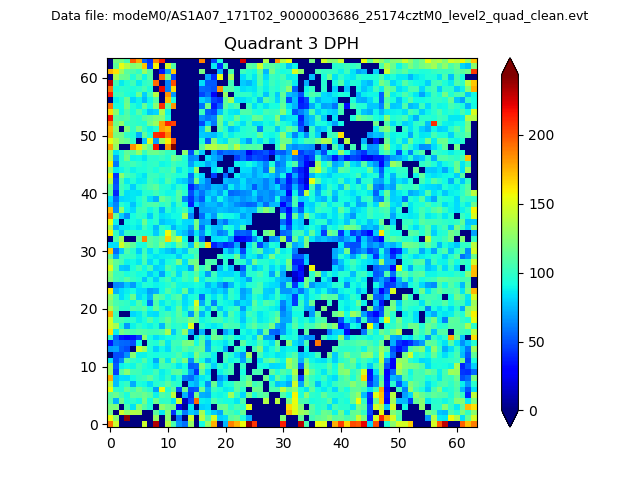 |
 |
Quadrant C |
| Plot type | Count rate plots | Images |
|---|---|---|
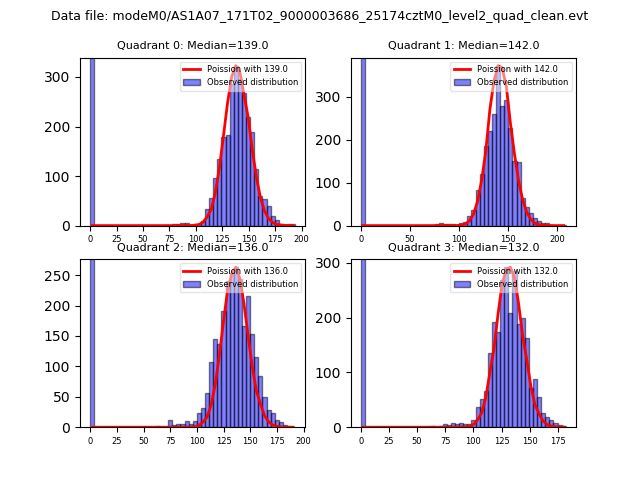
| Comparison with Poisson distribution Blue bars denote a histogram of data divided into 1 sec bins. Red curve is a Poisson curve with rate = median count rate of data. |
 |
 |
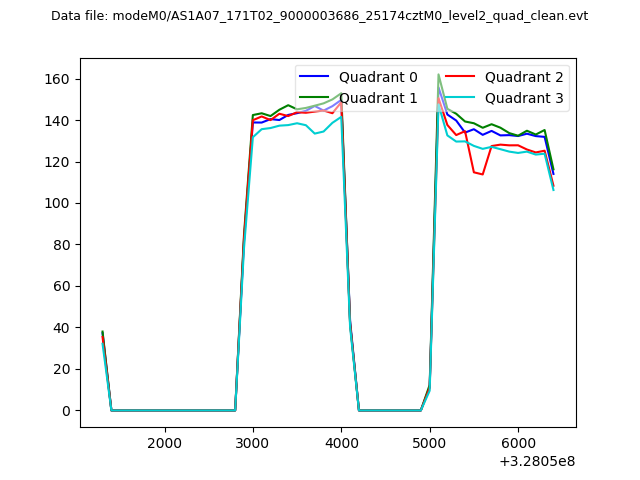
| Quadrant-wise count rates Data is divided into 100 sec bins |
 |
|
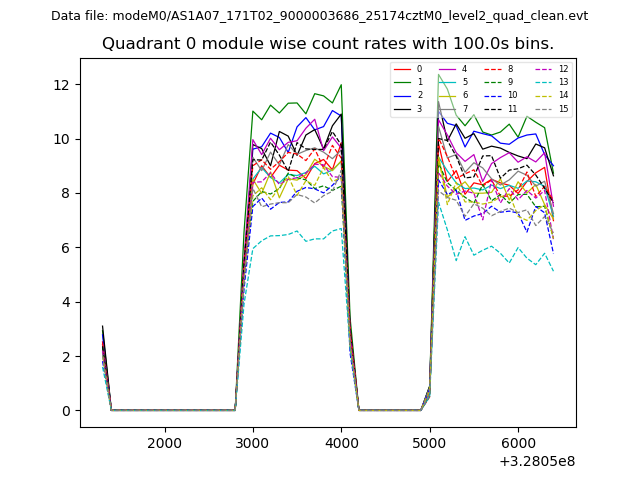
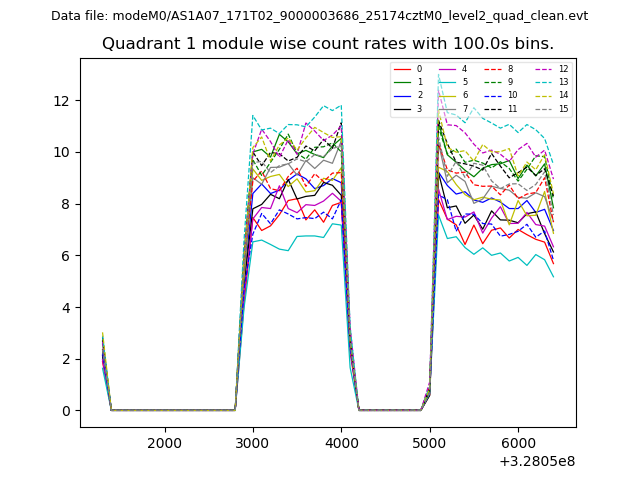
| Module-wise count rates for Quadrant A Data is divided into 100 sec bins |
 |
 |
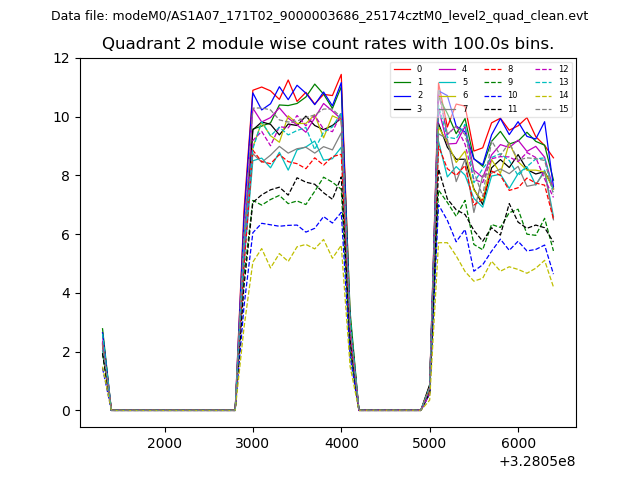
| Module-wise count rates for Quadrant B Data is divided into 100 sec bins |
 |
 |
| Module-wise count rates for Quadrant C Data is divided into 100 sec bins |
 |
 |
| Module-wise count rates for Quadrant D Data is divided into 100 sec bins |
 |
 |
| Parameter | Plot |
|---|---|
| CZT HV Monitor |  |
| D_VDD | 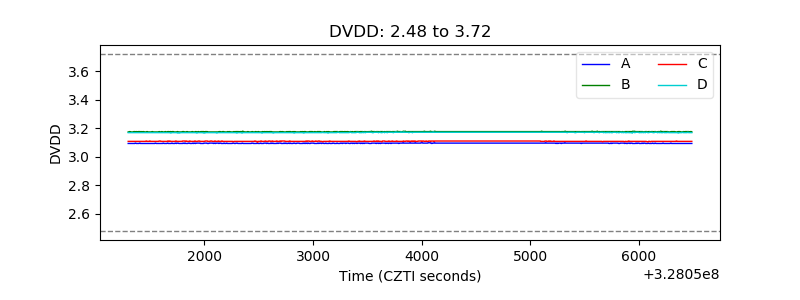 |
| Temperature 1 | 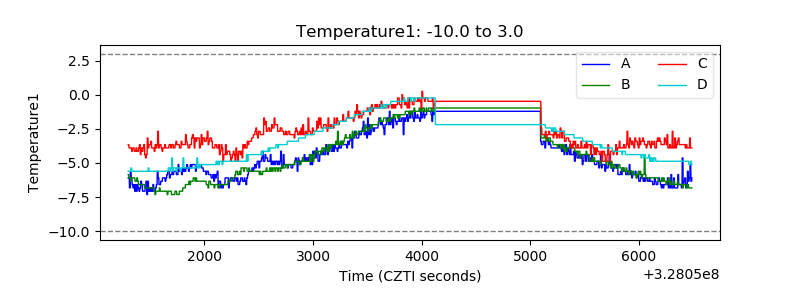 |
| Veto HV Monitor |  |
| Veto LLD | 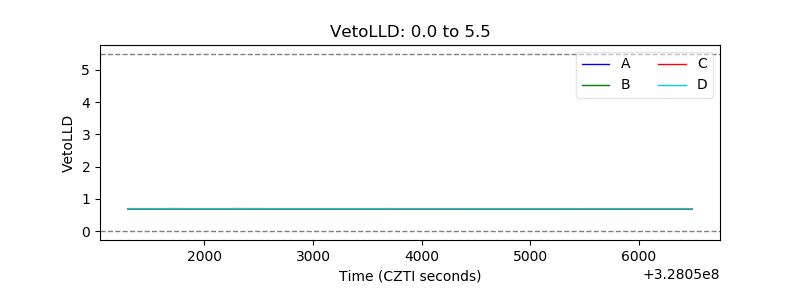 |
| Alpha Counter | 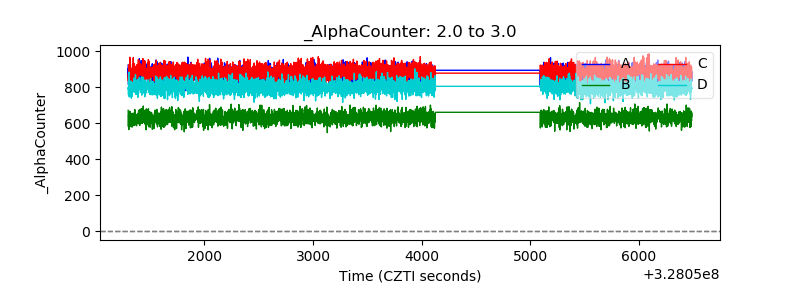 |
| _CPM_Rate | 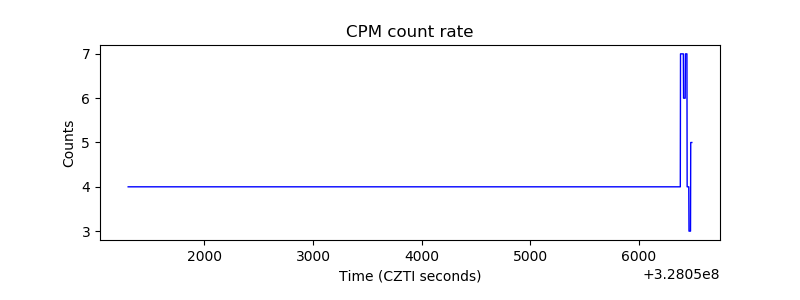 |
| CZT Counter | 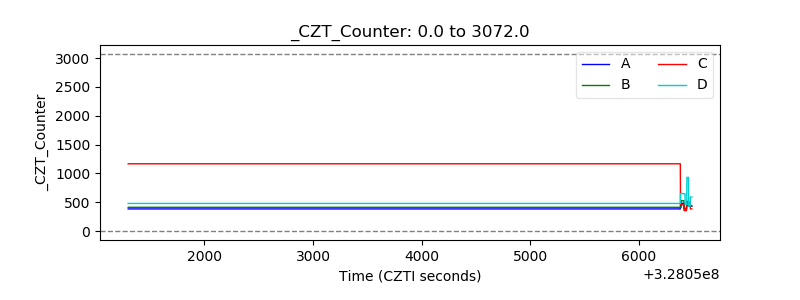 |
| +2.5 Volts monitor |  |
| +5 Volts monitor |  |
| _ROLL_ROT | 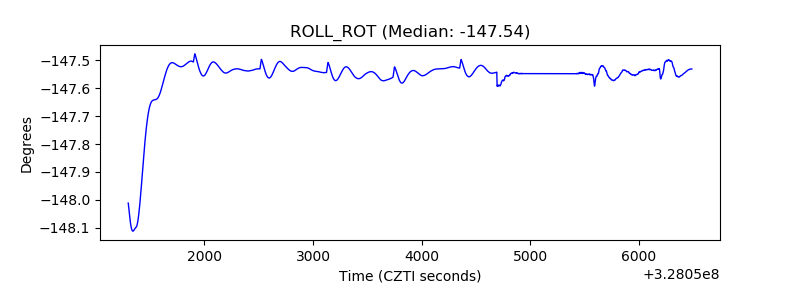 |
| _Roll_DEC | 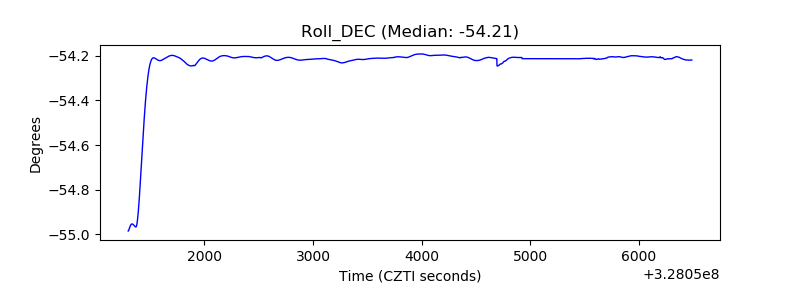 |
| _Roll_RA | 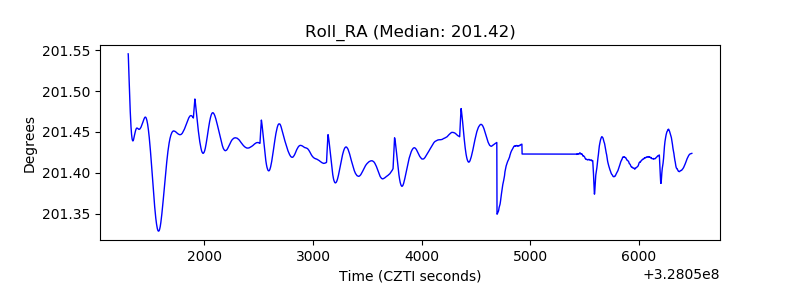 |
| Veto Counter | 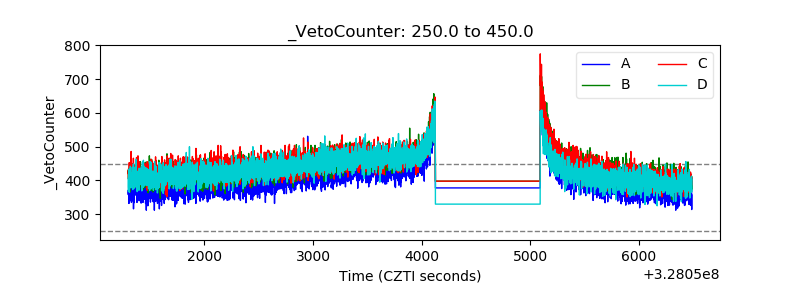 |