| Param | Original file | Final file |
|---|---|---|
| Filename | modeM0/AS1A07_171T02_9000003686_25175cztM0_level2.evt | modeM0/AS1A07_171T02_9000003686_25175cztM0_level2_quad_clean.evt |
| Size (bytes) | 518,800,320 | 109,926,720 |
| Size | 494.8 MB | 104.8 MB |
| Events in quadrant A | 3,267,540 | 727,200 |
| Events in quadrant B | 4,407,655 | 726,956 |
| Events in quadrant C | 3,796,195 | 696,745 |
| Events in quadrant D | 3,762,388 | 687,745 |
| Mode M0 | |||
|---|---|---|---|
| Quadrant | BADHDUFLAG | Total packets | Discarded packets |
| A | 0 | 14370 | 0 |
| B | 0 | 17698 | 0 |
| C | 0 | 15712 | 0 |
| D | 0 | 15802 | 0 |
| Mode M9 | |||
|---|---|---|---|
| Quadrant | BADHDUFLAG | Total packets | Discarded packets |
| A | 0 | 13 | 0 |
| B | 0 | 14 | 0 |
| C | 0 | 14 | 0 |
| D | 0 | 14 | 0 |
| Quadrant | Total seconds | Saturated seconds | Saturation percentage |
|---|---|---|---|
| A | 7044 | 42 | 0.596252% |
| B | 7044 | 334 | 4.741624% |
| C | 7043 | 199 | 2.825500% |
| D | 7043 | 69 | 0.979696% |
Noise dominated data is calculated using 1-second bins in cleaned event files. If a bin has >2000 counts, and if more than 50% of those come from <1% of pixels, then it is considered to be noise-dominated and hence unusable.
| Quadrant | # 1 sec bins | Bins with >0 counts | Bins with >2000 counts | High rate bins dominated by noise | Noise dominated (total time) | Noise dominated (detector-on time) | Marked lightcurve |
|---|---|---|---|---|---|---|---|
| A | 7589 | 7045 | 0 | 0 | 0.00% | 0.00% | 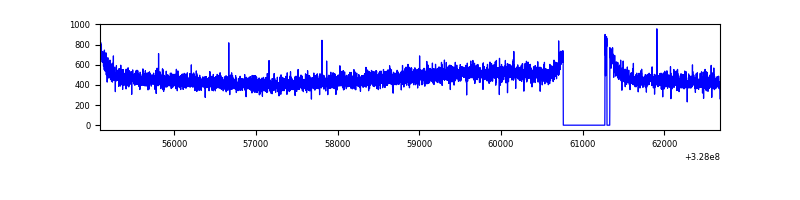 |
| B | 7589 | 7046 | 187 | 187 | 2.46% | 2.65% | 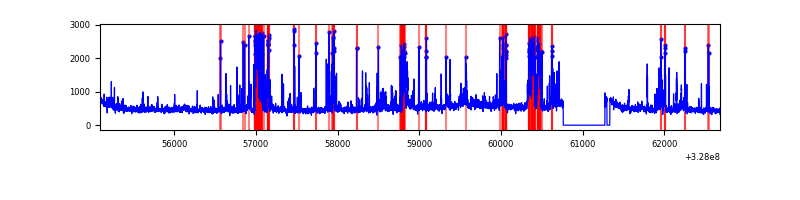 |
| C | 7588 | 7043 | 122 | 122 | 1.61% | 1.73% | 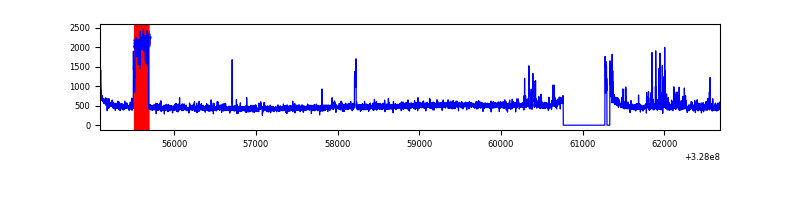 |
| D | 7588 | 7044 | 27 | 27 | 0.36% | 0.38% | 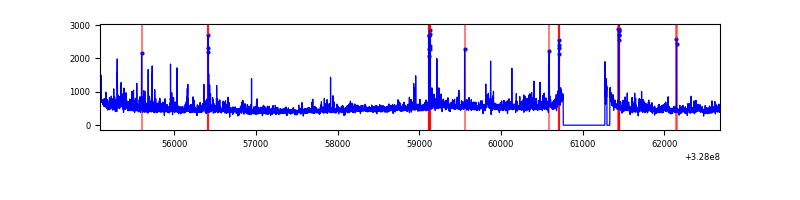 |
Top three noisy pixels from each quadrant. If the there are fewer than three noisy pixels in the level2.evt file, extra rows are filled as -1
| Pixel properties | Quadrant properties | ||||||
|---|---|---|---|---|---|---|---|
| Quadrant | DetID | PixID | Counts | Sigma | Mean | Median | Sigma |
| A | 13 | 254 | 12506 | 68.73 | 847 | 830 | 169.9 |
| A | 3 | 137 | 7811 | 41.09 | 847 | 830 | 169.9 |
| A | 0 | 226 | 7261 | 37.86 | 847 | 830 | 169.9 |
| B | 3 | 64 | 1052551 | 6584.05 | 836 | 815 | 159.7 |
| B | 0 | 189 | 43297 | 265.94 | 836 | 815 | 159.7 |
| B | 12 | 111 | 19080 | 114.34 | 836 | 815 | 159.7 |
| C | 7 | 247 | 333788 | 1767.6 | 806 | 812 | 188.4 |
| C | 3 | 233 | 168760 | 891.55 | 806 | 812 | 188.4 |
| C | 14 | 238 | 129139 | 681.22 | 806 | 812 | 188.4 |
| D | 8 | 195 | 273723 | 1387.3 | 816 | 794 | 196.7 |
| D | 2 | 244 | 186478 | 943.83 | 816 | 794 | 196.7 |
| D | 12 | 233 | 52447 | 262.55 | 816 | 794 | 196.7 |
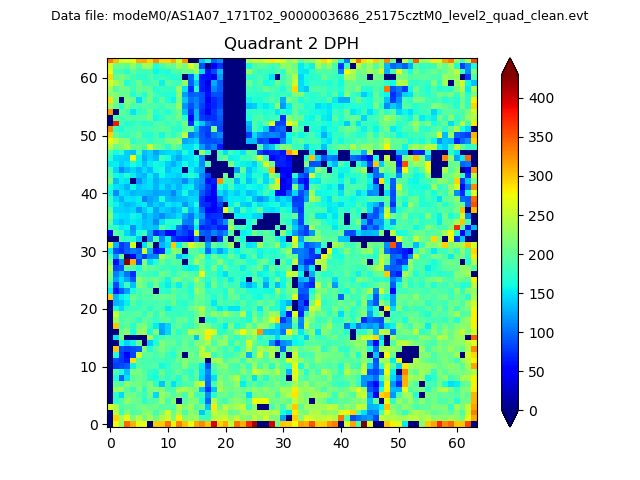
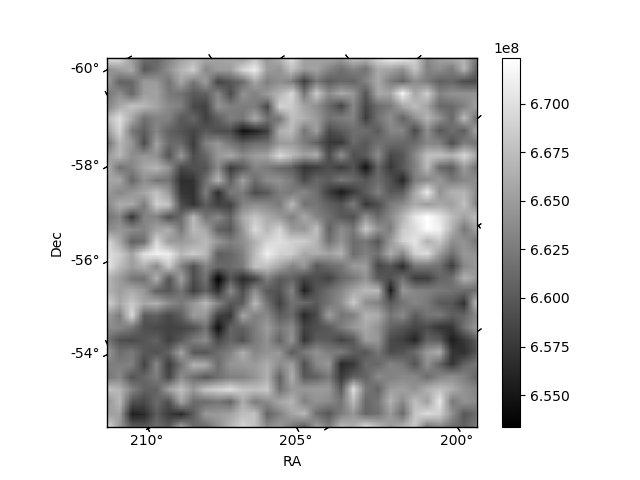
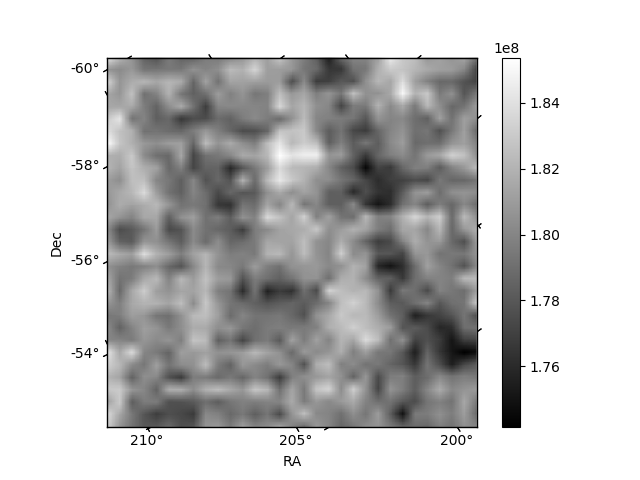
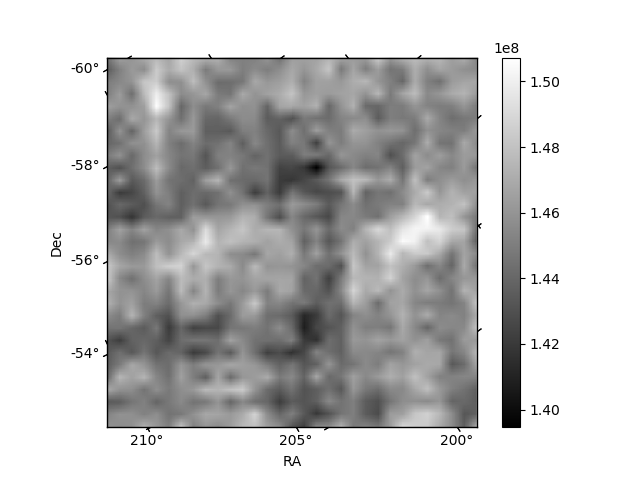
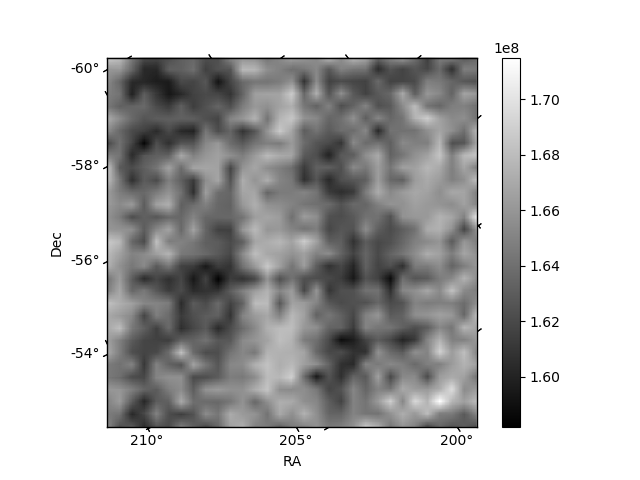
Histogram calculated using DETX and DETY for each event in the final _common_clean file
| Quadrant A | 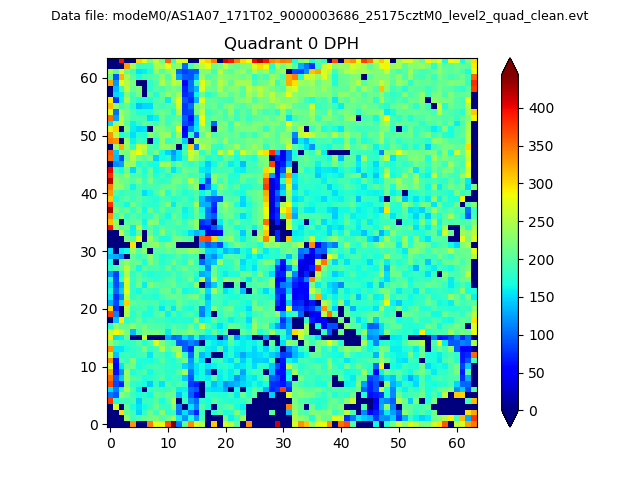 |
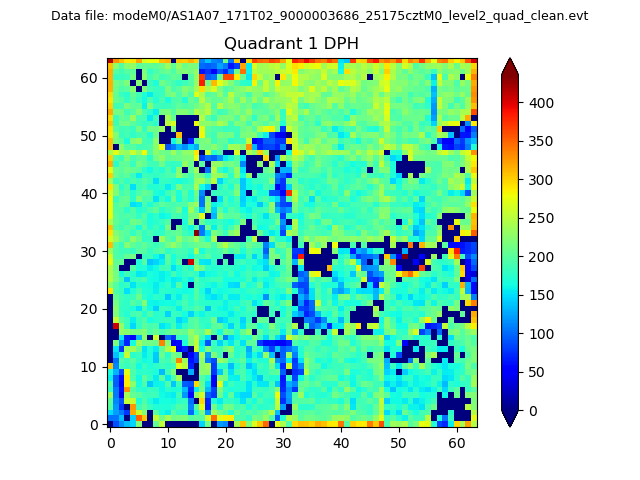 |
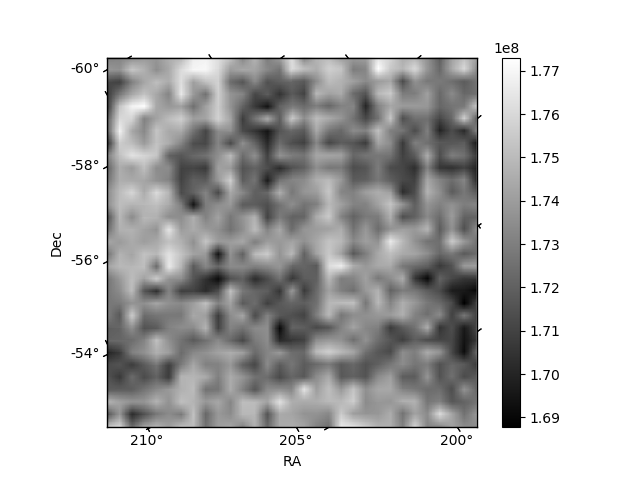
Quadrant B |
|---|---|---|---|
| Quadrant D | 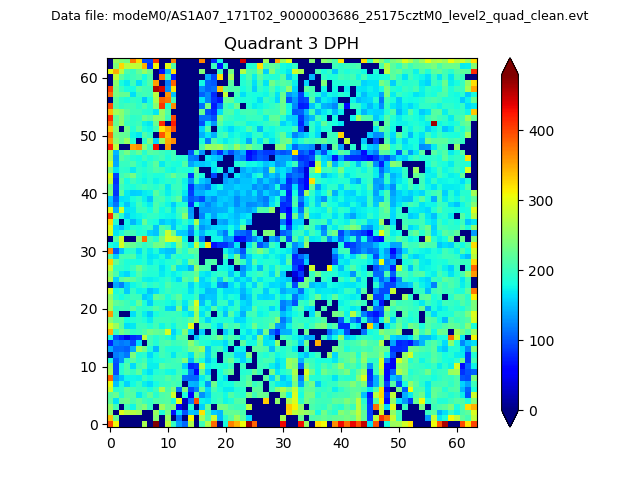 |
 |
Quadrant C |
| Plot type | Count rate plots | Images |
|---|---|---|
| Comparison with Poisson distribution Blue bars denote a histogram of data divided into 1 sec bins. Red curve is a Poisson curve with rate = median count rate of data. |
 |
 |
| Quadrant-wise count rates Data is divided into 100 sec bins |
 |
|
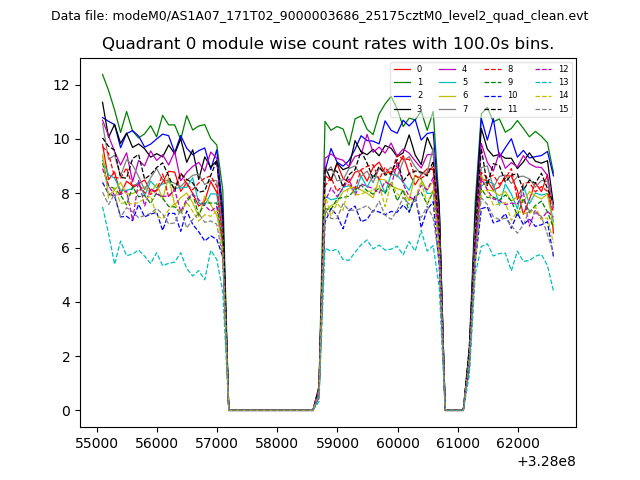
| Module-wise count rates for Quadrant A Data is divided into 100 sec bins |
 |
 |
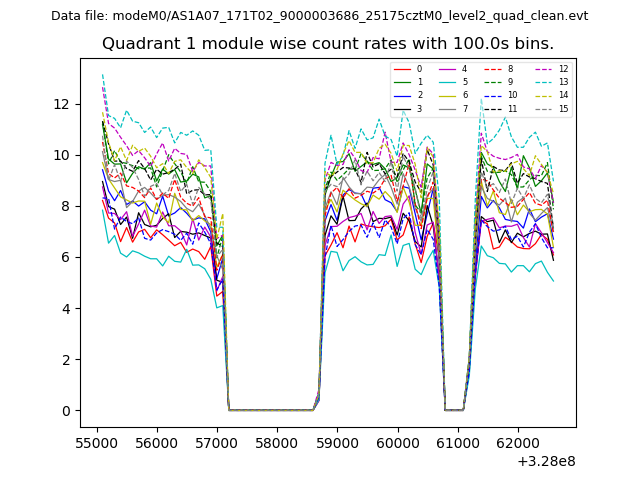
| Module-wise count rates for Quadrant B Data is divided into 100 sec bins |
 |
 |
| Module-wise count rates for Quadrant C Data is divided into 100 sec bins |
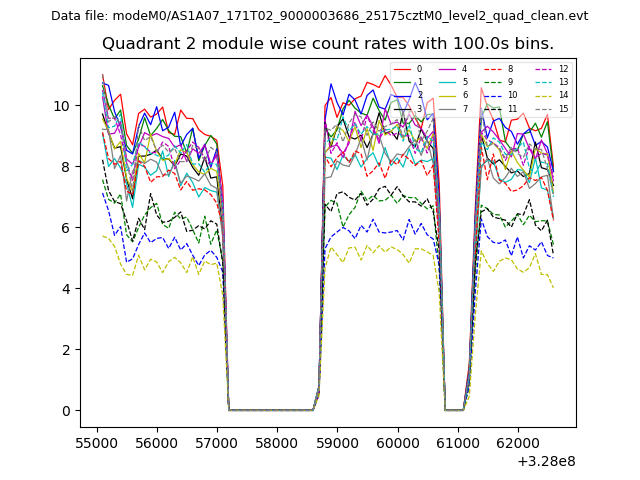 |
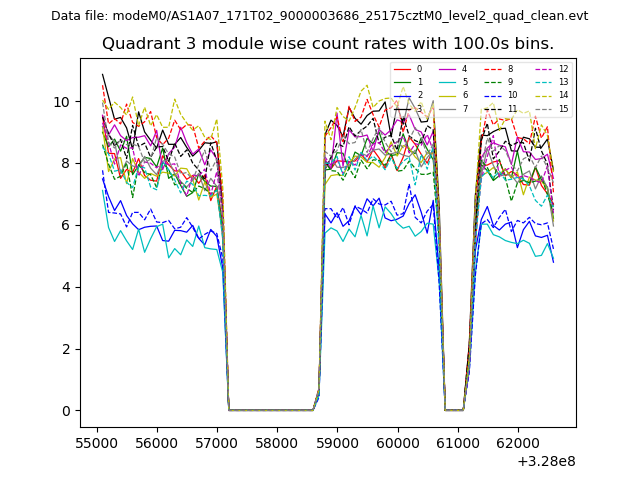
 |
| Module-wise count rates for Quadrant D Data is divided into 100 sec bins |
 |
 |
| Parameter | Plot |
|---|---|
| CZT HV Monitor |  |
| D_VDD | 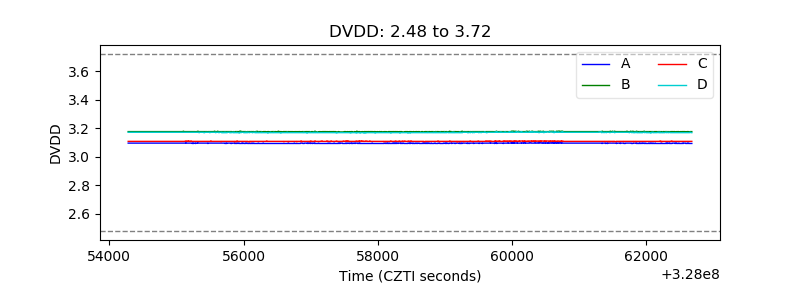 |
| Temperature 1 |  |
| Veto HV Monitor | 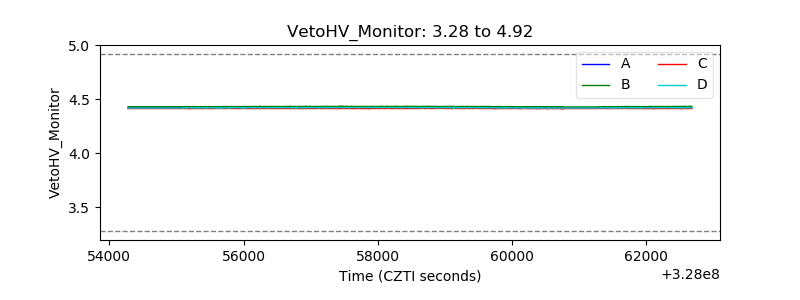 |
| Veto LLD | 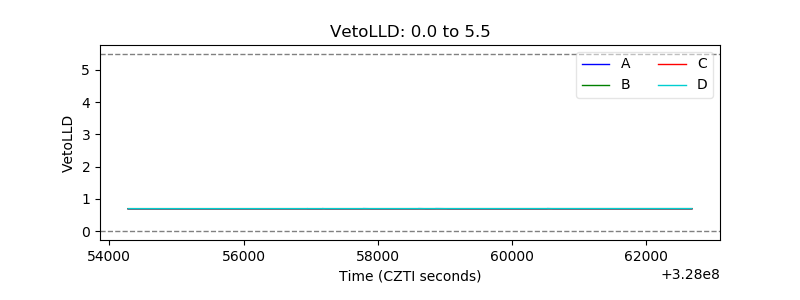 |
| Alpha Counter | 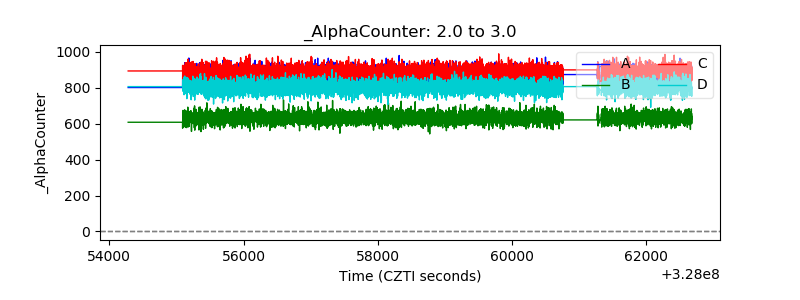 |
| _CPM_Rate | 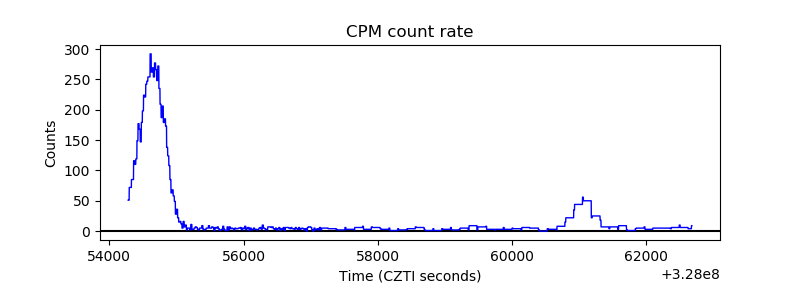 |
| CZT Counter | 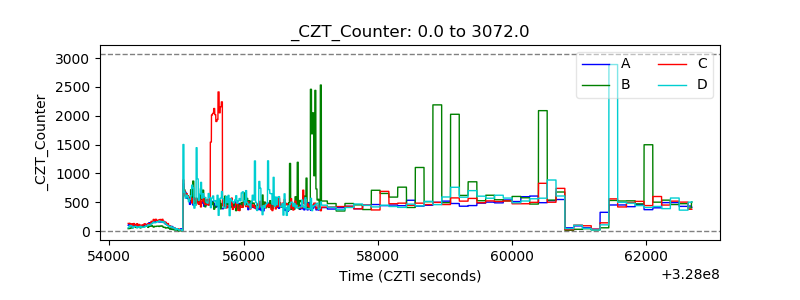 |
| +2.5 Volts monitor |  |
| +5 Volts monitor |  |
| _ROLL_ROT | 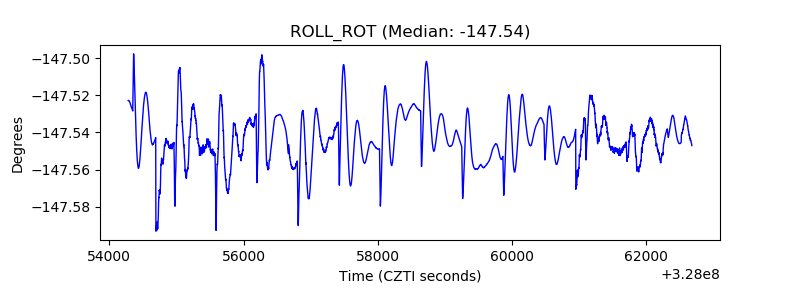 |
| _Roll_DEC | 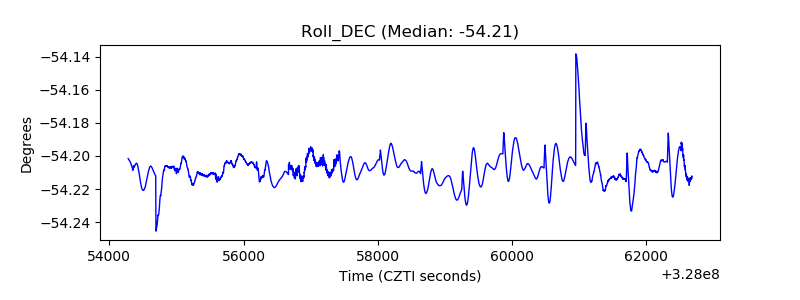 |
| _Roll_RA | 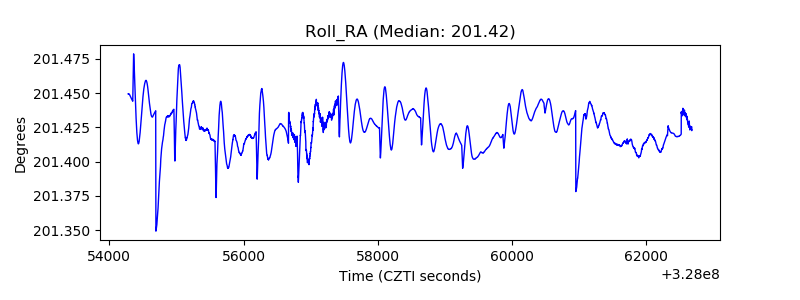 |
| Veto Counter | 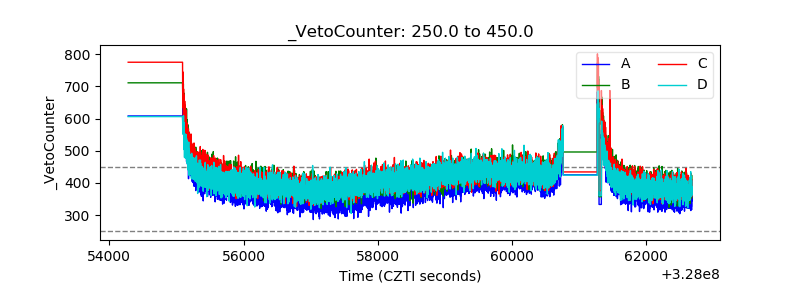 |