| Param | Original file | Final file |
|---|---|---|
| Filename | modeM0/AS1A07_171T02_9000003686_25176cztM0_level2.evt | modeM0/AS1A07_171T02_9000003686_25176cztM0_level2_quad_clean.evt |
| Size (bytes) | 626,754,240 | 126,478,080 |
| Size | 597.7 MB | 120.6 MB |
| Events in quadrant A | 3,881,646 | 837,570 |
| Events in quadrant B | 6,123,702 | 815,876 |
| Events in quadrant C | 4,136,214 | 804,814 |
| Events in quadrant D | 4,277,426 | 796,033 |
| Mode M0 | |||
|---|---|---|---|
| Quadrant | BADHDUFLAG | Total packets | Discarded packets |
| A | 0 | 17023 | 0 |
| B | 0 | 23622 | 0 |
| C | 0 | 17535 | 0 |
| D | 0 | 18128 | 0 |
| Mode M9 | |||
|---|---|---|---|
| Quadrant | BADHDUFLAG | Total packets | Discarded packets |
| A | 0 | 8 | 0 |
| B | 0 | 8 | 0 |
| C | 0 | 8 | 0 |
| D | 0 | 8 | 0 |
| Quadrant | Total seconds | Saturated seconds | Saturation percentage |
|---|---|---|---|
| A | 8284 | 93 | 1.122646% |
| B | 8284 | 703 | 8.486239% |
| C | 8284 | 177 | 2.136649% |
| D | 8284 | 99 | 1.195075% |
Noise dominated data is calculated using 1-second bins in cleaned event files. If a bin has >2000 counts, and if more than 50% of those come from <1% of pixels, then it is considered to be noise-dominated and hence unusable.
| Quadrant | # 1 sec bins | Bins with >0 counts | Bins with >2000 counts | High rate bins dominated by noise | Noise dominated (total time) | Noise dominated (detector-on time) | Marked lightcurve |
|---|---|---|---|---|---|---|---|
| A | 9138 | 8284 | 0 | 0 | 0.00% | 0.00% | 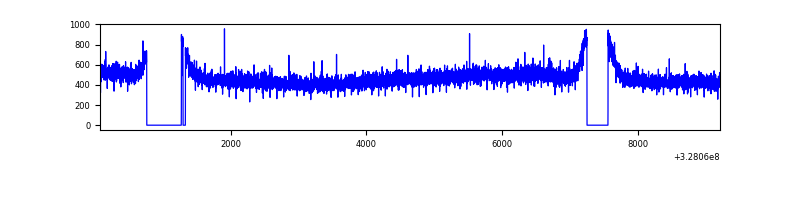 |
| B | 9138 | 8285 | 391 | 391 | 4.28% | 4.72% | 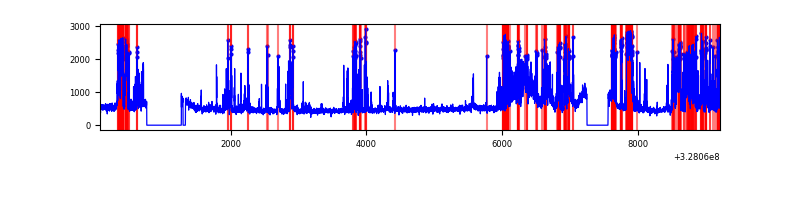 |
| C | 9139 | 8284 | 0 | 0 | 0.00% | 0.00% | 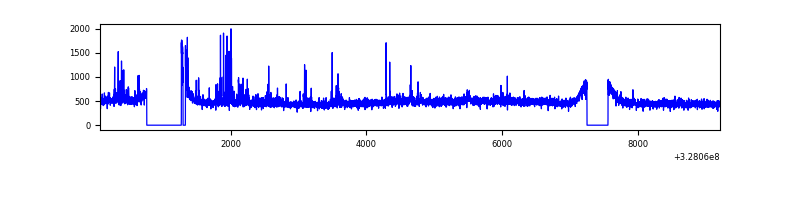 |
| D | 9139 | 8285 | 17 | 17 | 0.19% | 0.21% | 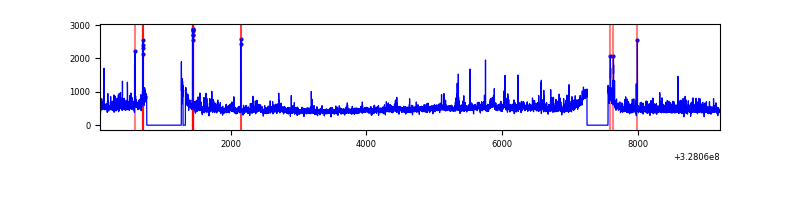 |
Top three noisy pixels from each quadrant. If the there are fewer than three noisy pixels in the level2.evt file, extra rows are filled as -1
| Pixel properties | Quadrant properties | ||||||
|---|---|---|---|---|---|---|---|
| Quadrant | DetID | PixID | Counts | Sigma | Mean | Median | Sigma |
| A | 13 | 254 | 13589 | 62.37 | 1007 | 985 | 202.1 |
| A | 3 | 137 | 9363 | 41.46 | 1007 | 985 | 202.1 |
| A | 0 | 226 | 8692 | 38.14 | 1007 | 985 | 202.1 |
| B | 3 | 64 | 2184118 | 11839.37 | 976 | 951 | 184.4 |
| B | 0 | 189 | 50595 | 269.22 | 976 | 951 | 184.4 |
| B | 0 | 190 | 33221 | 175.0 | 976 | 951 | 184.4 |
| C | 3 | 233 | 217089 | 962.28 | 958 | 961 | 224.6 |
| C | 14 | 238 | 152442 | 674.45 | 958 | 961 | 224.6 |
| C | 7 | 247 | 13951 | 57.84 | 958 | 961 | 224.6 |
| D | 8 | 195 | 322079 | 1373.94 | 971 | 942 | 233.7 |
| D | 1 | 52 | 89319 | 378.11 | 971 | 942 | 233.7 |
| D | 2 | 244 | 72275 | 305.19 | 971 | 942 | 233.7 |
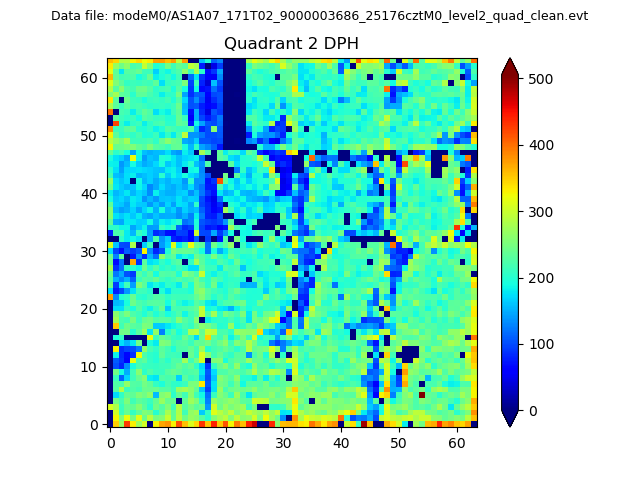
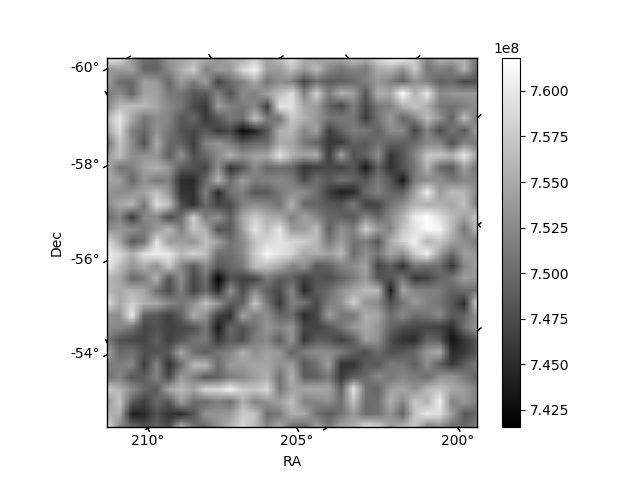
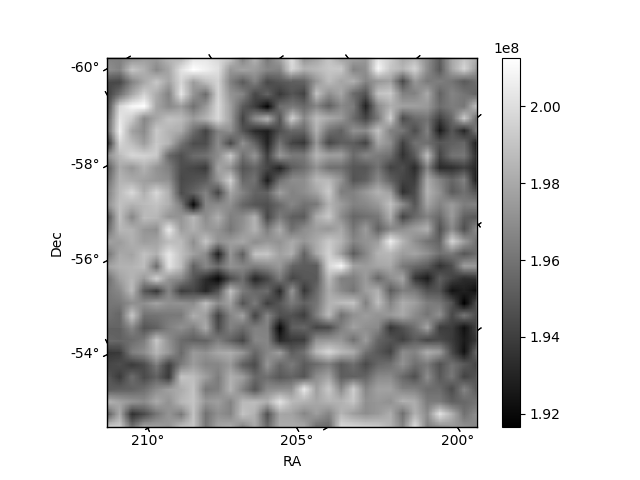
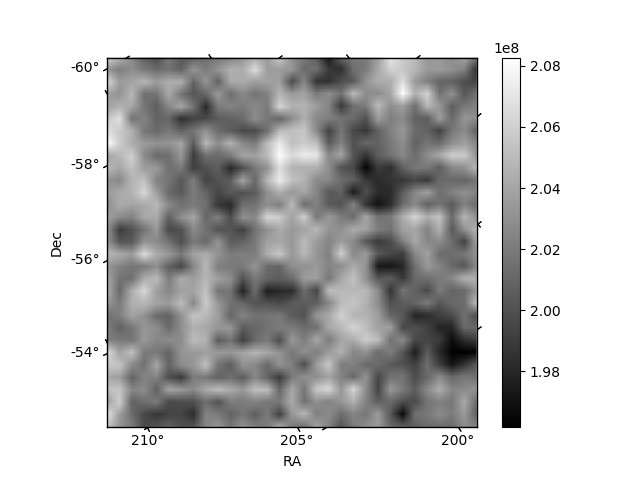
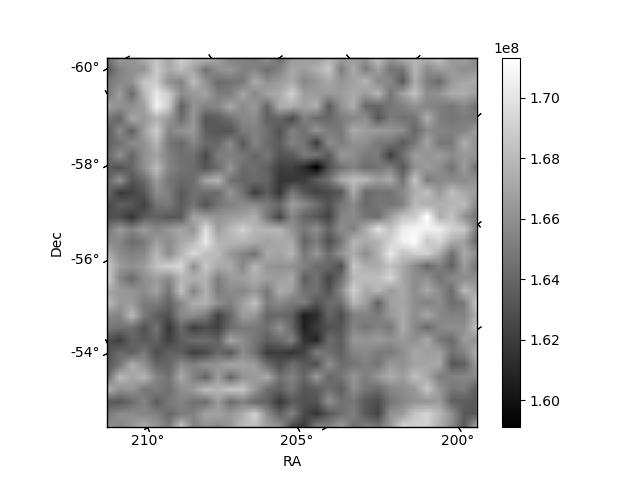
Histogram calculated using DETX and DETY for each event in the final _common_clean file
| Quadrant A | 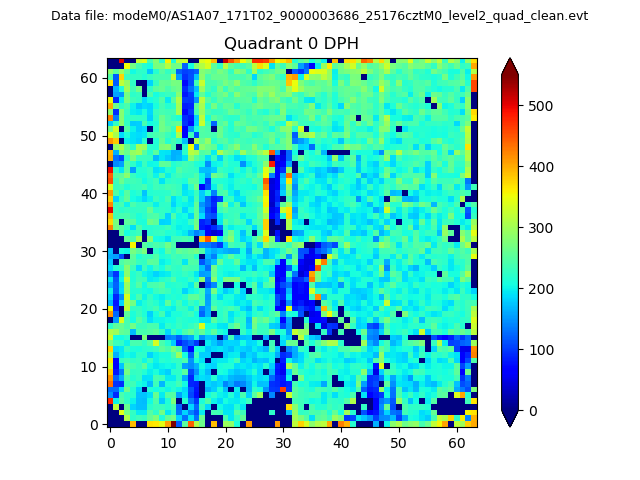 |
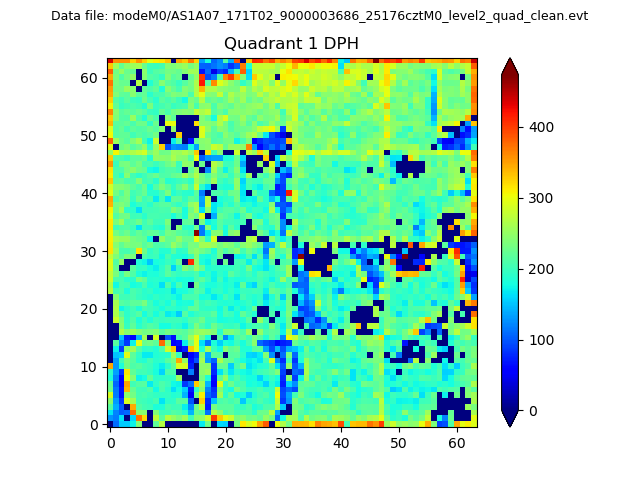 |
Quadrant B |
|---|---|---|---|
| Quadrant D | 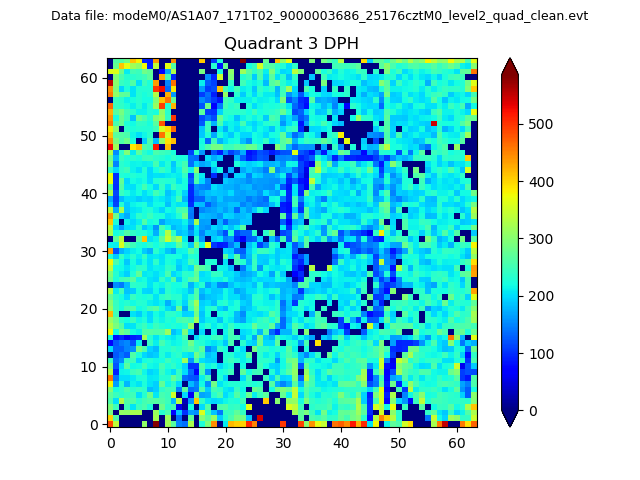 |
 |
Quadrant C |
| Plot type | Count rate plots | Images |
|---|---|---|
| Comparison with Poisson distribution Blue bars denote a histogram of data divided into 1 sec bins. Red curve is a Poisson curve with rate = median count rate of data. |
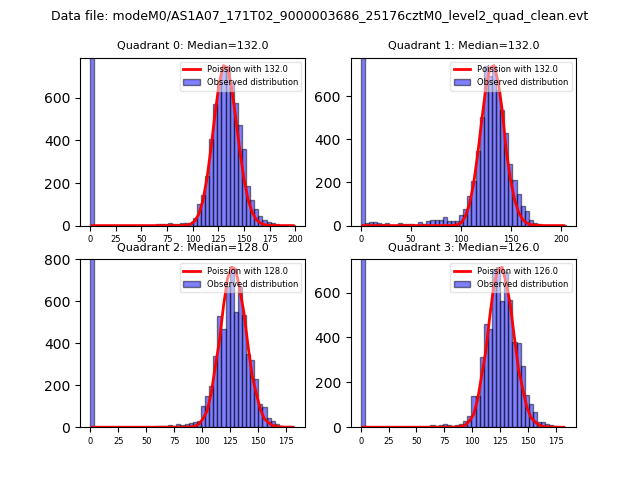 |
 |
| Quadrant-wise count rates Data is divided into 100 sec bins |
 |
|
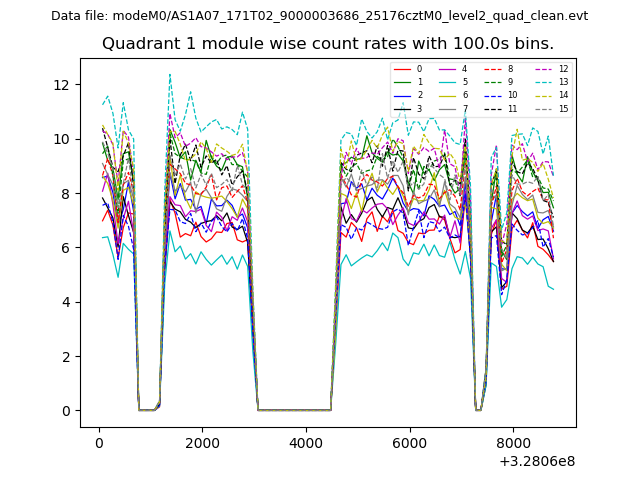
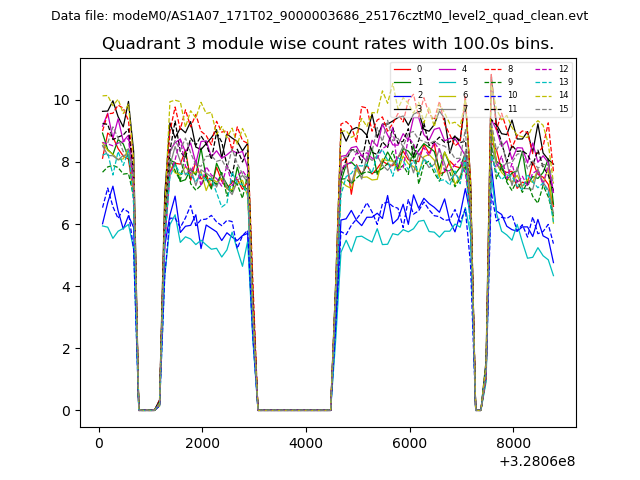
| Module-wise count rates for Quadrant A Data is divided into 100 sec bins |
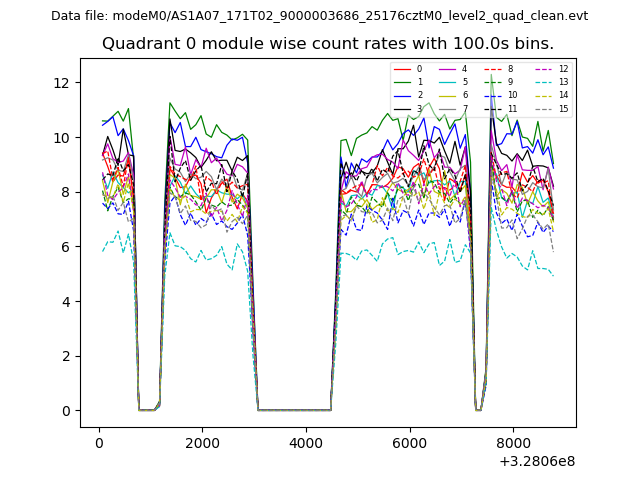 |
 |
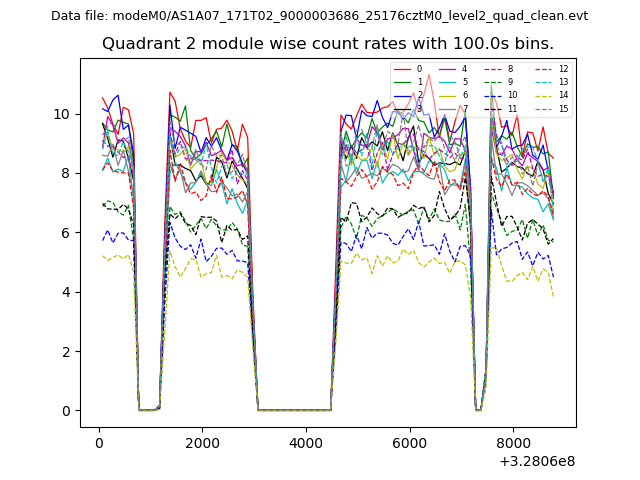
| Module-wise count rates for Quadrant B Data is divided into 100 sec bins |
 |
 |
| Module-wise count rates for Quadrant C Data is divided into 100 sec bins |
 |
 |
| Module-wise count rates for Quadrant D Data is divided into 100 sec bins |
 |
 |
| Parameter | Plot |
|---|---|
| CZT HV Monitor | 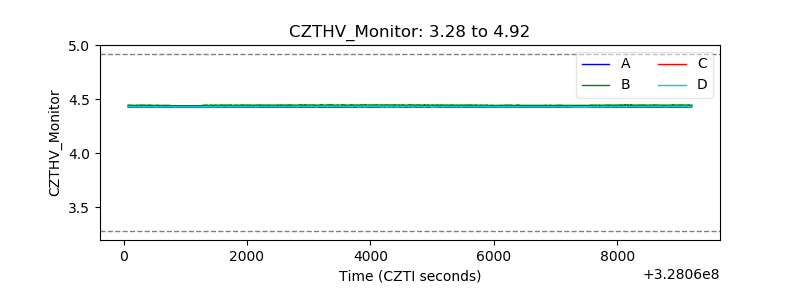 |
| D_VDD | 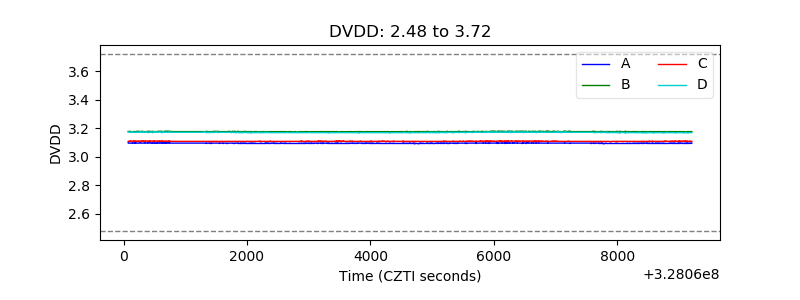 |
| Temperature 1 | 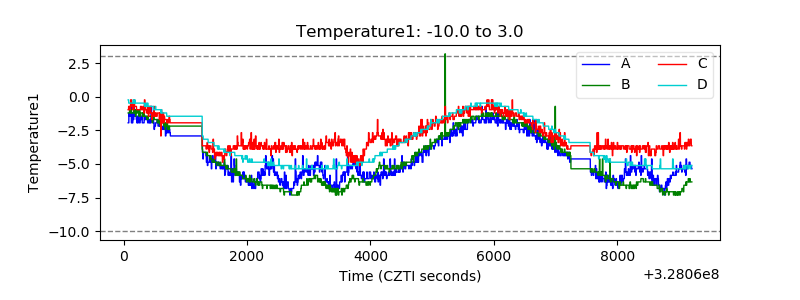 |
| Veto HV Monitor | 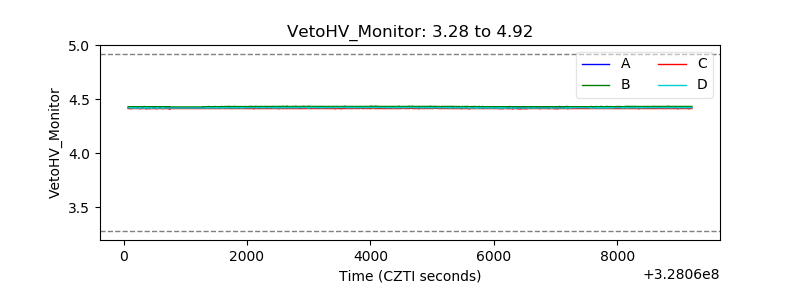 |
| Veto LLD | 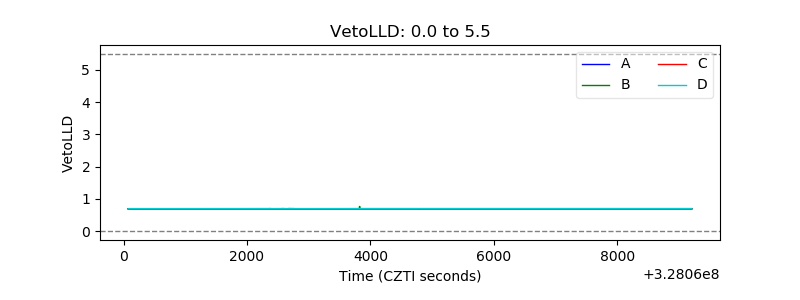 |
| Alpha Counter | 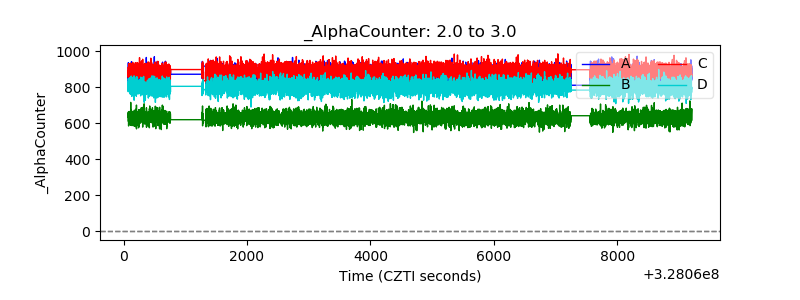 |
| _CPM_Rate | 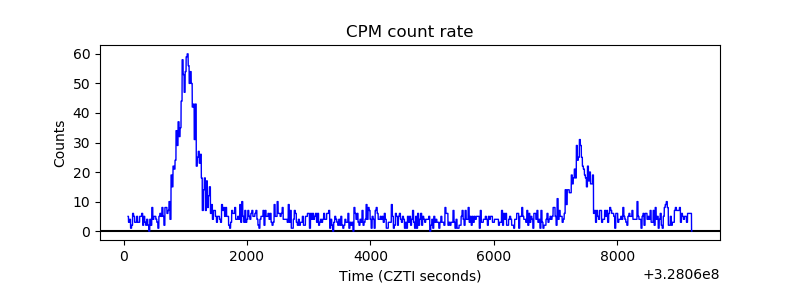 |
| CZT Counter | 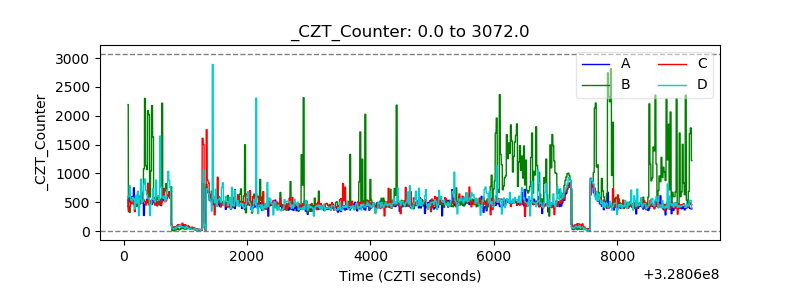 |
| +2.5 Volts monitor | 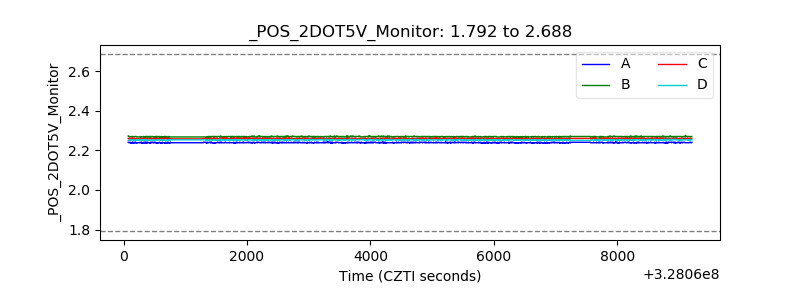 |
| +5 Volts monitor | 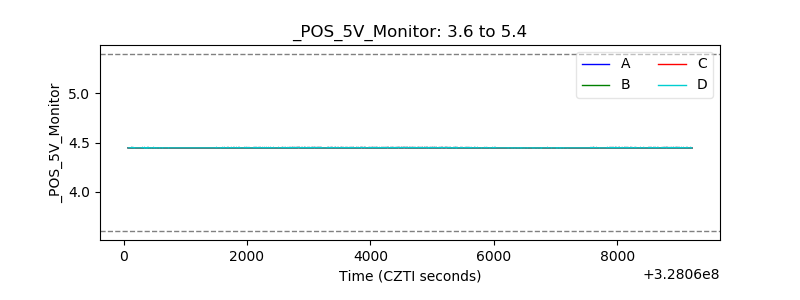 |
| _ROLL_ROT | 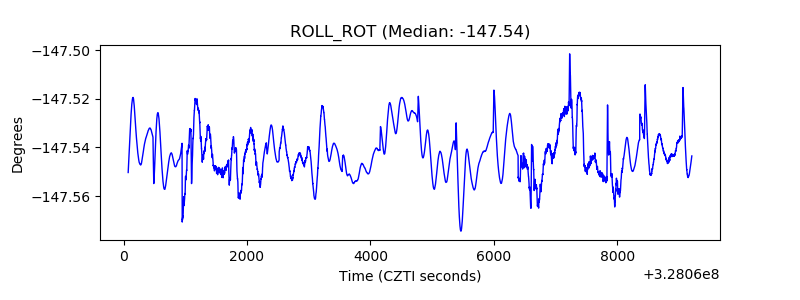 |
| _Roll_DEC | 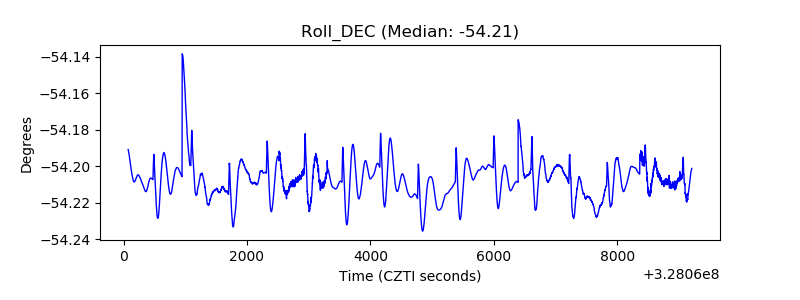 |
| _Roll_RA | 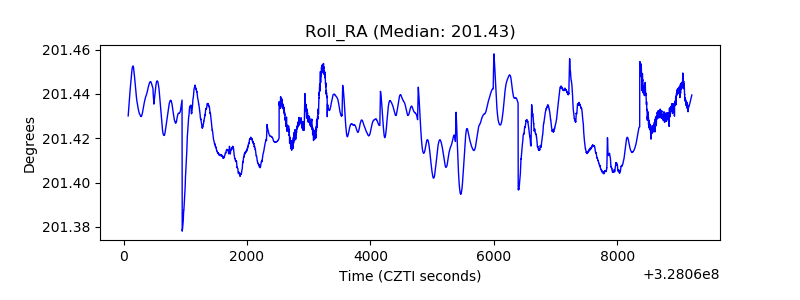 |
| Veto Counter | 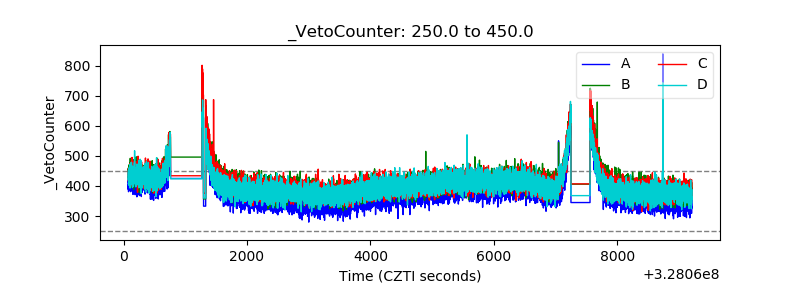 |