| Param | Original file | Final file |
|---|---|---|
| Filename | modeM0/AS1A07_171T02_9000003686_25177cztM0_level2.evt | modeM0/AS1A07_171T02_9000003686_25177cztM0_level2_quad_clean.evt |
| Size (bytes) | 618,382,080 | 100,725,120 |
| Size | 589.7 MB | 96.1 MB |
| Events in quadrant A | 3,373,655 | 660,250 |
| Events in quadrant B | 7,599,119 | 613,316 |
| Events in quadrant C | 3,567,405 | 634,482 |
| Events in quadrant D | 3,687,608 | 628,930 |
| Mode M0 | |||
|---|---|---|---|
| Quadrant | BADHDUFLAG | Total packets | Discarded packets |
| A | 0 | 14996 | 0 |
| B | 0 | 27357 | 0 |
| C | 0 | 15381 | 0 |
| D | 0 | 15716 | 0 |
| Mode M9 | |||
|---|---|---|---|
| Quadrant | BADHDUFLAG | Total packets | Discarded packets |
| A | 0 | 4 | 0 |
| B | 0 | 4 | 0 |
| C | 0 | 4 | 0 |
| D | 0 | 4 | 0 |
| Quadrant | Total seconds | Saturated seconds | Saturation percentage |
|---|---|---|---|
| A | 7369 | 36 | 0.488533% |
| B | 7370 | 1599 | 21.696065% |
| C | 7370 | 94 | 1.275441% |
| D | 7370 | 31 | 0.420624% |
Noise dominated data is calculated using 1-second bins in cleaned event files. If a bin has >2000 counts, and if more than 50% of those come from <1% of pixels, then it is considered to be noise-dominated and hence unusable.
| Quadrant | # 1 sec bins | Bins with >0 counts | Bins with >2000 counts | High rate bins dominated by noise | Noise dominated (total time) | Noise dominated (detector-on time) | Marked lightcurve |
|---|---|---|---|---|---|---|---|
| A | 7768 | 7368 | 0 | 0 | 0.00% | 0.00% |  |
| B | 7769 | 7369 | 1397 | 1397 | 17.98% | 18.96% | 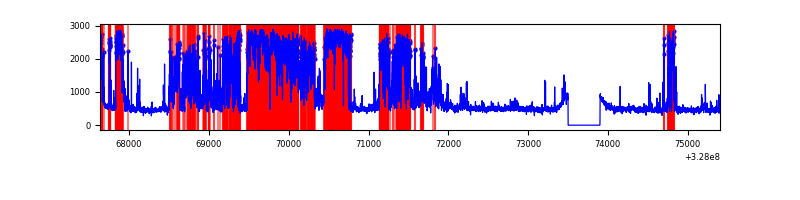 |
| C | 7769 | 7369 | 12 | 12 | 0.15% | 0.16% | 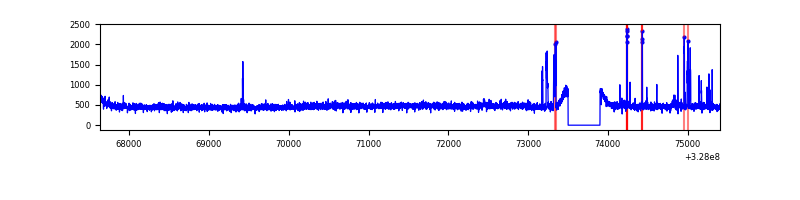 |
| D | 7769 | 7369 | 2 | 2 | 0.03% | 0.03% | 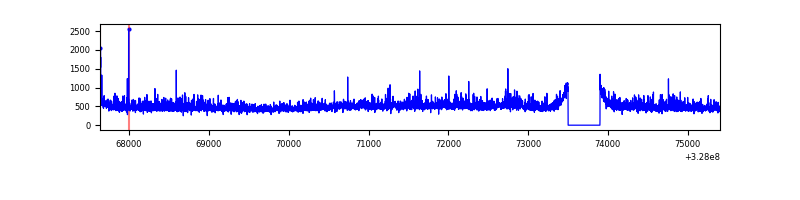 |
Top three noisy pixels from each quadrant. If the there are fewer than three noisy pixels in the level2.evt file, extra rows are filled as -1
| Pixel properties | Quadrant properties | ||||||
|---|---|---|---|---|---|---|---|
| Quadrant | DetID | PixID | Counts | Sigma | Mean | Median | Sigma |
| A | 13 | 254 | 11596 | 61.25 | 875 | 857 | 175.3 |
| A | 3 | 137 | 8173 | 41.73 | 875 | 857 | 175.3 |
| A | 0 | 226 | 7484 | 37.8 | 875 | 857 | 175.3 |
| B | 3 | 64 | 4394969 | 29085.21 | 794 | 773 | 151.1 |
| B | 0 | 189 | 28442 | 183.14 | 794 | 773 | 151.1 |
| B | 0 | 190 | 26301 | 168.97 | 794 | 773 | 151.1 |
| C | 7 | 247 | 146891 | 745.28 | 838 | 841 | 196.0 |
| C | 14 | 238 | 136397 | 691.73 | 838 | 841 | 196.0 |
| C | 9 | 54 | 10417 | 48.87 | 838 | 841 | 196.0 |
| D | 8 | 195 | 402281 | 1963.44 | 848 | 824 | 204.5 |
| D | 2 | 234 | 30111 | 143.24 | 848 | 824 | 204.5 |
| D | 1 | 52 | 28894 | 137.28 | 848 | 824 | 204.5 |
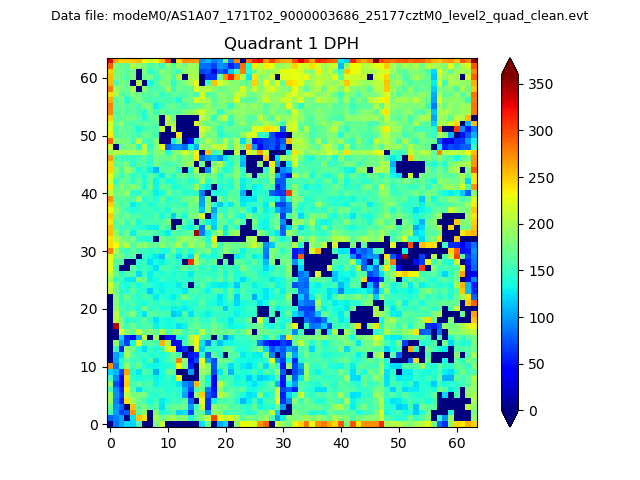
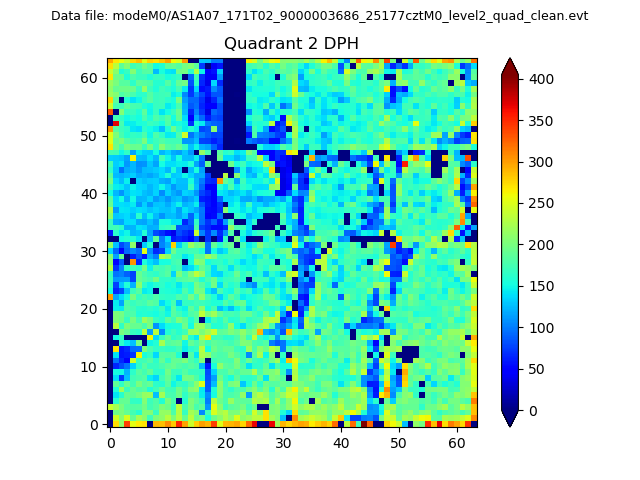
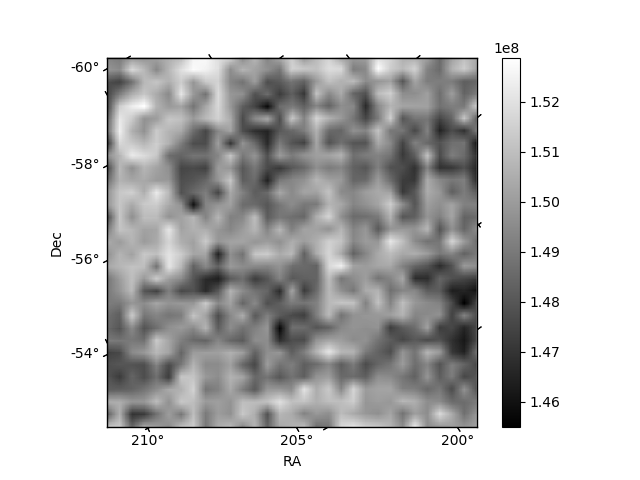
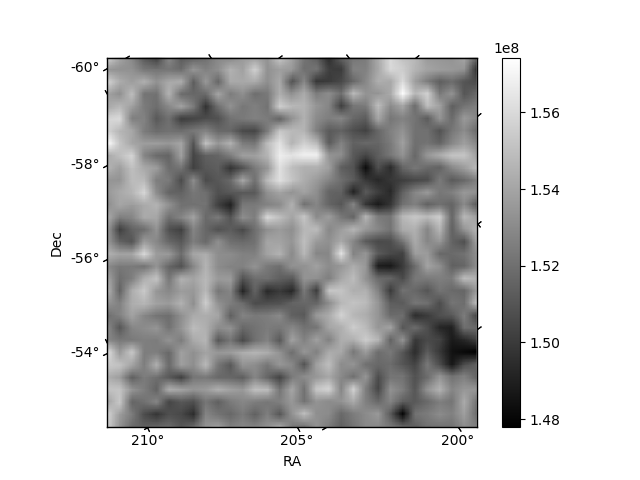
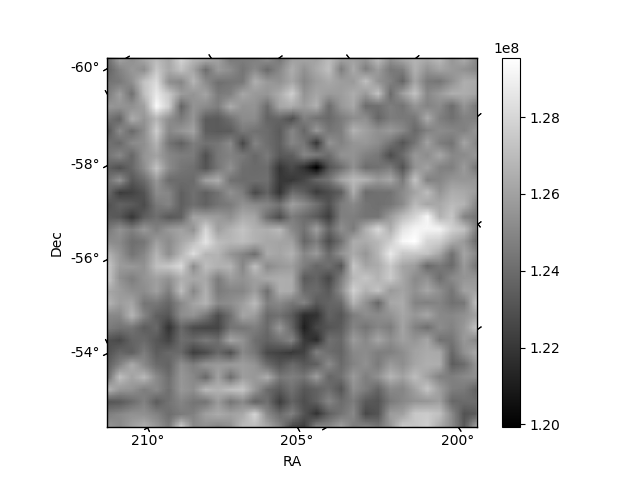
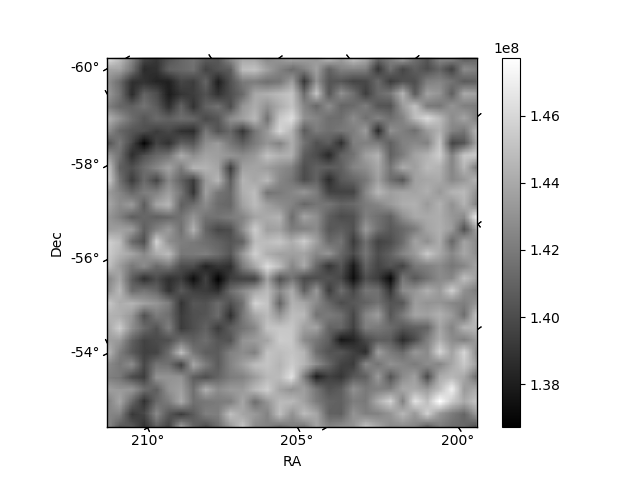
Histogram calculated using DETX and DETY for each event in the final _common_clean file
| Quadrant A | 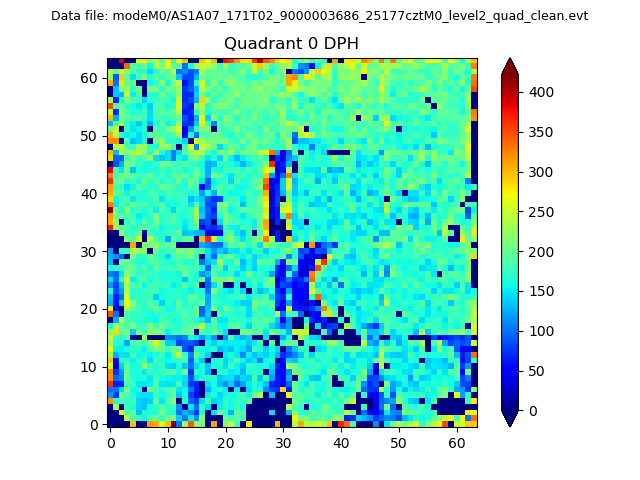 |
 |
Quadrant B |
|---|---|---|---|
| Quadrant D |  |
 |
Quadrant C |
| Plot type | Count rate plots | Images |
|---|---|---|
| Comparison with Poisson distribution Blue bars denote a histogram of data divided into 1 sec bins. Red curve is a Poisson curve with rate = median count rate of data. |
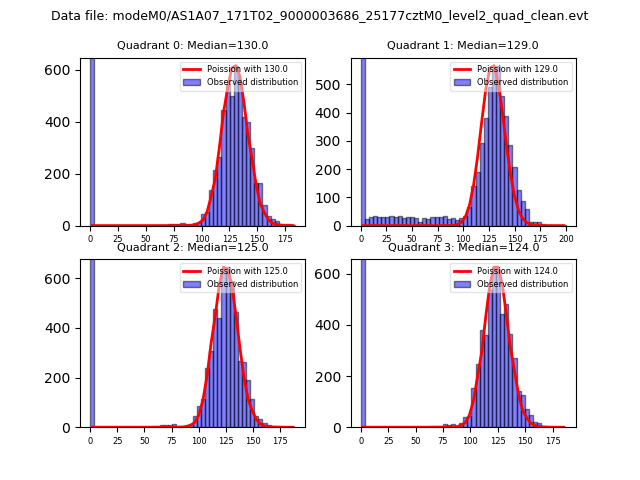 |
 |
| Quadrant-wise count rates Data is divided into 100 sec bins |
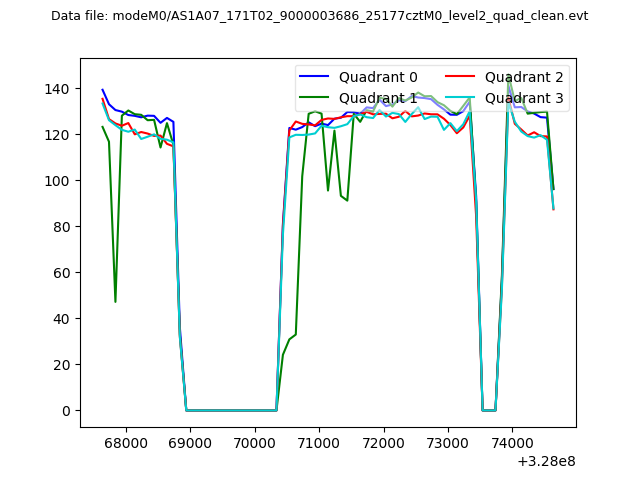 |
|
| Module-wise count rates for Quadrant A Data is divided into 100 sec bins |
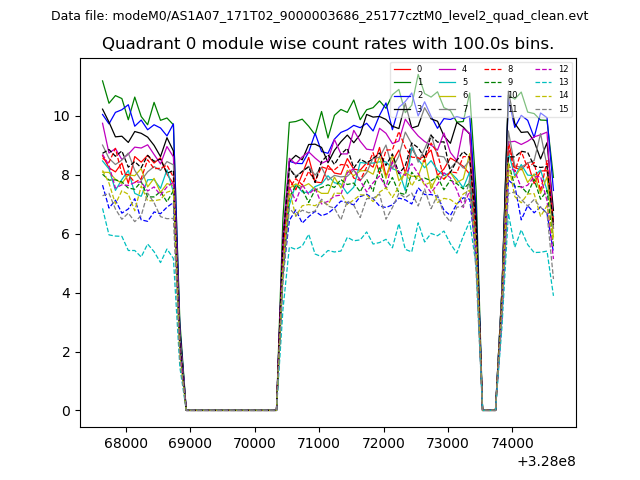 |
 |
| Module-wise count rates for Quadrant B Data is divided into 100 sec bins |
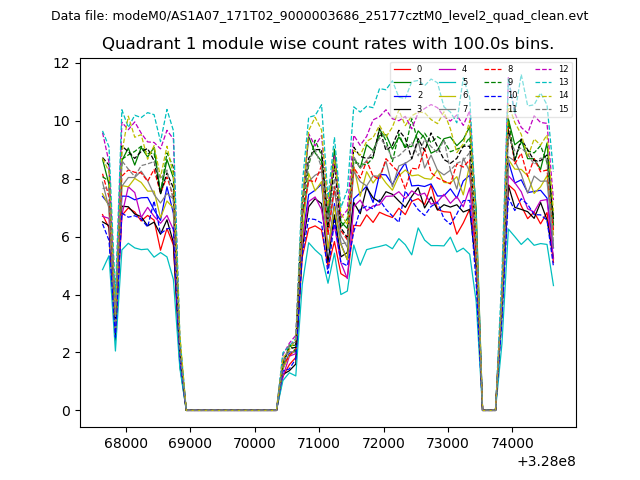 |
 |
| Module-wise count rates for Quadrant C Data is divided into 100 sec bins |
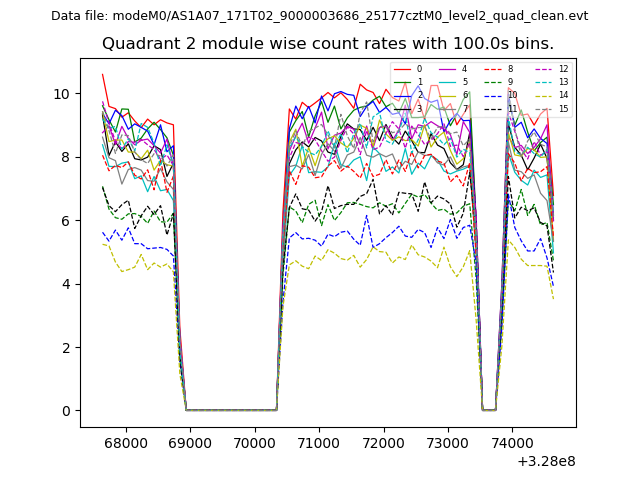 |
 |
| Module-wise count rates for Quadrant D Data is divided into 100 sec bins |
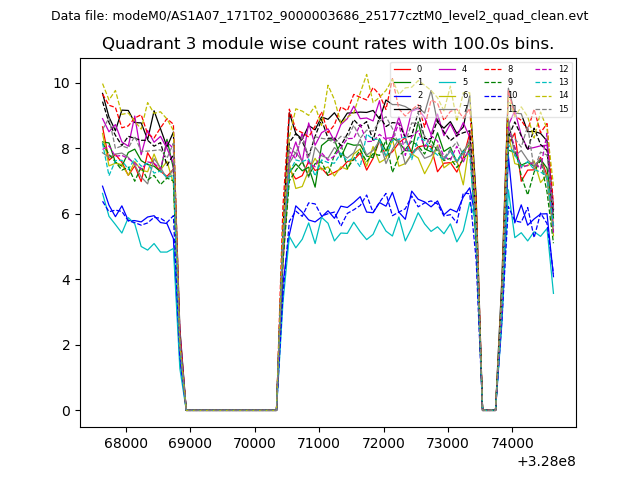 |
 |
| Parameter | Plot |
|---|---|
| CZT HV Monitor | 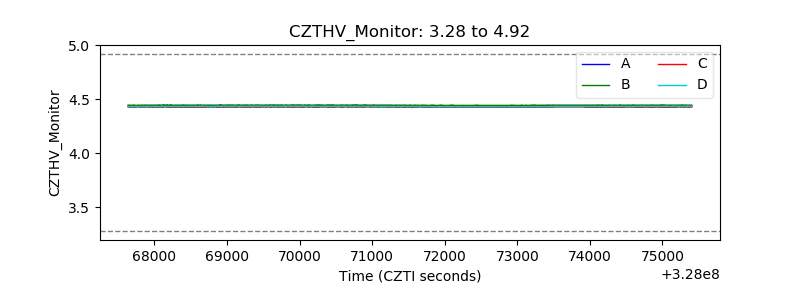 |
| D_VDD | 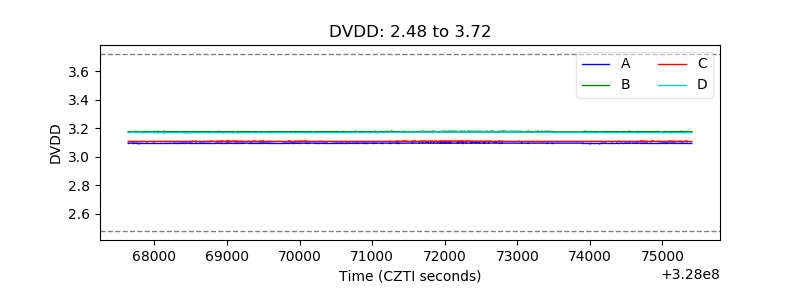 |
| Temperature 1 | 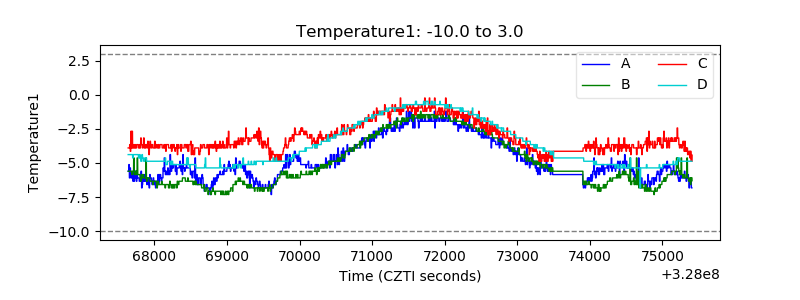 |
| Veto HV Monitor |  |
| Veto LLD | 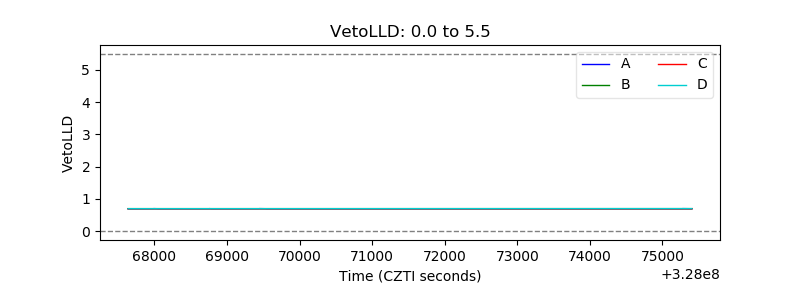 |
| Alpha Counter | 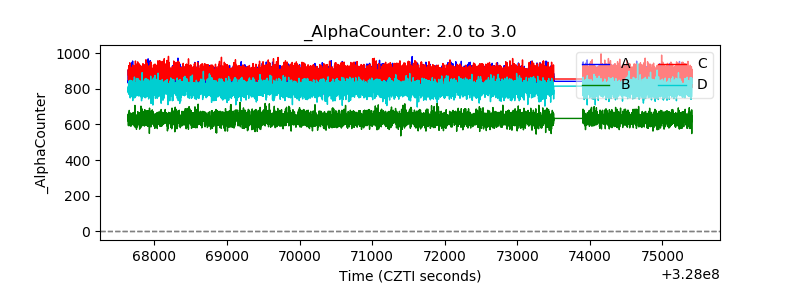 |
| _CPM_Rate | 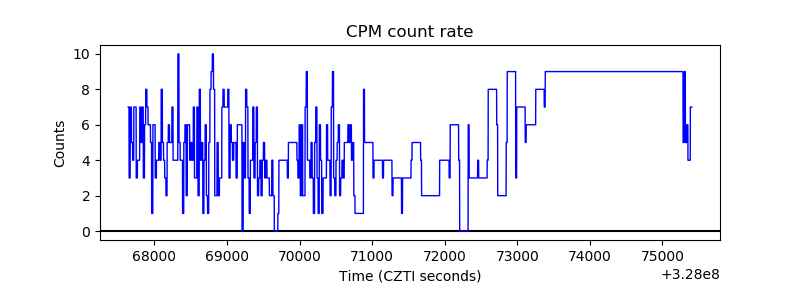 |
| CZT Counter | 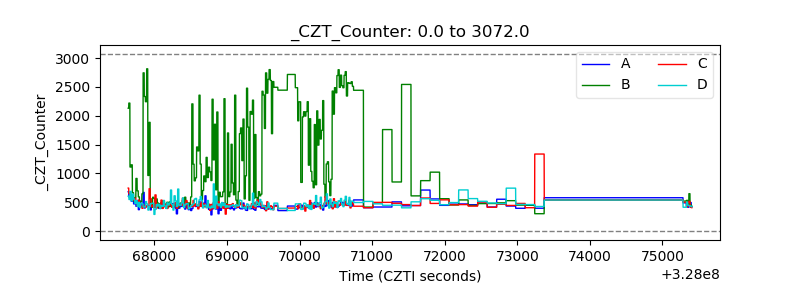 |
| +2.5 Volts monitor |  |
| +5 Volts monitor | 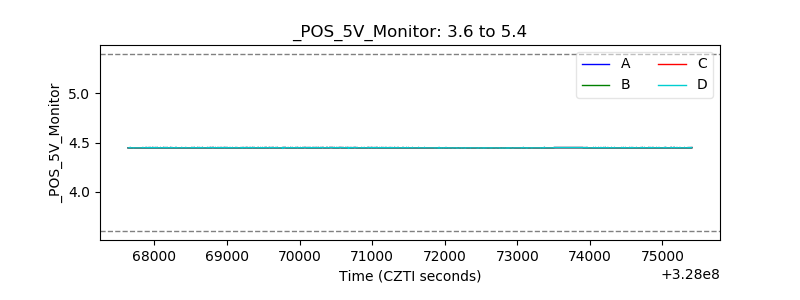 |
| _ROLL_ROT | 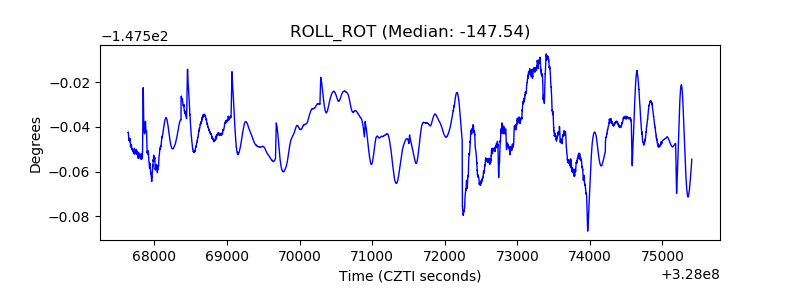 |
| _Roll_DEC | 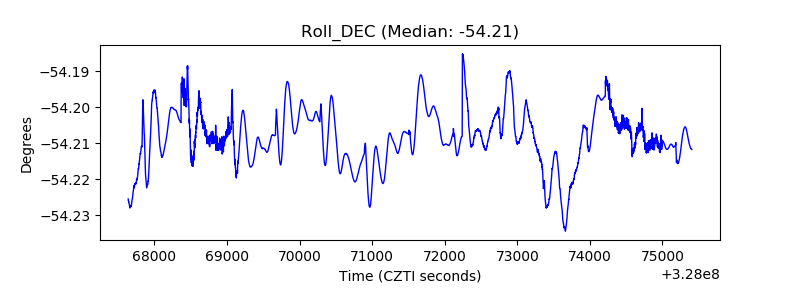 |
| _Roll_RA | 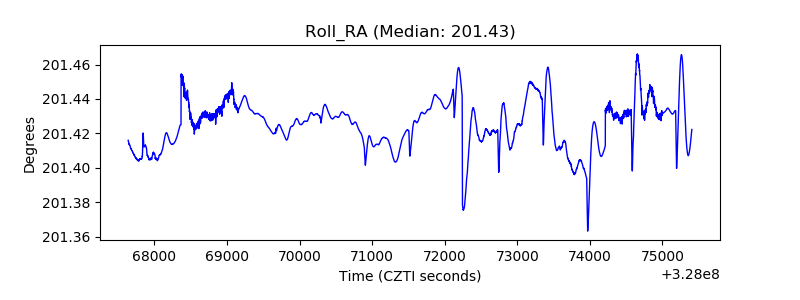 |
| Veto Counter | 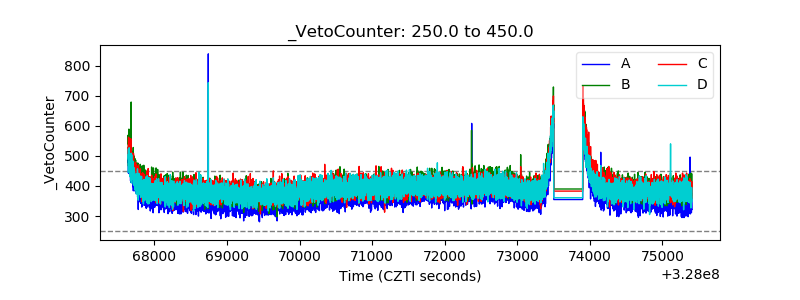 |