| Param | Original file | Final file |
|---|---|---|
| Filename | modeM0/AS1A07_171T02_9000003686_25180cztM0_level2.evt | modeM0/AS1A07_171T02_9000003686_25180cztM0_level2_quad_clean.evt |
| Size (bytes) | 1,300,481,280 | 257,250,240 |
| Size | 1.2 GB | 245.3 MB |
| Events in quadrant A | 8,721,412 | 1,653,450 |
| Events in quadrant B | 9,289,419 | 1,675,346 |
| Events in quadrant C | 9,652,224 | 1,599,282 |
| Events in quadrant D | 10,456,431 | 1,573,941 |
| Mode M0 | |||
|---|---|---|---|
| Quadrant | BADHDUFLAG | Total packets | Discarded packets |
| A | 0 | 38194 | 0 |
| B | 0 | 39414 | 0 |
| C | 0 | 40822 | 0 |
| D | 0 | 42938 | 0 |
| Mode M9 | |||
|---|---|---|---|
| Quadrant | BADHDUFLAG | Total packets | Discarded packets |
| A | 0 | 24 | 0 |
| B | 0 | 24 | 0 |
| C | 0 | 24 | 0 |
| D | 0 | 24 | 0 |
| Quadrant | Total seconds | Saturated seconds | Saturation percentage |
|---|---|---|---|
| A | 18698 | 193 | 1.032196% |
| B | 18715 | 341 | 1.822068% |
| C | 18705 | 453 | 2.421812% |
| D | 18709 | 271 | 1.448501% |
Noise dominated data is calculated using 1-second bins in cleaned event files. If a bin has >2000 counts, and if more than 50% of those come from <1% of pixels, then it is considered to be noise-dominated and hence unusable.
| Quadrant | # 1 sec bins | Bins with >0 counts | Bins with >2000 counts | High rate bins dominated by noise | Noise dominated (total time) | Noise dominated (detector-on time) | Marked lightcurve |
|---|---|---|---|---|---|---|---|
| A | 21336 | 18734 | 0 | 0 | 0.00% | 0.00% | 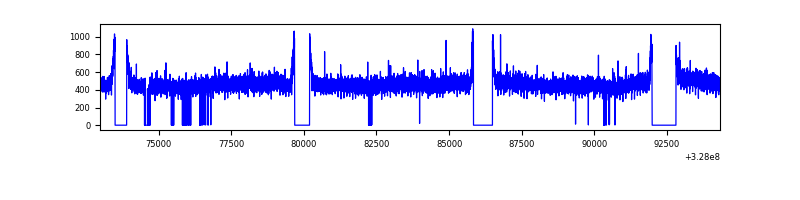 |
| B | 21337 | 18747 | 62 | 62 | 0.29% | 0.33% | 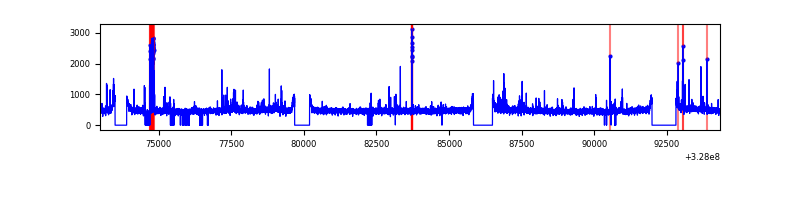 |
| C | 21337 | 18731 | 102 | 102 | 0.48% | 0.54% | 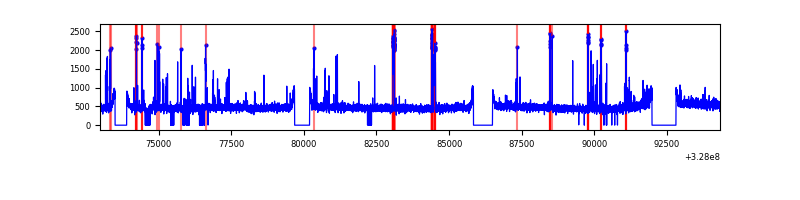 |
| D | 21337 | 18755 | 100 | 100 | 0.47% | 0.53% | 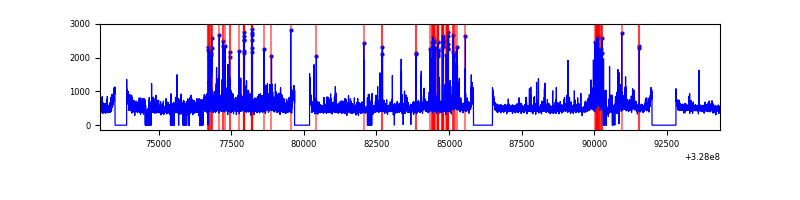 |
Top three noisy pixels from each quadrant. If the there are fewer than three noisy pixels in the level2.evt file, extra rows are filled as -1
| Pixel properties | Quadrant properties | ||||||
|---|---|---|---|---|---|---|---|
| Quadrant | DetID | PixID | Counts | Sigma | Mean | Median | Sigma |
| A | 13 | 254 | 29430 | 60.21 | 2260 | 2210 | 452.1 |
| A | 3 | 137 | 21285 | 42.19 | 2260 | 2210 | 452.1 |
| A | 0 | 226 | 19289 | 37.78 | 2260 | 2210 | 452.1 |
| B | 3 | 64 | 247675 | 574.97 | 2248 | 2190 | 427.0 |
| B | 10 | 251 | 69860 | 158.49 | 2248 | 2190 | 427.0 |
| B | 12 | 111 | 53193 | 119.46 | 2248 | 2190 | 427.0 |
| C | 7 | 247 | 834932 | 1644.52 | 2165 | 2176 | 506.4 |
| C | 14 | 238 | 345845 | 678.67 | 2165 | 2176 | 506.4 |
| C | 2 | 16 | 15500 | 26.31 | 2165 | 2176 | 506.4 |
| D | 8 | 195 | 877455 | 1661.59 | 2196 | 2132 | 526.8 |
| D | 12 | 233 | 662285 | 1253.14 | 2196 | 2132 | 526.8 |
| D | 12 | 235 | 273519 | 515.16 | 2196 | 2132 | 526.8 |
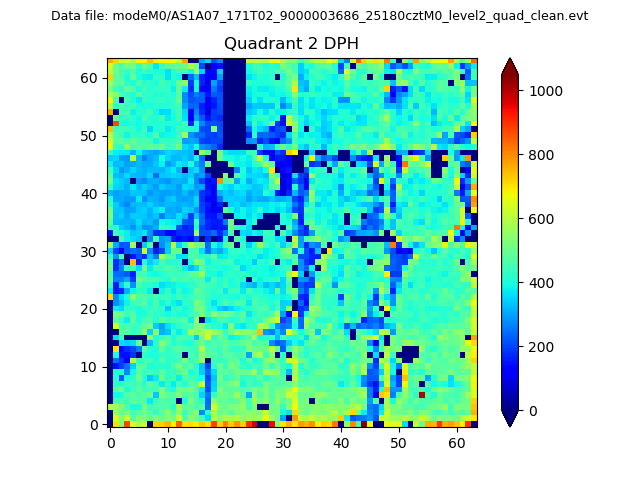
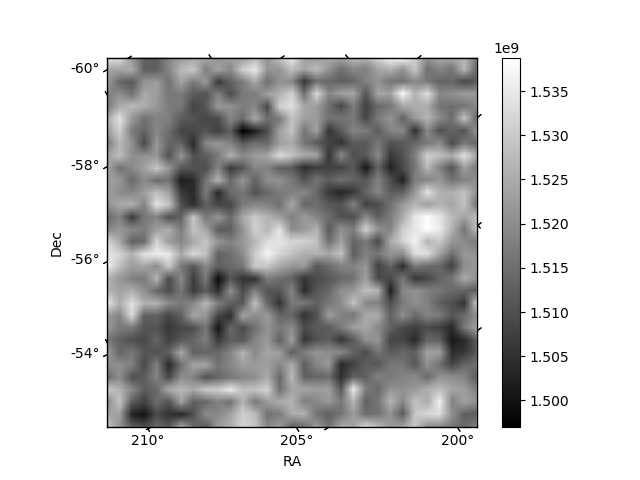
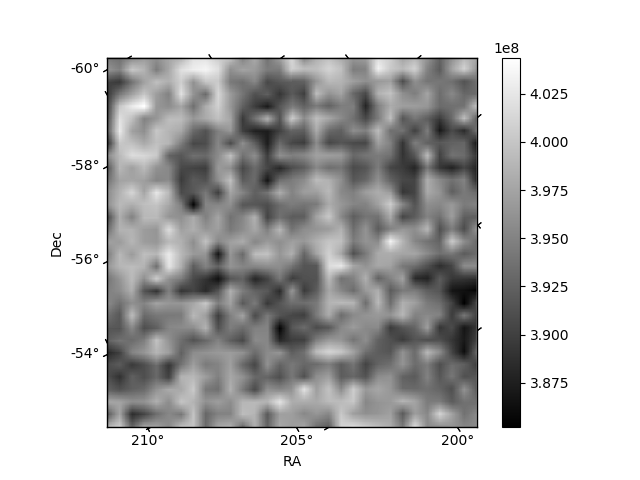
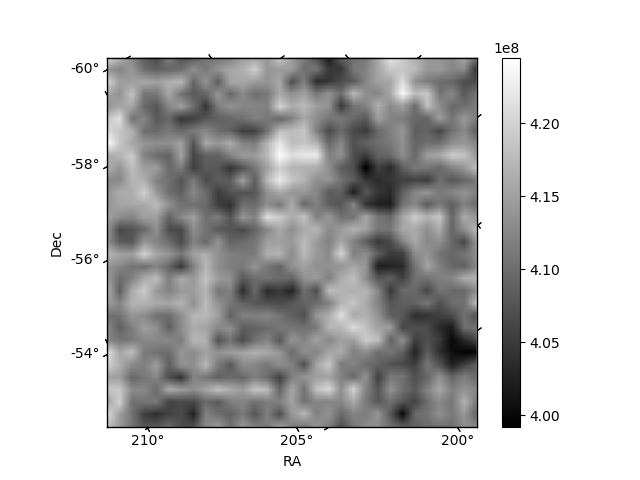
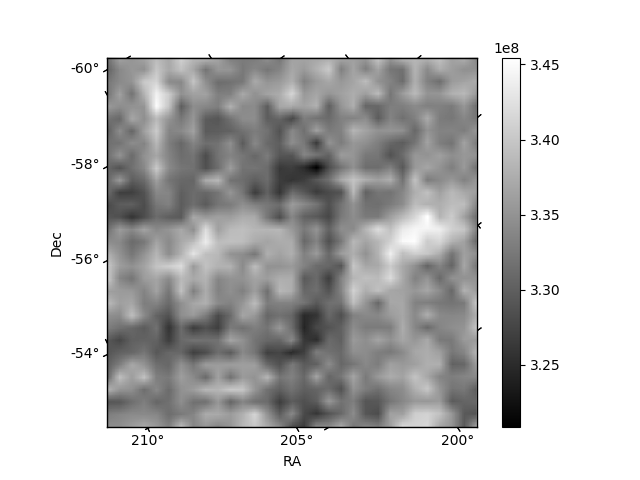
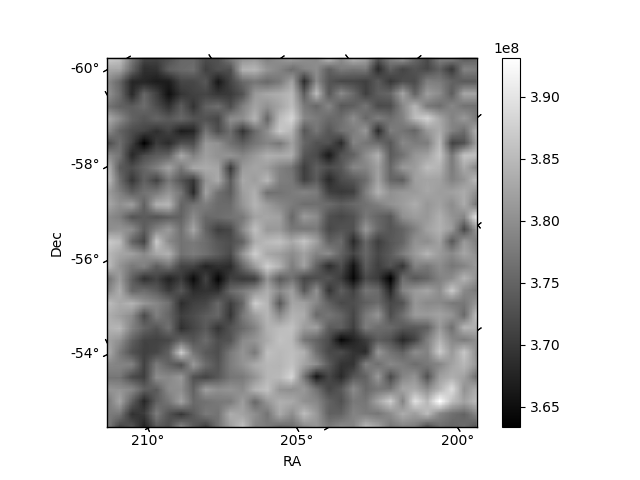
Histogram calculated using DETX and DETY for each event in the final _common_clean file
| Quadrant A | 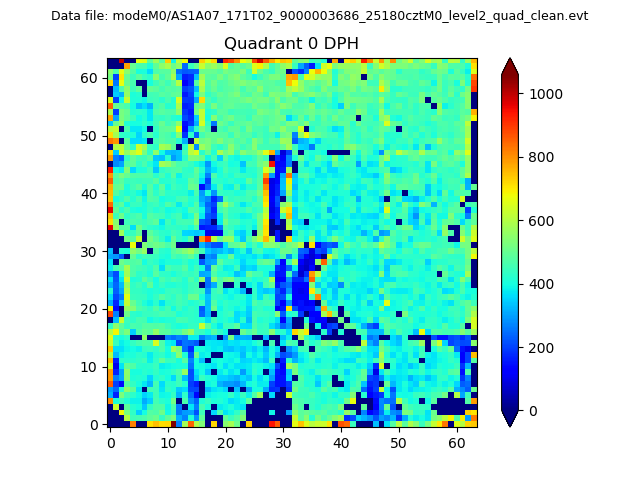 |
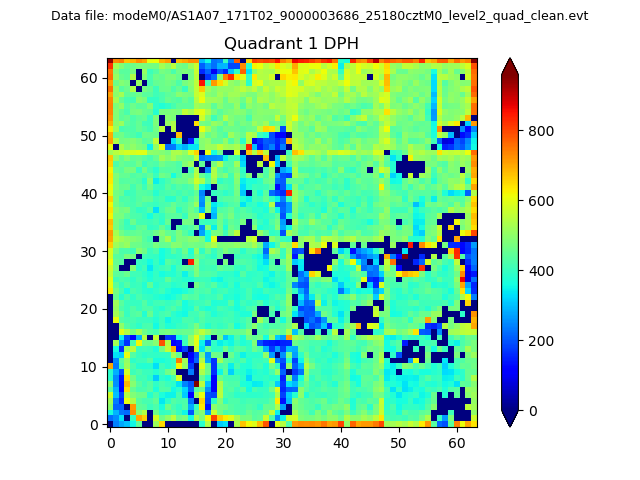 |
Quadrant B |
|---|---|---|---|
| Quadrant D | 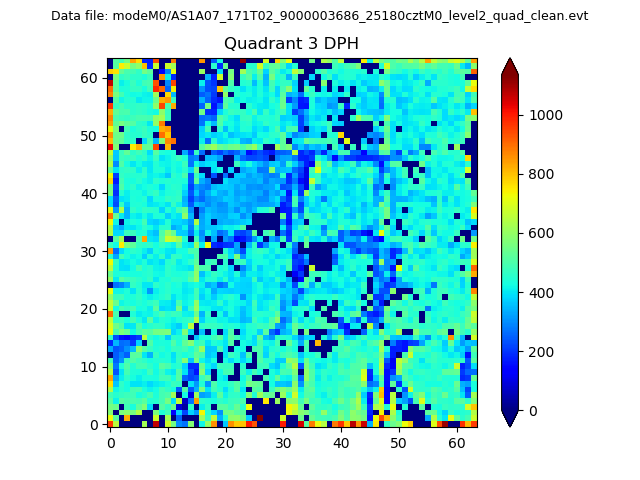 |
 |
Quadrant C |
| Plot type | Count rate plots | Images |
|---|---|---|
| Comparison with Poisson distribution Blue bars denote a histogram of data divided into 1 sec bins. Red curve is a Poisson curve with rate = median count rate of data. |
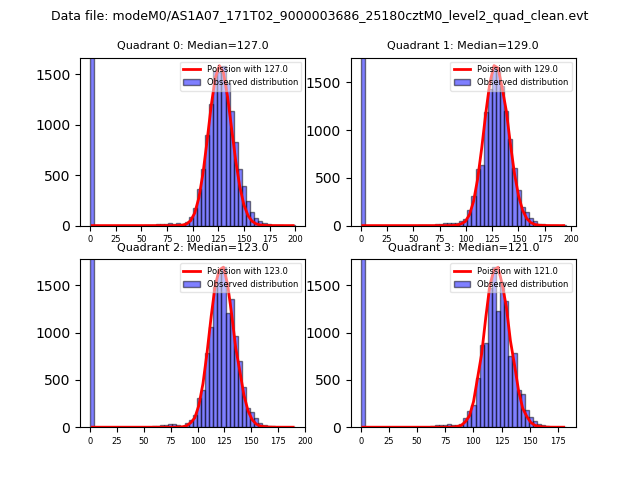 |
 |
| Quadrant-wise count rates Data is divided into 100 sec bins |
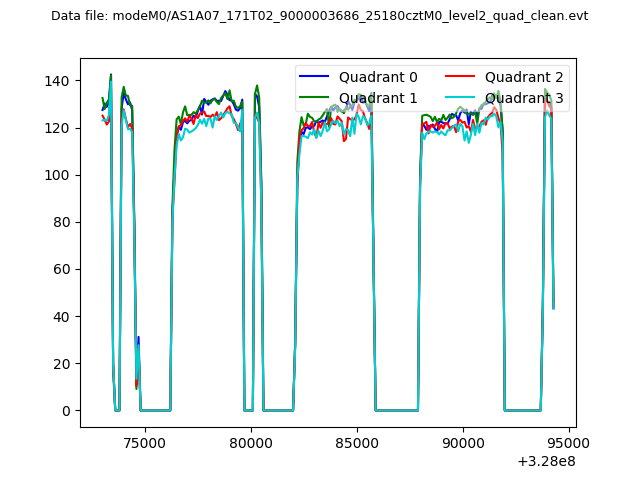 |
|
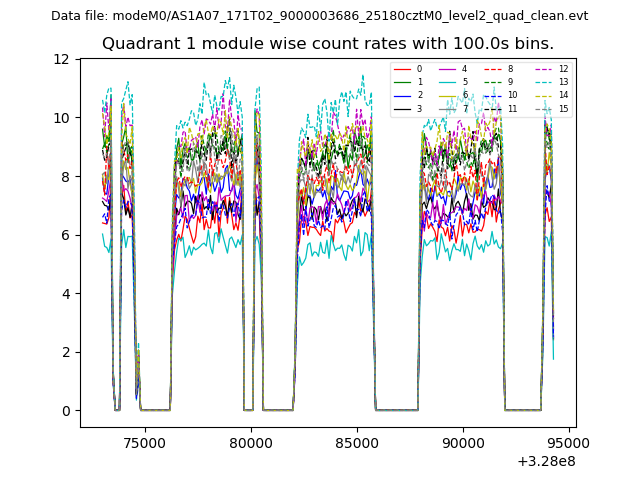
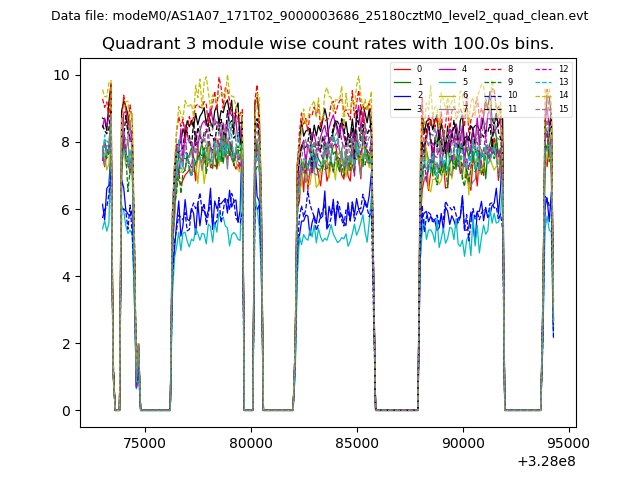
| Module-wise count rates for Quadrant A Data is divided into 100 sec bins |
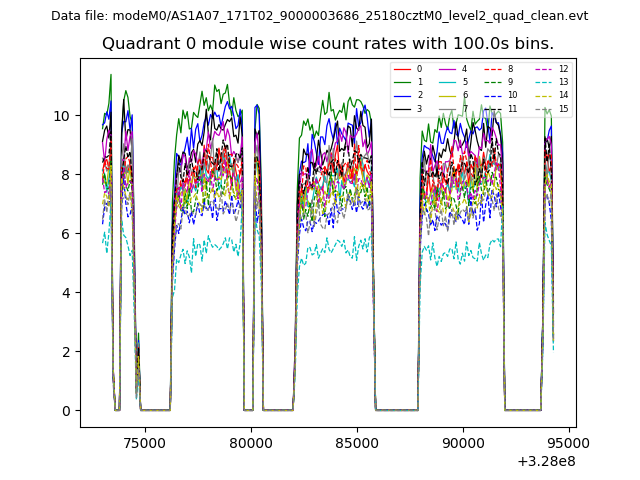 |
 |
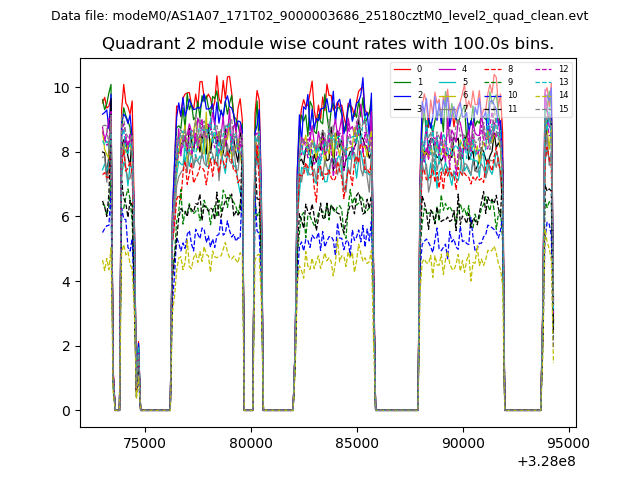
| Module-wise count rates for Quadrant B Data is divided into 100 sec bins |
 |
 |
| Module-wise count rates for Quadrant C Data is divided into 100 sec bins |
 |
 |
| Module-wise count rates for Quadrant D Data is divided into 100 sec bins |
 |
 |
| Parameter | Plot |
|---|---|
| CZT HV Monitor | 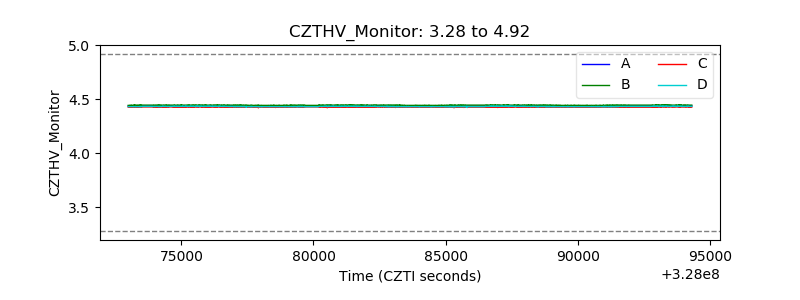 |
| D_VDD | 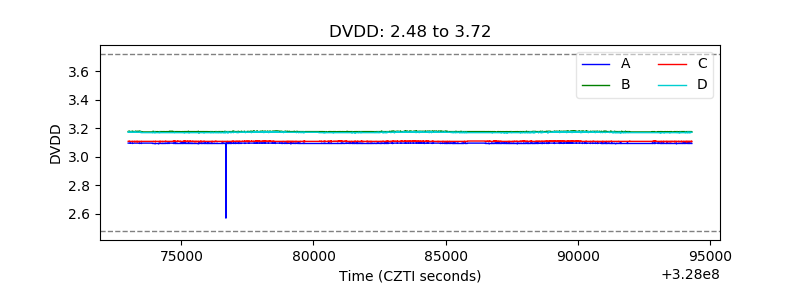 |
| Temperature 1 | 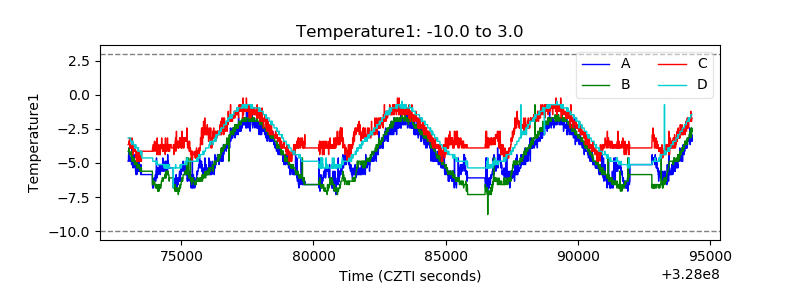 |
| Veto HV Monitor | 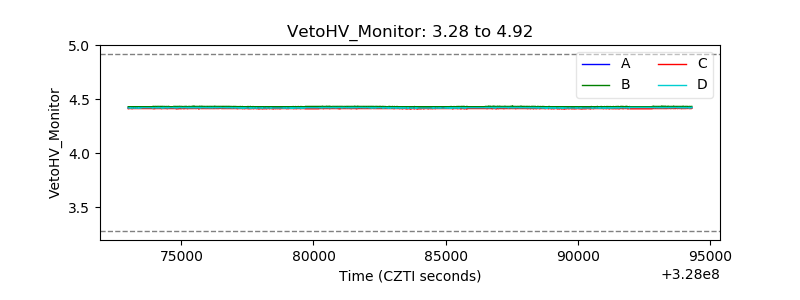 |
| Veto LLD | 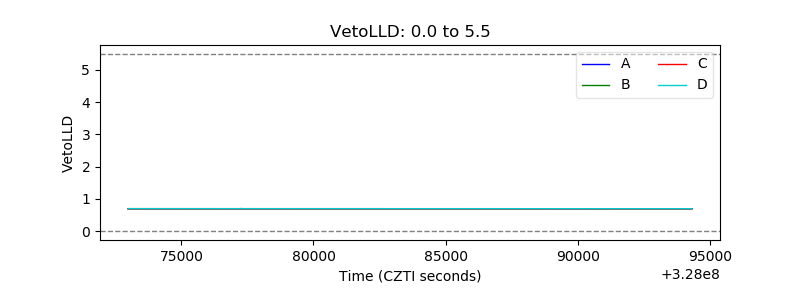 |
| Alpha Counter |  |
| _CPM_Rate | 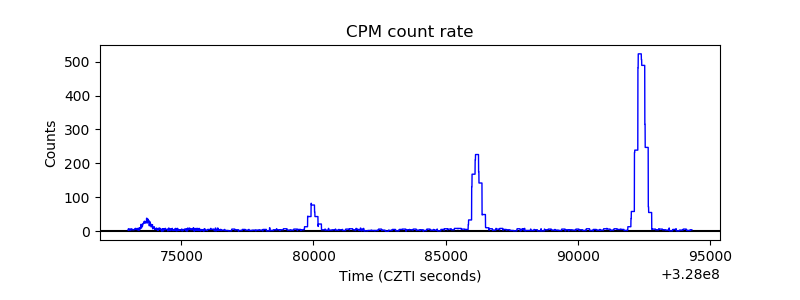 |
| CZT Counter | 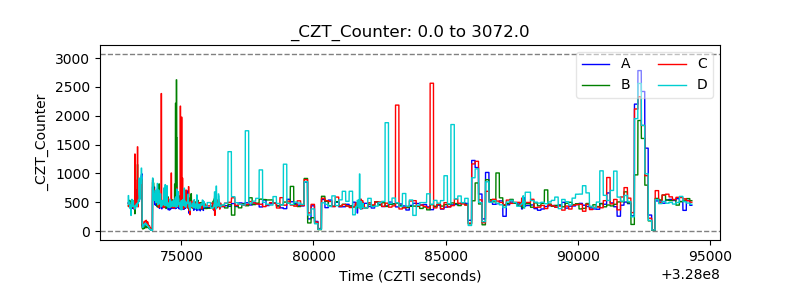 |
| +2.5 Volts monitor | 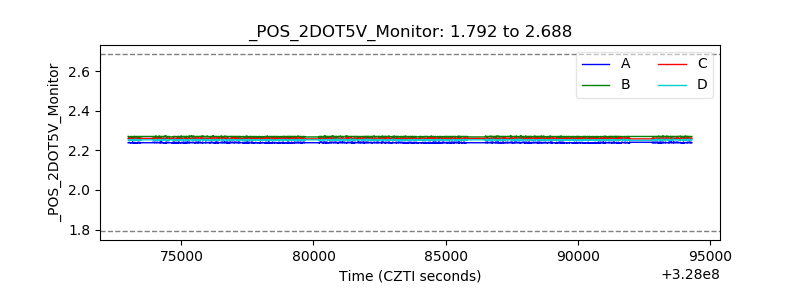 |
| +5 Volts monitor |  |
| _ROLL_ROT | 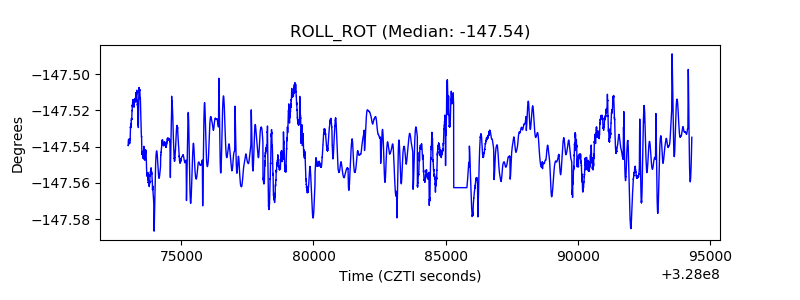 |
| _Roll_DEC | 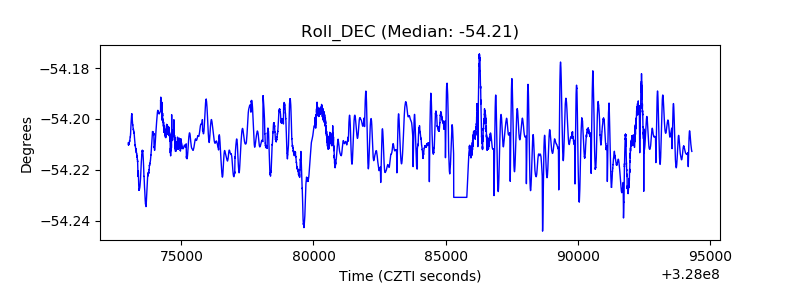 |
| _Roll_RA | 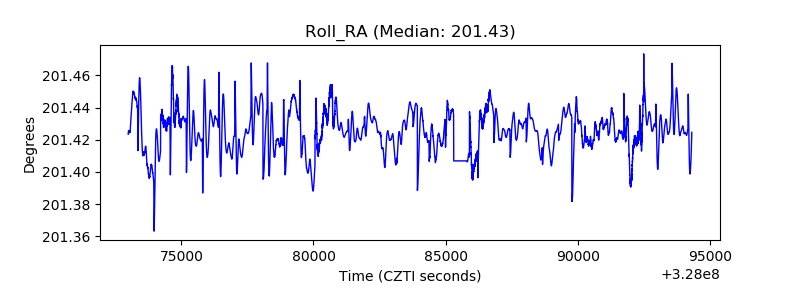 |
| Veto Counter | 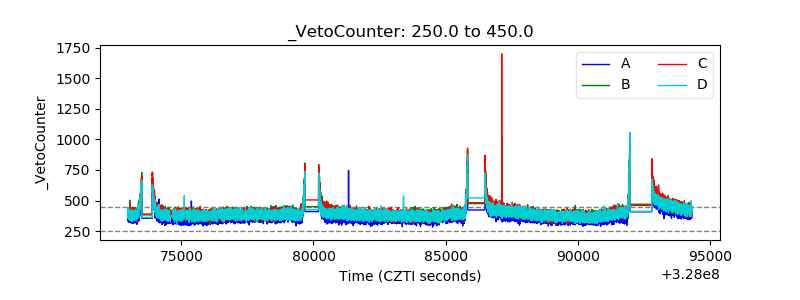 |