| Param | Original file | Final file |
|---|---|---|
| Filename | modeM0/AS1A07_171T02_9000003686_25185cztM0_level2.evt | modeM0/AS1A07_171T02_9000003686_25185cztM0_level2_quad_clean.evt |
| Size (bytes) | 212,981,760 | 59,215,680 |
| Size | 203.1 MB | 56.5 MB |
| Events in quadrant A | 1,392,352 | 399,299 |
| Events in quadrant B | 1,444,928 | 402,691 |
| Events in quadrant C | 1,627,438 | 386,304 |
| Events in quadrant D | 1,769,445 | 380,833 |
| Mode M0 | |||
|---|---|---|---|
| Quadrant | BADHDUFLAG | Total packets | Discarded packets |
| A | 0 | 6292 | 0 |
| B | 0 | 6383 | 0 |
| C | 0 | 6683 | 0 |
| D | 0 | 7242 | 0 |
| Quadrant | Total seconds | Saturated seconds | Saturation percentage |
|---|---|---|---|
| A | 3144 | 2 | 0.063613% |
| B | 3145 | 7 | 0.222576% |
| C | 3145 | 12 | 0.381558% |
| D | 3145 | 31 | 0.985692% |
Noise dominated data is calculated using 1-second bins in cleaned event files. If a bin has >2000 counts, and if more than 50% of those come from <1% of pixels, then it is considered to be noise-dominated and hence unusable.
| Quadrant | # 1 sec bins | Bins with >0 counts | Bins with >2000 counts | High rate bins dominated by noise | Noise dominated (total time) | Noise dominated (detector-on time) | Marked lightcurve |
|---|---|---|---|---|---|---|---|
| A | 3144 | 3144 | 0 | 0 | 0.00% | 0.00% | 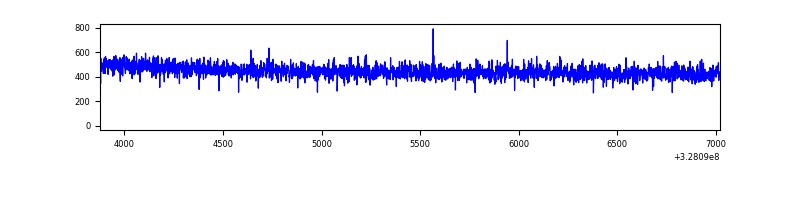 |
| B | 3145 | 3145 | 3 | 3 | 0.10% | 0.10% | 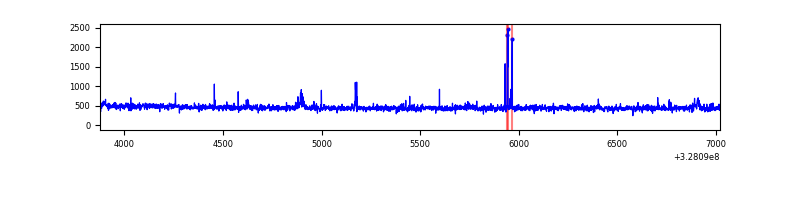 |
| C | 3145 | 3145 | 0 | 0 | 0.00% | 0.00% | 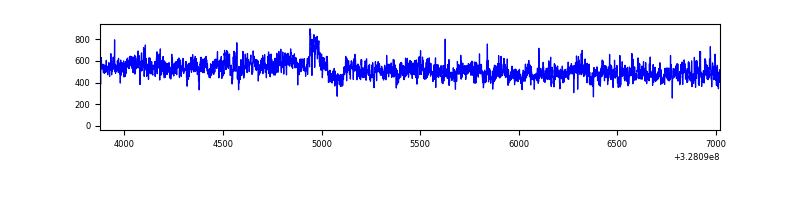 |
| D | 3145 | 3145 | 35 | 35 | 1.11% | 1.11% | 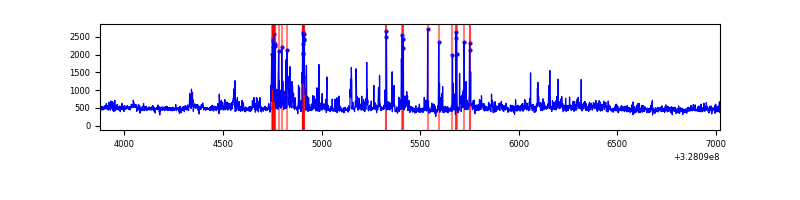 |
Top three noisy pixels from each quadrant. If the there are fewer than three noisy pixels in the level2.evt file, extra rows are filled as -1
| Pixel properties | Quadrant properties | ||||||
|---|---|---|---|---|---|---|---|
| Quadrant | DetID | PixID | Counts | Sigma | Mean | Median | Sigma |
| A | 13 | 254 | 5381 | 68.08 | 360 | 354 | 73.8 |
| A | 3 | 137 | 3333 | 40.34 | 360 | 354 | 73.8 |
| A | 0 | 226 | 3141 | 37.74 | 360 | 354 | 73.8 |
| B | 3 | 64 | 24877 | 355.98 | 355 | 348 | 68.9 |
| B | 0 | 190 | 12474 | 175.98 | 355 | 348 | 68.9 |
| B | 0 | 189 | 9247 | 129.15 | 355 | 348 | 68.9 |
| C | 7 | 247 | 247555 | 3091.85 | 338 | 339 | 80.0 |
| C | 14 | 238 | 54505 | 677.44 | 338 | 339 | 80.0 |
| C | 13 | 61 | 2347 | 25.11 | 338 | 339 | 80.0 |
| D | 12 | 233 | 242673 | 2873.35 | 344 | 333 | 84.3 |
| D | 8 | 195 | 102352 | 1209.61 | 344 | 333 | 84.3 |
| D | 1 | 52 | 61080 | 720.26 | 344 | 333 | 84.3 |
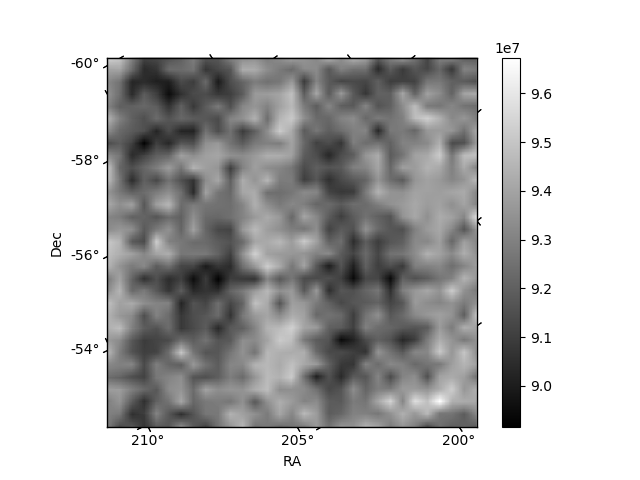
Histogram calculated using DETX and DETY for each event in the final _common_clean file
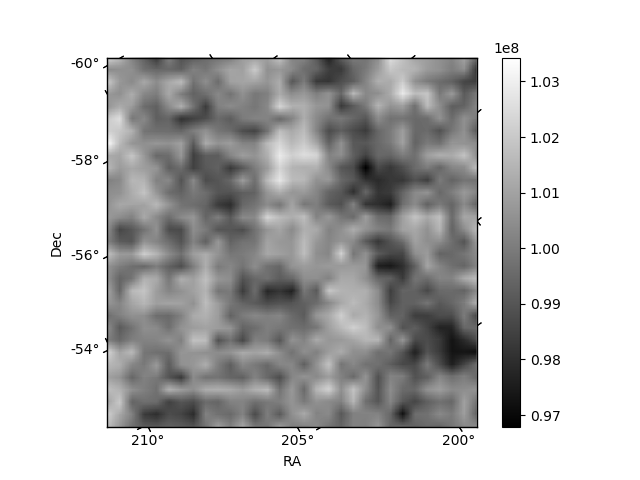
| Quadrant A |  |
 |
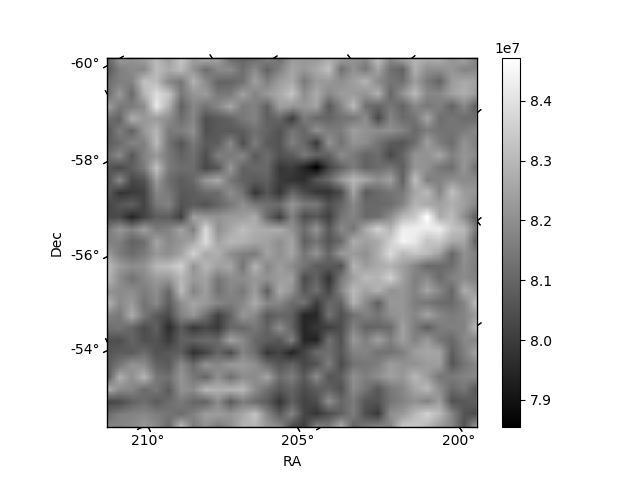
Quadrant B |
|---|---|---|---|
| Quadrant D |  |
 |
Quadrant C |
| Plot type | Count rate plots | Images |
|---|---|---|
| Comparison with Poisson distribution Blue bars denote a histogram of data divided into 1 sec bins. Red curve is a Poisson curve with rate = median count rate of data. |
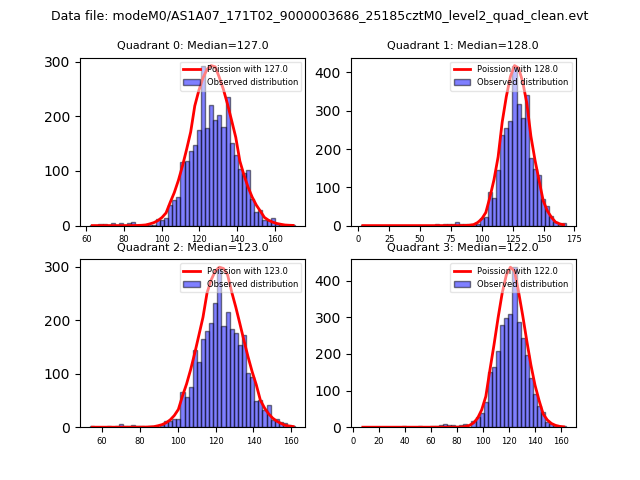 |
 |
| Quadrant-wise count rates Data is divided into 100 sec bins |
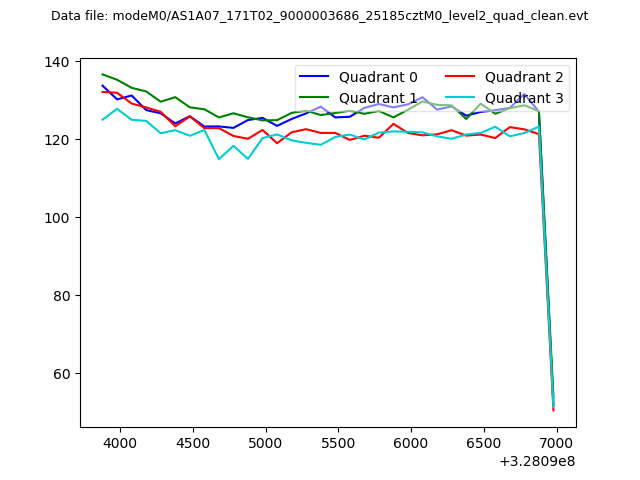 |
|
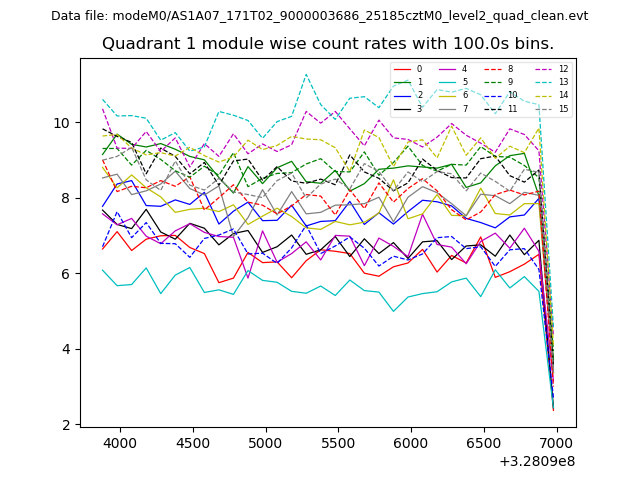
| Module-wise count rates for Quadrant A Data is divided into 100 sec bins |
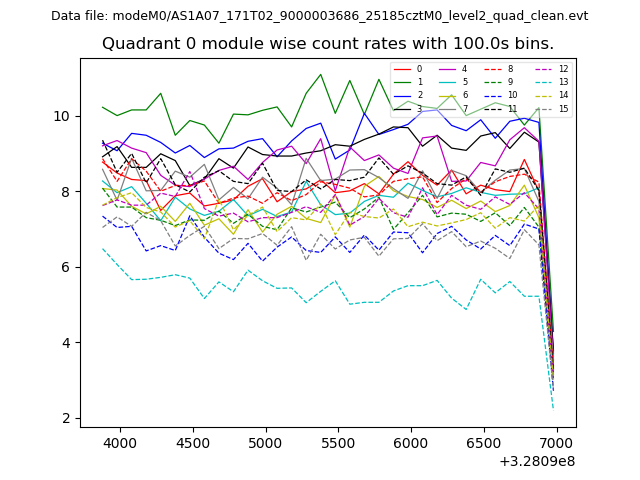 |
 |
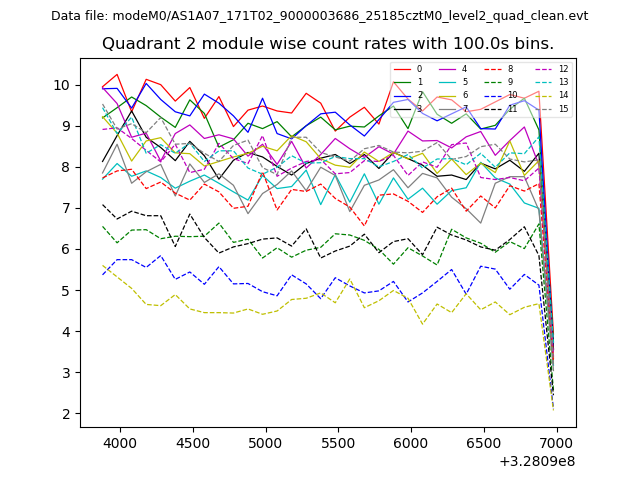
| Module-wise count rates for Quadrant B Data is divided into 100 sec bins |
 |
 |
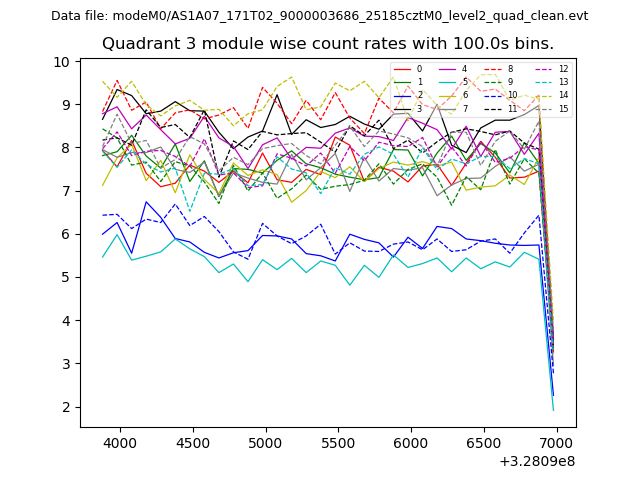
| Module-wise count rates for Quadrant C Data is divided into 100 sec bins |
 |
 |
| Module-wise count rates for Quadrant D Data is divided into 100 sec bins |
 |
 |
| Parameter | Plot |
|---|---|
| CZT HV Monitor | 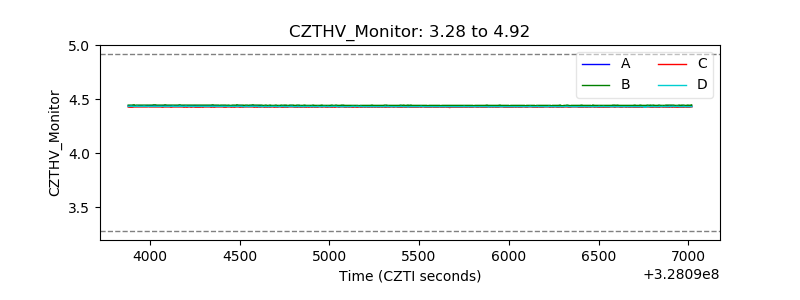 |
| D_VDD | 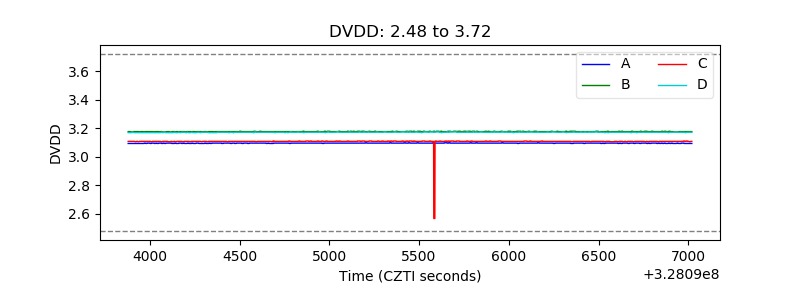 |
| Temperature 1 | 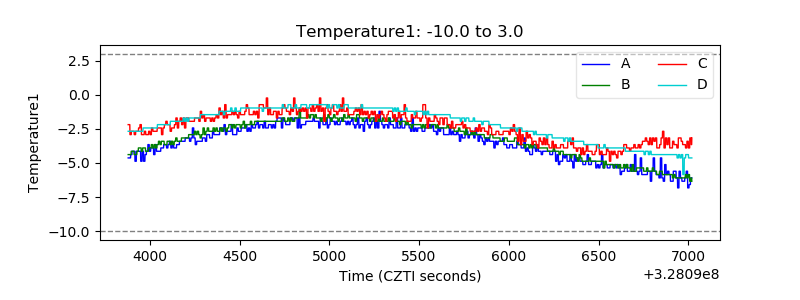 |
| Veto HV Monitor | 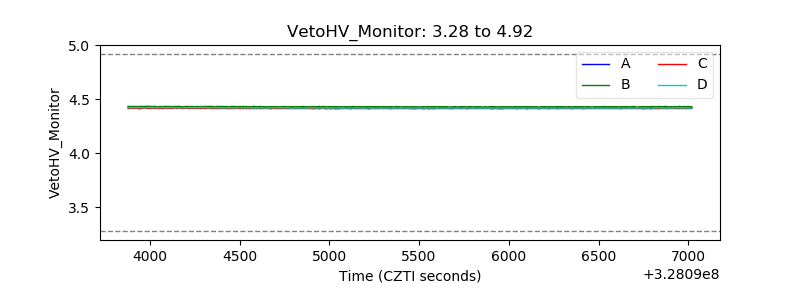 |
| Veto LLD | 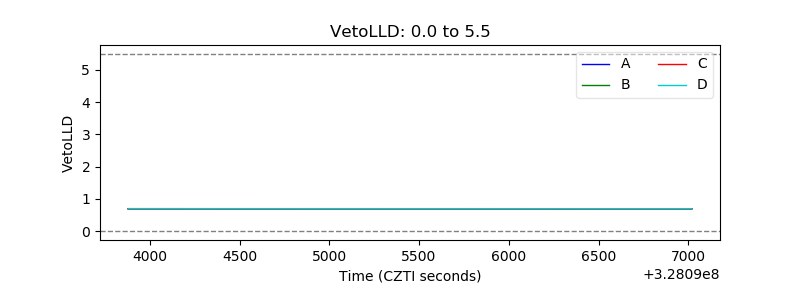 |
| Alpha Counter | 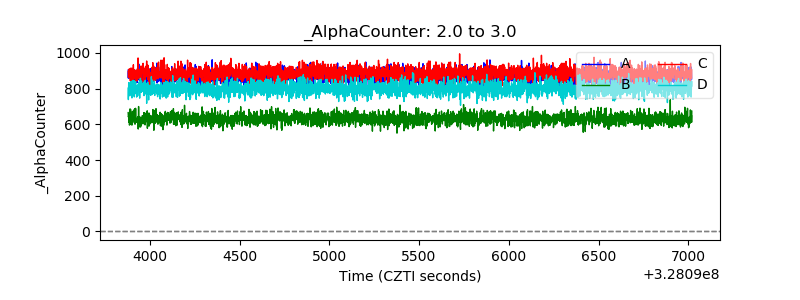 |
| _CPM_Rate | 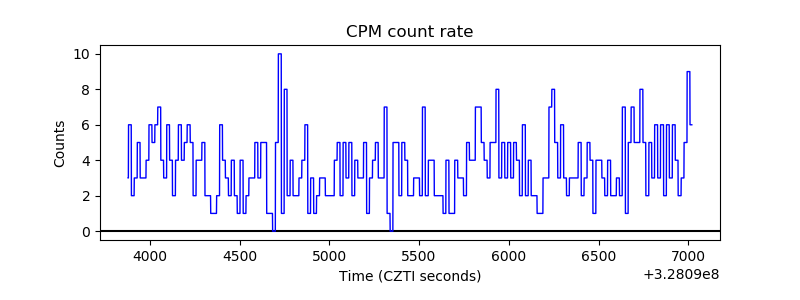 |
| CZT Counter |  |
| +2.5 Volts monitor |  |
| +5 Volts monitor | 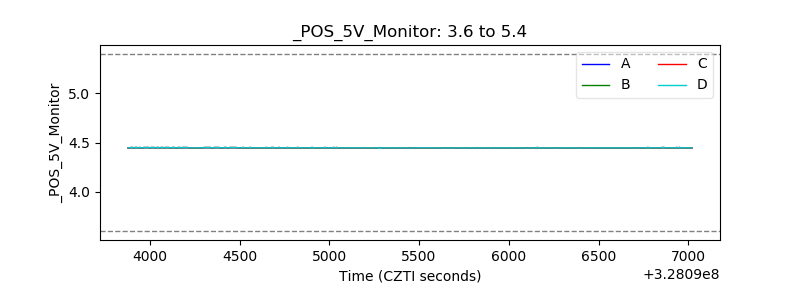 |
| _ROLL_ROT |  |
| _Roll_DEC |  |
| _Roll_RA |  |
| Veto Counter | 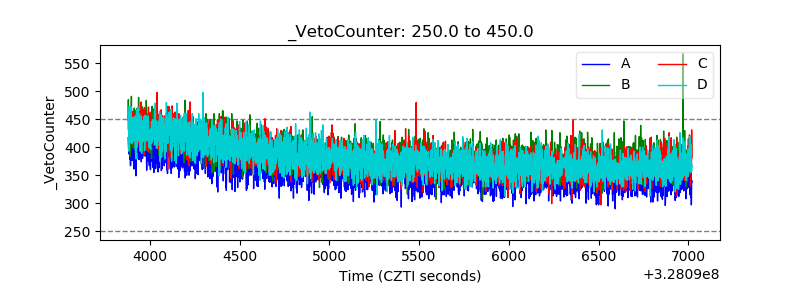 |