| Param | Original file | Final file |
|---|---|---|
| Filename | modeM0/AS1A07_027T01_9000003690_25184cztM0_level2.evt | modeM0/AS1A07_027T01_9000003690_25184cztM0_level2_quad_clean.evt |
| Size (bytes) | 395,392,320 | 78,523,200 |
| Size | 377.1 MB | 74.9 MB |
| Events in quadrant A | 2,808,126 | 511,016 |
| Events in quadrant B | 2,871,540 | 515,784 |
| Events in quadrant C | 2,858,775 | 485,876 |
| Events in quadrant D | 3,062,699 | 480,904 |
| Mode M9 | |||
|---|---|---|---|
| Quadrant | BADHDUFLAG | Total packets | Discarded packets |
| A | 0 | 12 | 0 |
| B | 0 | 12 | 0 |
| C | 0 | 12 | 0 |
| D | 0 | 12 | 0 |
| Mode M0 | |||
|---|---|---|---|
| Quadrant | BADHDUFLAG | Total packets | Discarded packets |
| A | 0 | 11787 | 0 |
| B | 0 | 11930 | 0 |
| C | 0 | 11825 | 0 |
| D | 0 | 12694 | 0 |
| Quadrant | Total seconds | Saturated seconds | Saturation percentage |
|---|---|---|---|
| A | 5489 | 51 | 0.929131% |
| B | 5489 | 61 | 1.111314% |
| C | 5489 | 58 | 1.056659% |
| D | 5489 | 46 | 0.838040% |
Noise dominated data is calculated using 1-second bins in cleaned event files. If a bin has >2000 counts, and if more than 50% of those come from <1% of pixels, then it is considered to be noise-dominated and hence unusable.
| Quadrant | # 1 sec bins | Bins with >0 counts | Bins with >2000 counts | High rate bins dominated by noise | Noise dominated (total time) | Noise dominated (detector-on time) | Marked lightcurve |
|---|---|---|---|---|---|---|---|
| A | 6694 | 5490 | 0 | 0 | 0.00% | 0.00% | 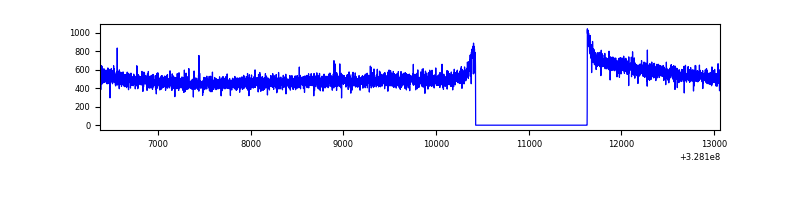 |
| B | 6694 | 5490 | 6 | 6 | 0.09% | 0.11% | 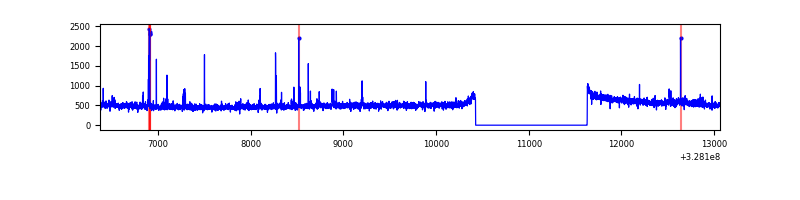 |
| C | 6694 | 5490 | 0 | 0 | 0.00% | 0.00% | 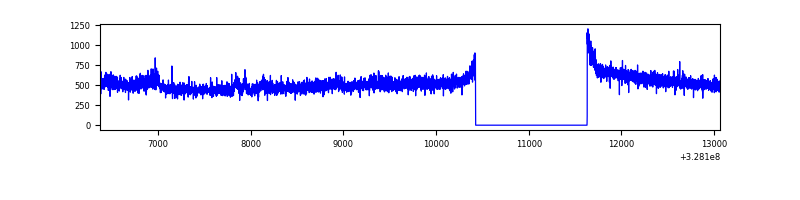 |
| D | 6694 | 5490 | 11 | 11 | 0.16% | 0.20% | 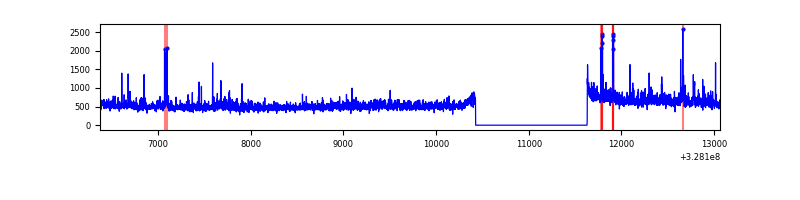 |
Top three noisy pixels from each quadrant. If the there are fewer than three noisy pixels in the level2.evt file, extra rows are filled as -1
| Pixel properties | Quadrant properties | ||||||
|---|---|---|---|---|---|---|---|
| Quadrant | DetID | PixID | Counts | Sigma | Mean | Median | Sigma |
| A | 13 | 254 | 7990 | 50.86 | 728 | 716 | 143.0 |
| A | 0 | 226 | 6249 | 38.68 | 728 | 716 | 143.0 |
| A | 3 | 137 | 6213 | 38.43 | 728 | 716 | 143.0 |
| B | 3 | 64 | 30786 | 225.67 | 714 | 699 | 133.3 |
| B | 10 | 251 | 20567 | 149.02 | 714 | 699 | 133.3 |
| B | 0 | 190 | 17545 | 126.35 | 714 | 699 | 133.3 |
| C | 14 | 238 | 110803 | 693.3 | 684 | 689 | 158.8 |
| C | 8 | 208 | 43987 | 272.61 | 684 | 689 | 158.8 |
| C | 7 | 247 | 24374 | 149.13 | 684 | 689 | 158.8 |
| D | 8 | 195 | 251858 | 1469.34 | 703 | 683 | 170.9 |
| D | 12 | 233 | 84054 | 487.71 | 703 | 683 | 170.9 |
| D | 1 | 52 | 31417 | 179.79 | 703 | 683 | 170.9 |
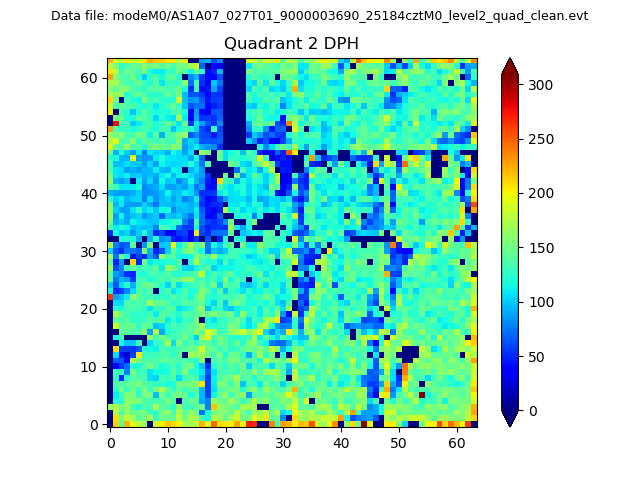
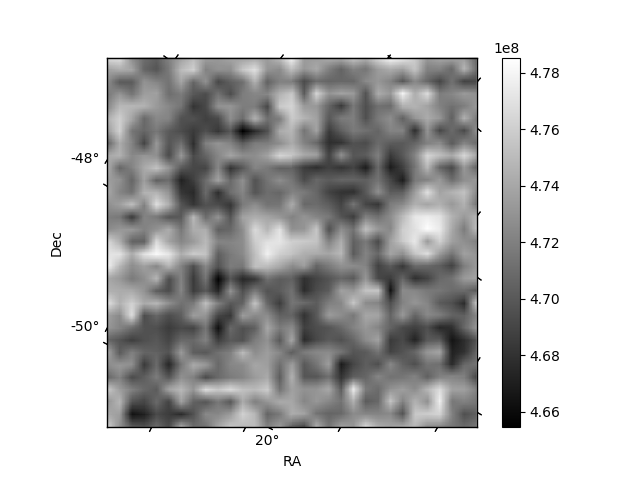
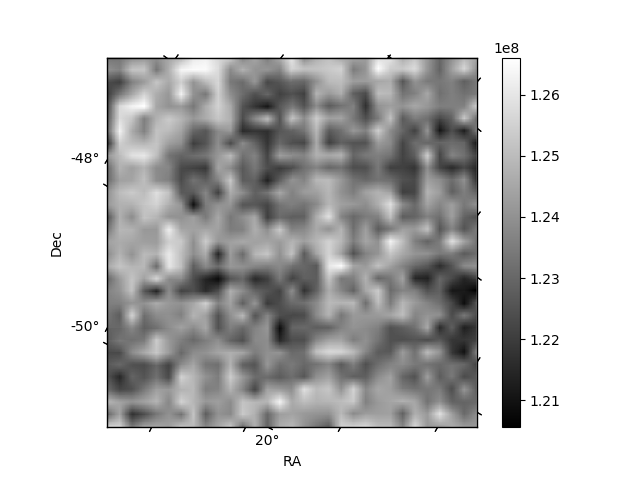
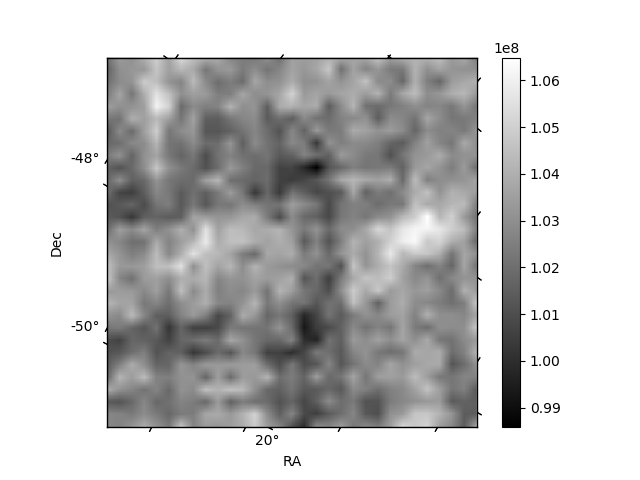
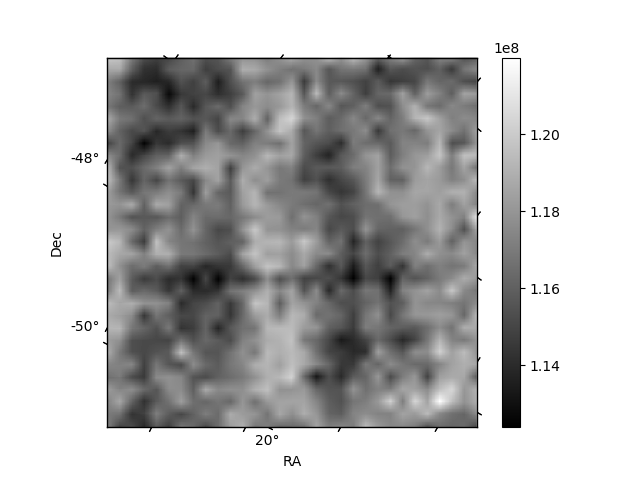
Histogram calculated using DETX and DETY for each event in the final _common_clean file
| Quadrant A | 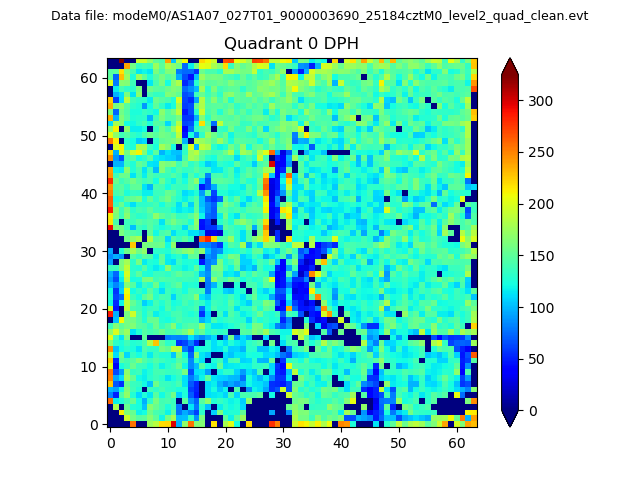 |
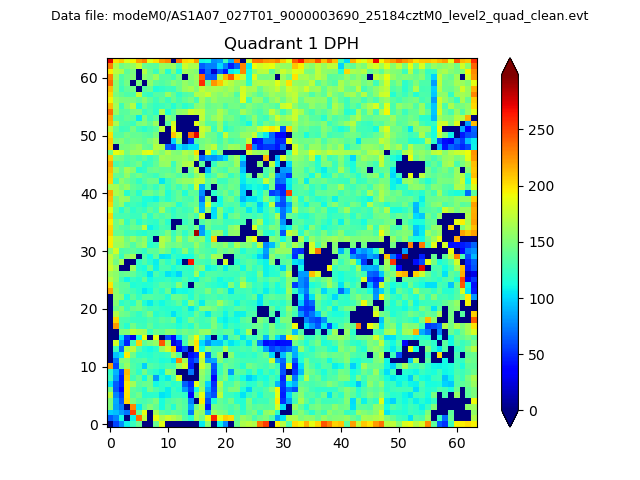 |
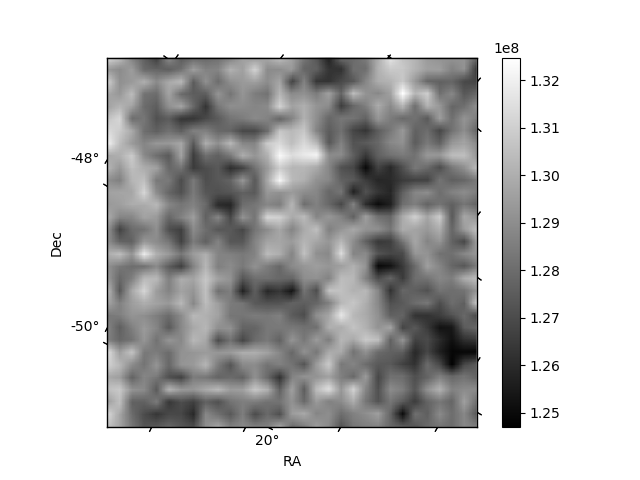
Quadrant B |
|---|---|---|---|
| Quadrant D | 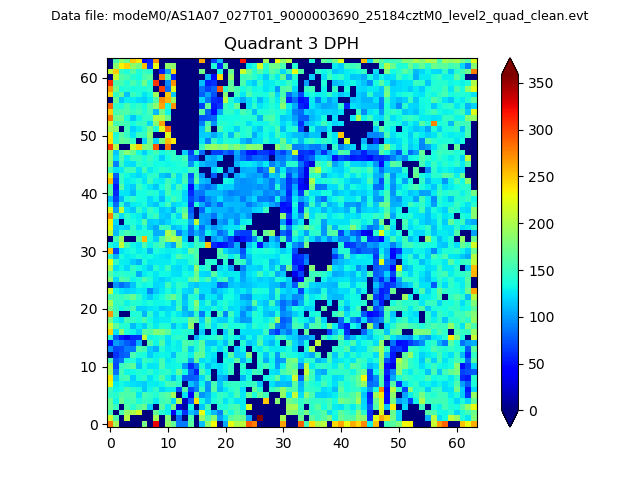 |
 |
Quadrant C |
| Plot type | Count rate plots | Images |
|---|---|---|
| Comparison with Poisson distribution Blue bars denote a histogram of data divided into 1 sec bins. Red curve is a Poisson curve with rate = median count rate of data. |
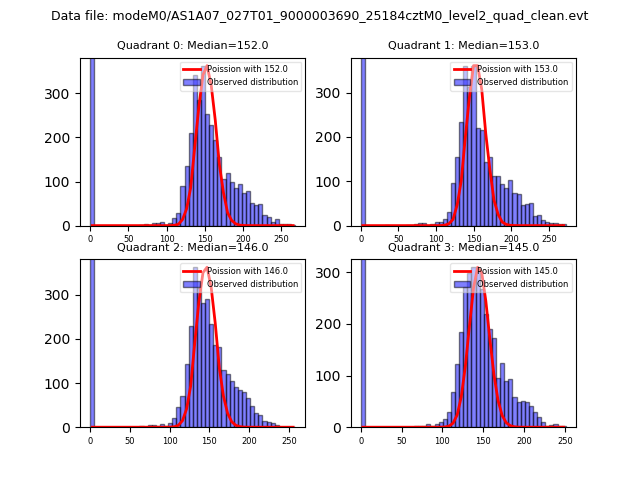 |
 |
| Quadrant-wise count rates Data is divided into 100 sec bins |
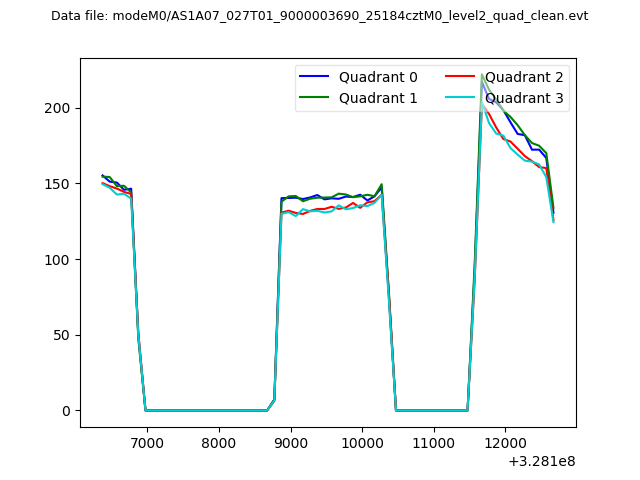 |
|
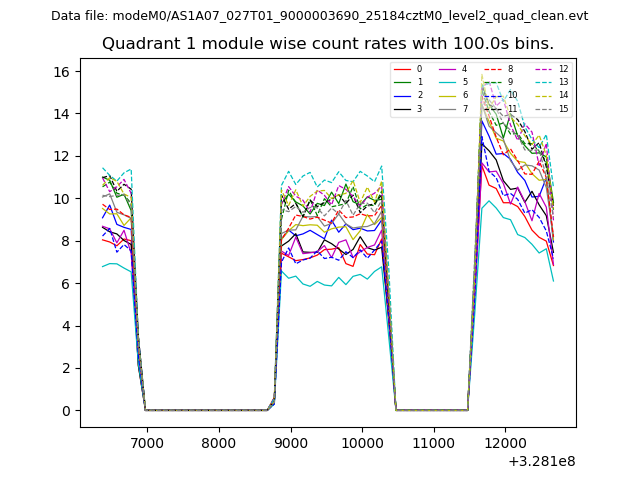
| Module-wise count rates for Quadrant A Data is divided into 100 sec bins |
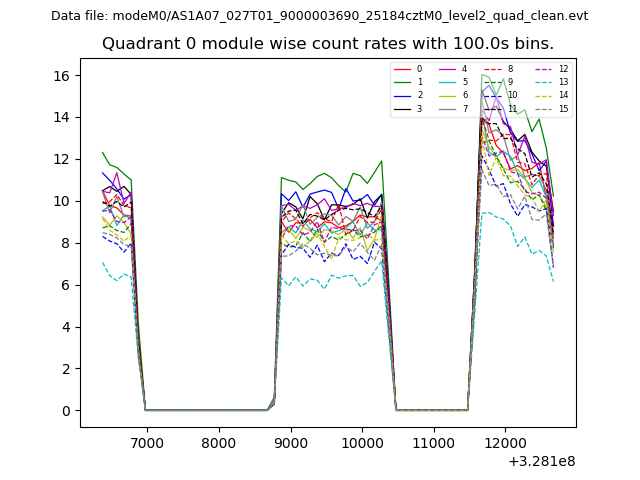 |
 |
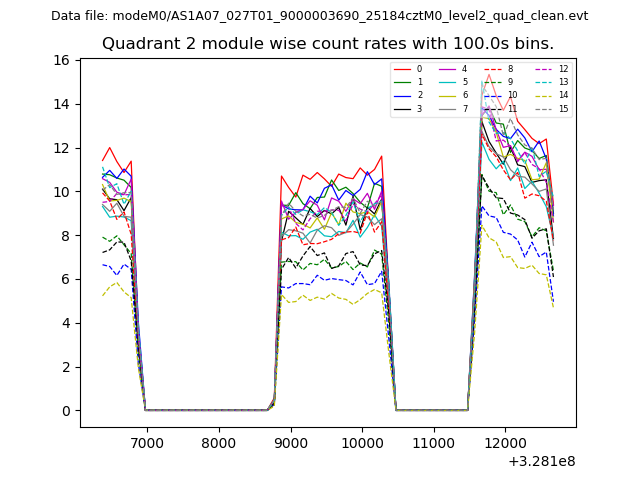
| Module-wise count rates for Quadrant B Data is divided into 100 sec bins |
 |
 |
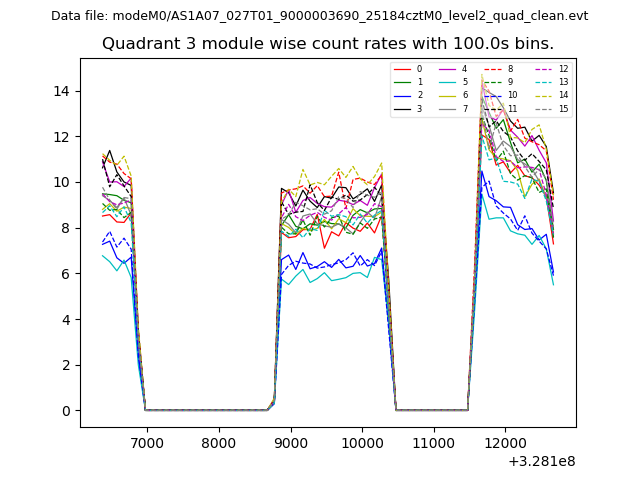
| Module-wise count rates for Quadrant C Data is divided into 100 sec bins |
 |
 |
| Module-wise count rates for Quadrant D Data is divided into 100 sec bins |
 |
 |
| Parameter | Plot |
|---|---|
| CZT HV Monitor | 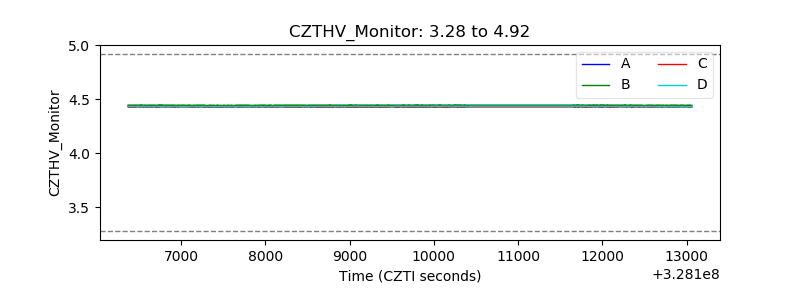 |
| D_VDD | 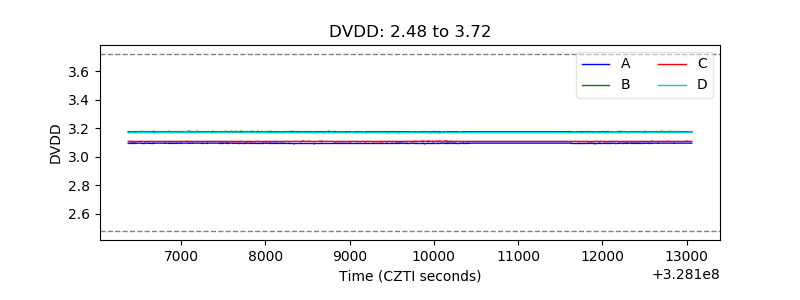 |
| Temperature 1 | 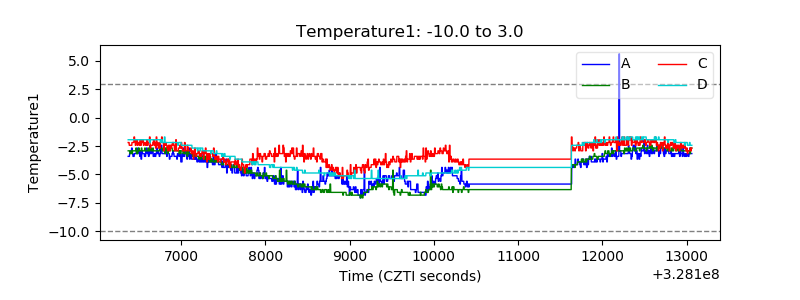 |
| Veto HV Monitor | 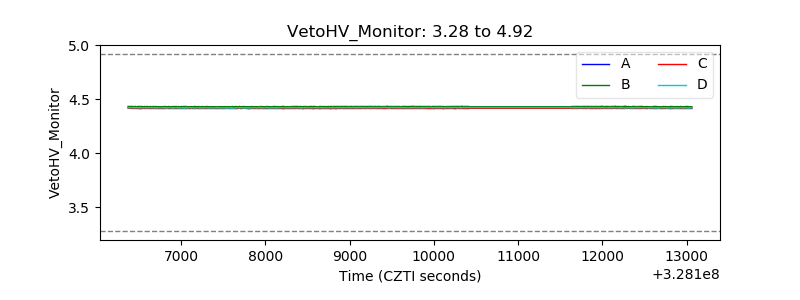 |
| Veto LLD | 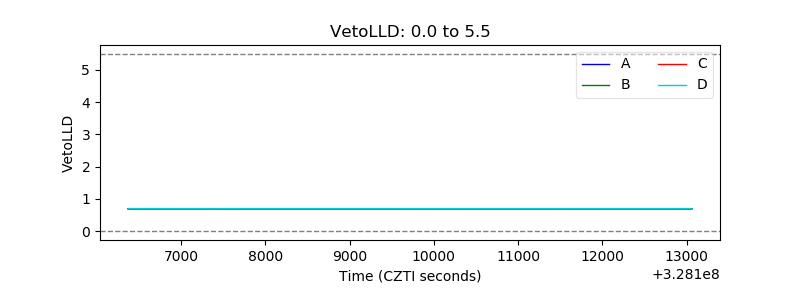 |
| Alpha Counter | 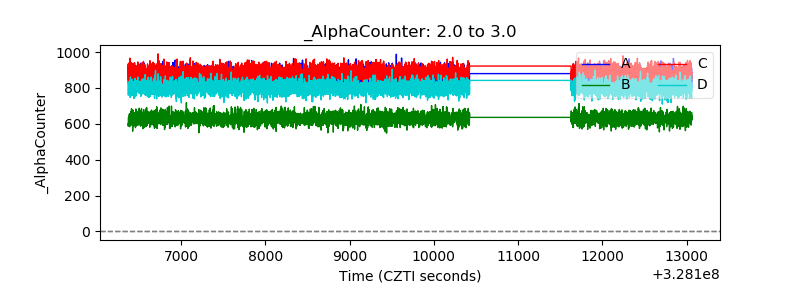 |
| _CPM_Rate | 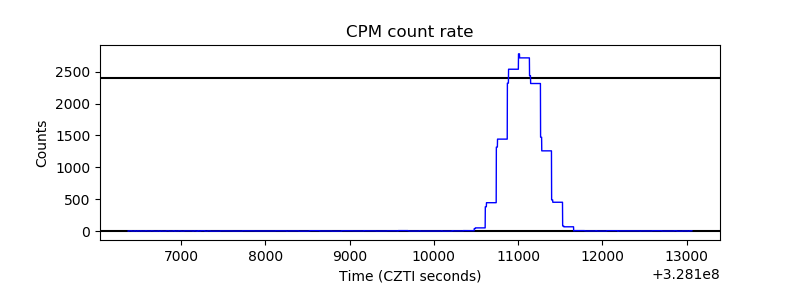 |
| CZT Counter | 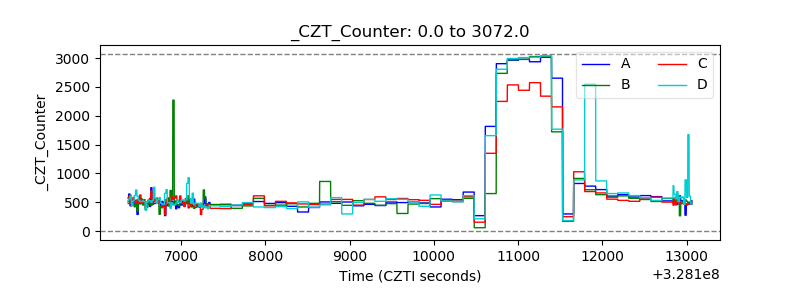 |
| +2.5 Volts monitor |  |
| +5 Volts monitor |  |
| _ROLL_ROT | 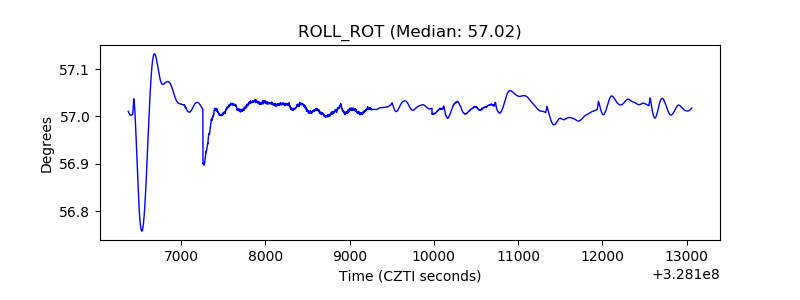 |
| _Roll_DEC | 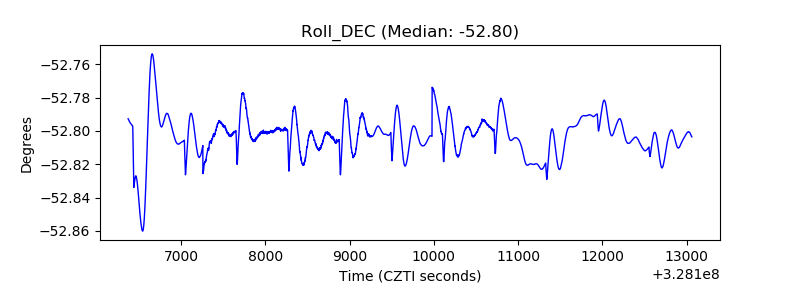 |
| _Roll_RA | 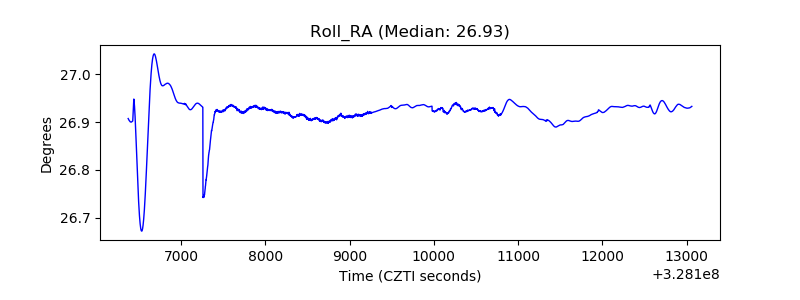 |
| Veto Counter | 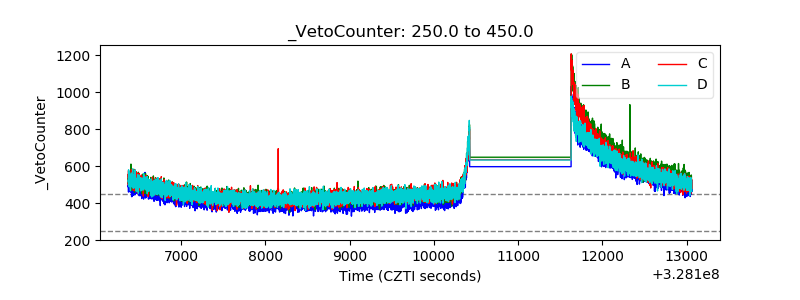 |