| Param | Original file | Final file |
|---|---|---|
| Filename | modeM0/AS1A07_027T01_9000003690_25185cztM0_level2.evt | modeM0/AS1A07_027T01_9000003690_25185cztM0_level2_quad_clean.evt |
| Size (bytes) | 791,006,400 | 143,352,000 |
| Size | 754.4 MB | 136.7 MB |
| Events in quadrant A | 5,457,816 | 930,761 |
| Events in quadrant B | 5,615,995 | 943,831 |
| Events in quadrant C | 5,580,699 | 884,878 |
| Events in quadrant D | 6,589,987 | 854,219 |
| Mode M9 | |||
|---|---|---|---|
| Quadrant | BADHDUFLAG | Total packets | Discarded packets |
| A | 0 | 24 | 0 |
| B | 0 | 24 | 0 |
| C | 0 | 24 | 0 |
| D | 0 | 24 | 0 |
| Mode M0 | |||
|---|---|---|---|
| Quadrant | BADHDUFLAG | Total packets | Discarded packets |
| A | 0 | 22680 | 0 |
| B | 0 | 23162 | 0 |
| C | 0 | 22960 | 0 |
| D | 0 | 26321 | 0 |
| Quadrant | Total seconds | Saturated seconds | Saturation percentage |
|---|---|---|---|
| A | 10504 | 118 | 1.123382% |
| B | 10504 | 138 | 1.313785% |
| C | 10504 | 133 | 1.266184% |
| D | 10504 | 332 | 3.160701% |
Noise dominated data is calculated using 1-second bins in cleaned event files. If a bin has >2000 counts, and if more than 50% of those come from <1% of pixels, then it is considered to be noise-dominated and hence unusable.
| Quadrant | # 1 sec bins | Bins with >0 counts | Bins with >2000 counts | High rate bins dominated by noise | Noise dominated (total time) | Noise dominated (detector-on time) | Marked lightcurve |
|---|---|---|---|---|---|---|---|
| A | 12984 | 10506 | 0 | 0 | 0.00% | 0.00% | 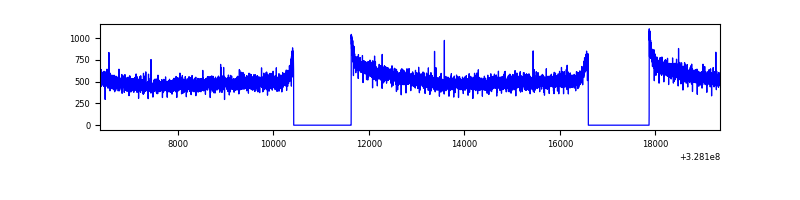 |
| B | 12984 | 10506 | 7 | 7 | 0.05% | 0.07% | 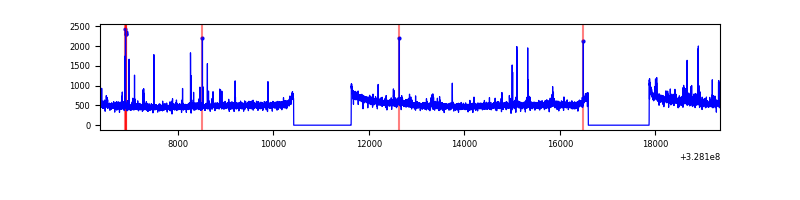 |
| C | 12984 | 10506 | 0 | 0 | 0.00% | 0.00% | 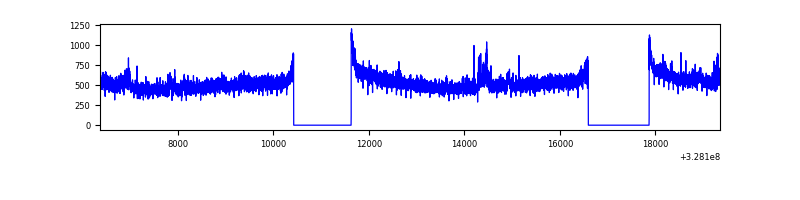 |
| D | 12984 | 10506 | 180 | 180 | 1.39% | 1.71% | 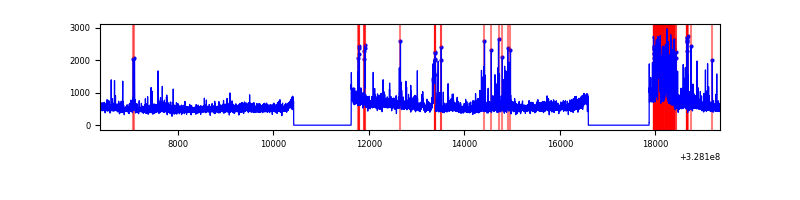 |
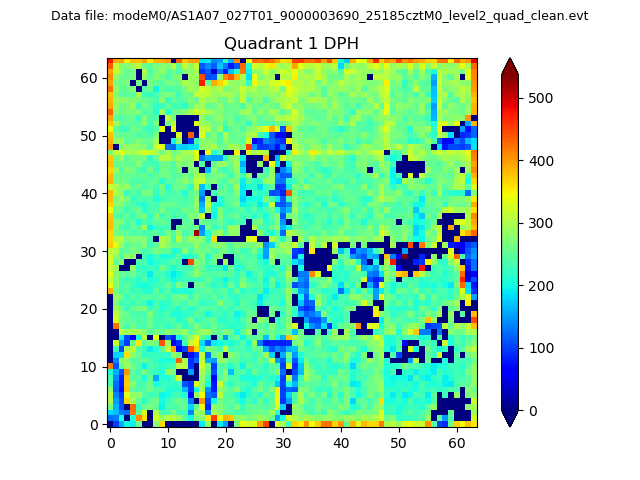
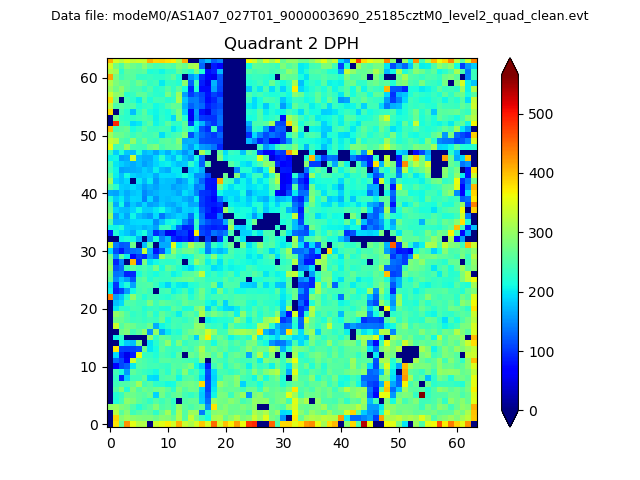
Top three noisy pixels from each quadrant. If the there are fewer than three noisy pixels in the level2.evt file, extra rows are filled as -1
| Pixel properties | Quadrant properties | ||||||
|---|---|---|---|---|---|---|---|
| Quadrant | DetID | PixID | Counts | Sigma | Mean | Median | Sigma |
| A | 13 | 254 | 15968 | 52.86 | 1415 | 1394 | 275.7 |
| A | 0 | 226 | 12352 | 39.75 | 1415 | 1394 | 275.7 |
| A | 3 | 137 | 12240 | 39.34 | 1415 | 1394 | 275.7 |
| B | 3 | 64 | 67876 | 260.44 | 1389 | 1359 | 255.4 |
| B | 0 | 190 | 46617 | 177.2 | 1389 | 1359 | 255.4 |
| B | 12 | 111 | 30678 | 114.8 | 1389 | 1359 | 255.4 |
| C | 14 | 238 | 217245 | 710.25 | 1326 | 1338 | 304.0 |
| C | 7 | 247 | 113483 | 368.91 | 1326 | 1338 | 304.0 |
| C | 8 | 208 | 68394 | 220.59 | 1326 | 1338 | 304.0 |
| D | 8 | 195 | 483193 | 1497.47 | 1344 | 1309 | 321.8 |
| D | 1 | 52 | 452223 | 1401.23 | 1344 | 1309 | 321.8 |
| D | 1 | 255 | 277968 | 859.72 | 1344 | 1309 | 321.8 |
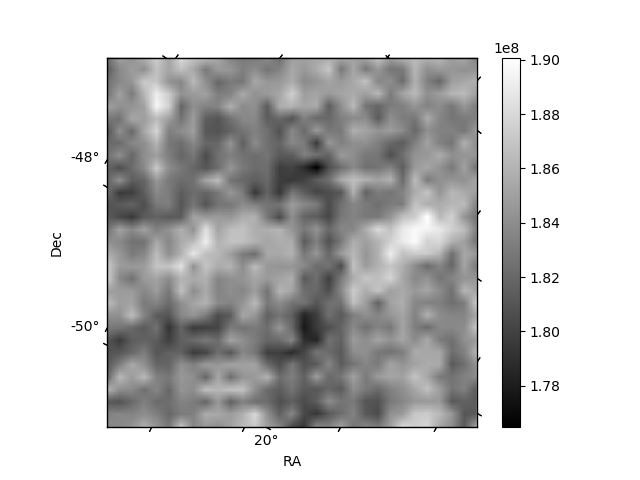
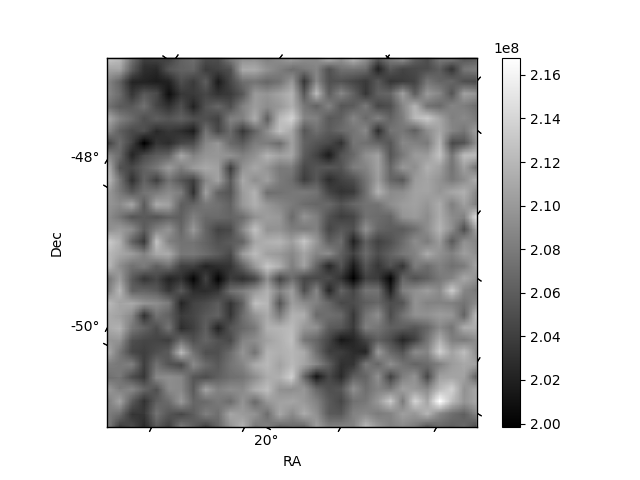
Histogram calculated using DETX and DETY for each event in the final _common_clean file
| Quadrant A | 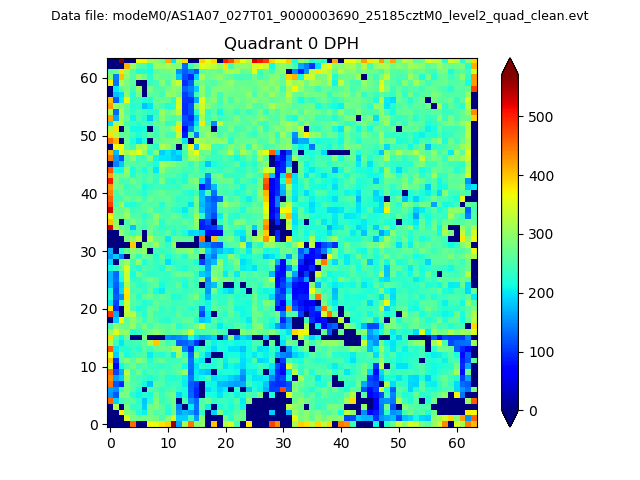 |
 |
Quadrant B |
|---|---|---|---|
| Quadrant D | 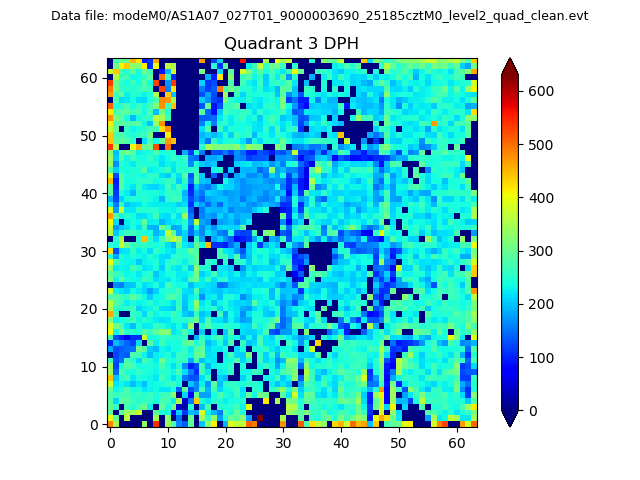 |
 |
Quadrant C |
| Plot type | Count rate plots | Images |
|---|---|---|
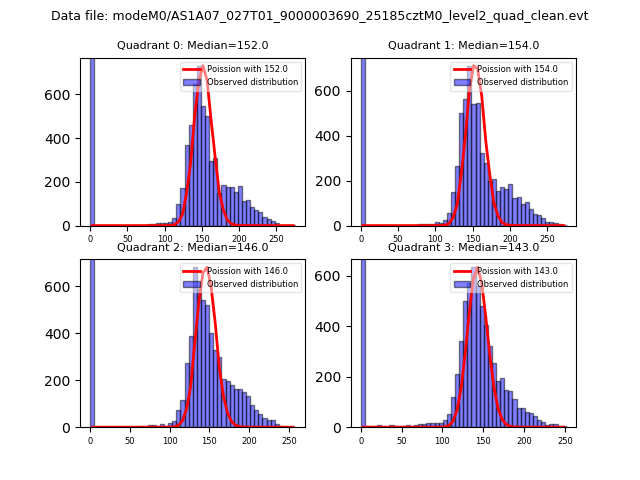
| Comparison with Poisson distribution Blue bars denote a histogram of data divided into 1 sec bins. Red curve is a Poisson curve with rate = median count rate of data. |
 |
 |
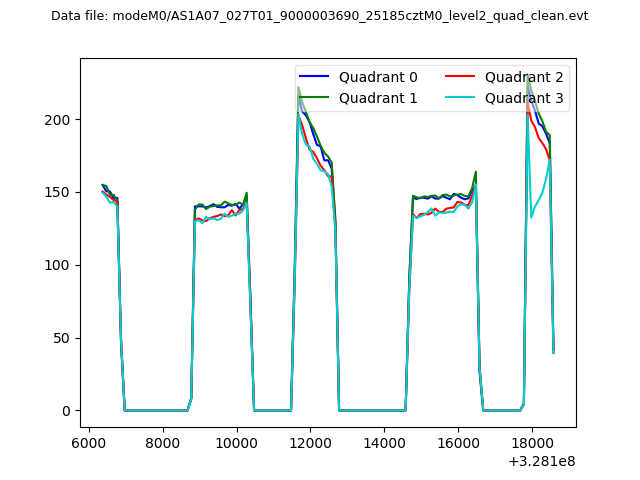
| Quadrant-wise count rates Data is divided into 100 sec bins |
 |
|
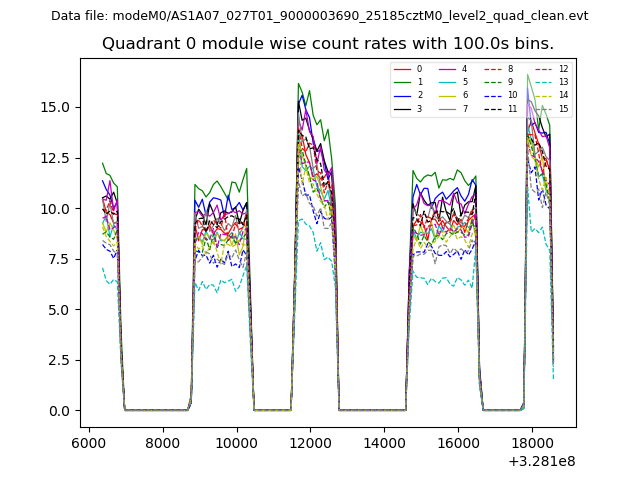
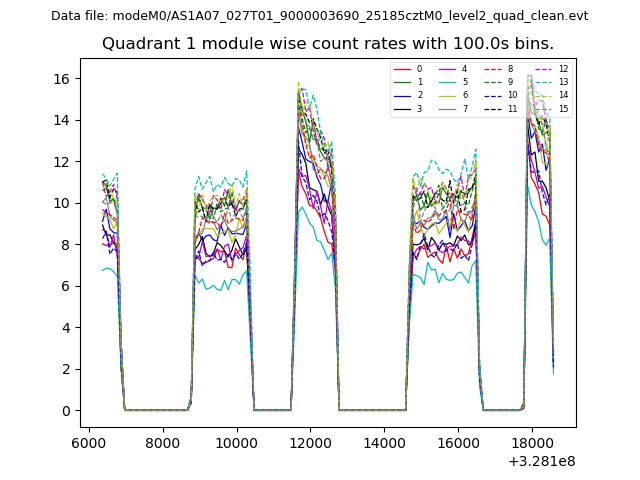
| Module-wise count rates for Quadrant A Data is divided into 100 sec bins |
 |
 |
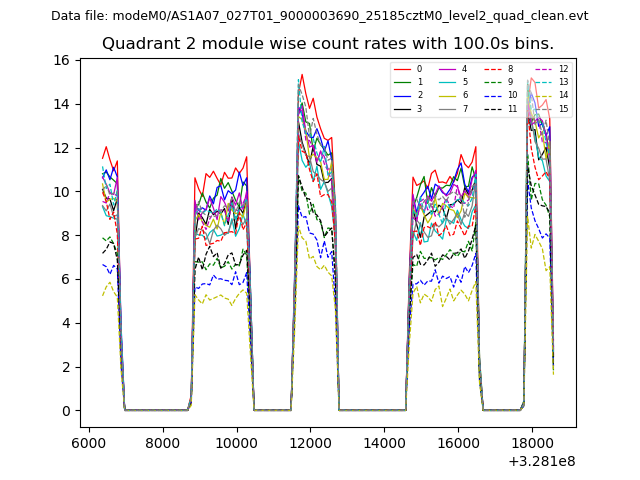
| Module-wise count rates for Quadrant B Data is divided into 100 sec bins |
 |
 |
| Module-wise count rates for Quadrant C Data is divided into 100 sec bins |
 |
 |
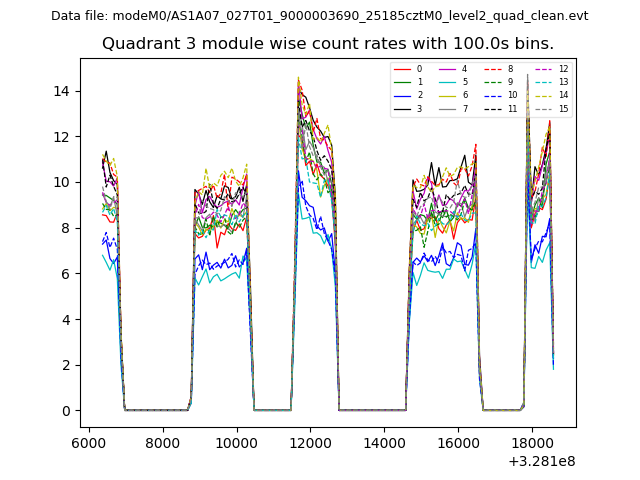
| Module-wise count rates for Quadrant D Data is divided into 100 sec bins |
 |
 |
| Parameter | Plot |
|---|---|
| CZT HV Monitor | 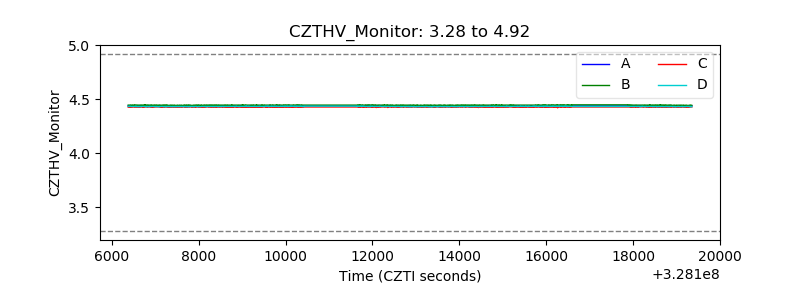 |
| D_VDD | 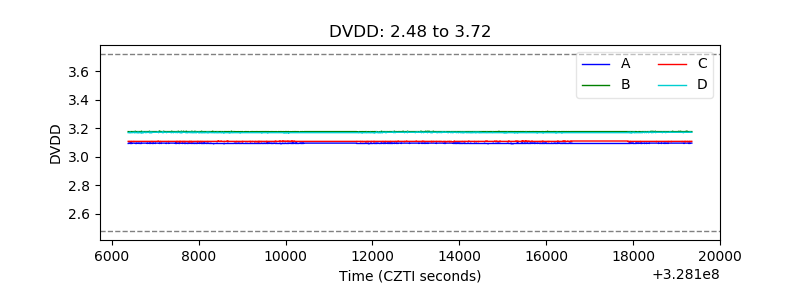 |
| Temperature 1 | 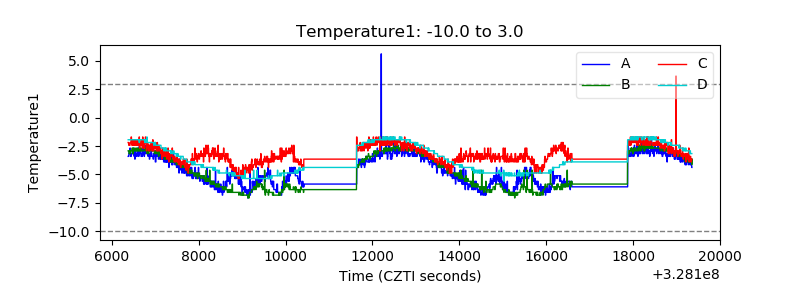 |
| Veto HV Monitor | 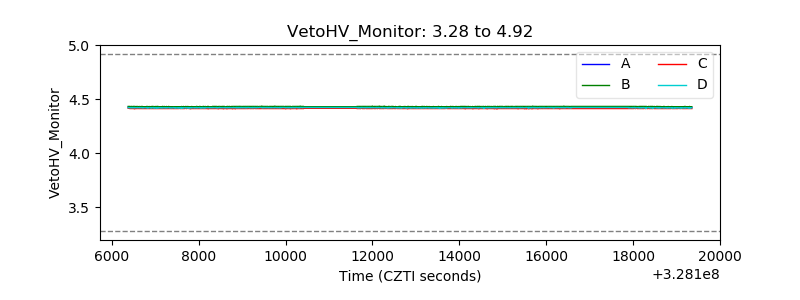 |
| Veto LLD | 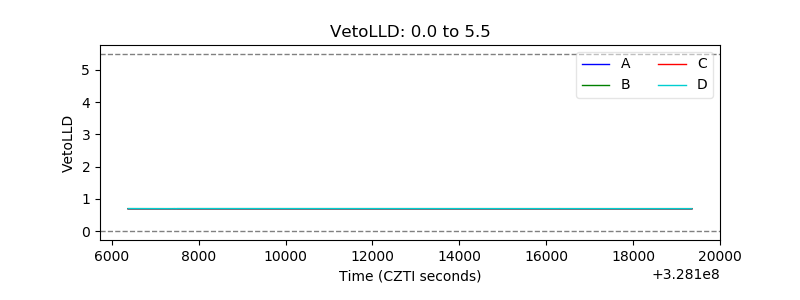 |
| Alpha Counter | 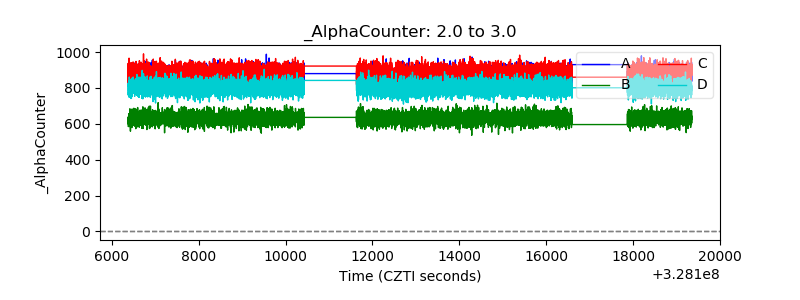 |
| _CPM_Rate | 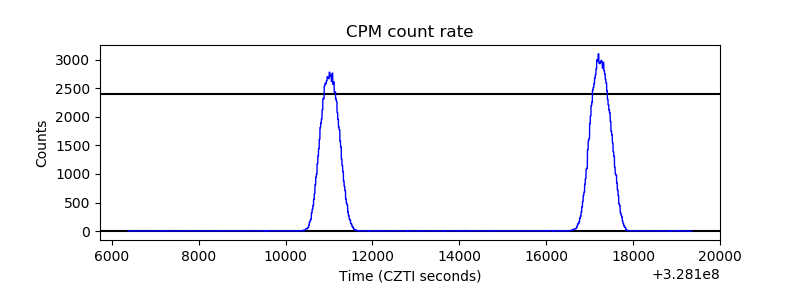 |
| CZT Counter | 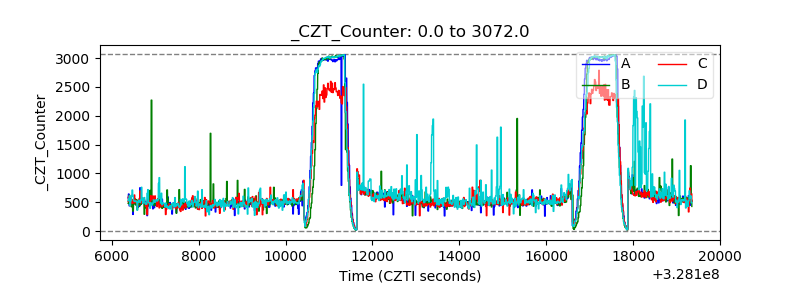 |
| +2.5 Volts monitor |  |
| +5 Volts monitor |  |
| _ROLL_ROT | 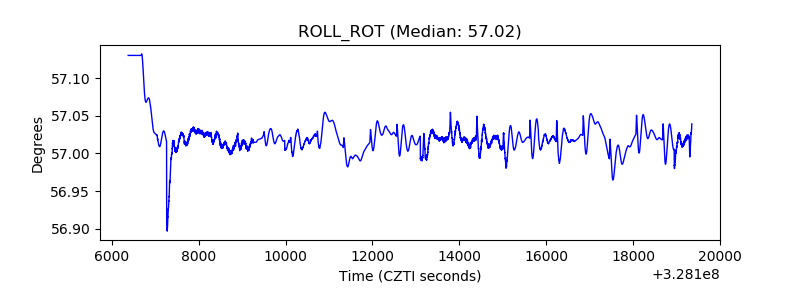 |
| _Roll_DEC | 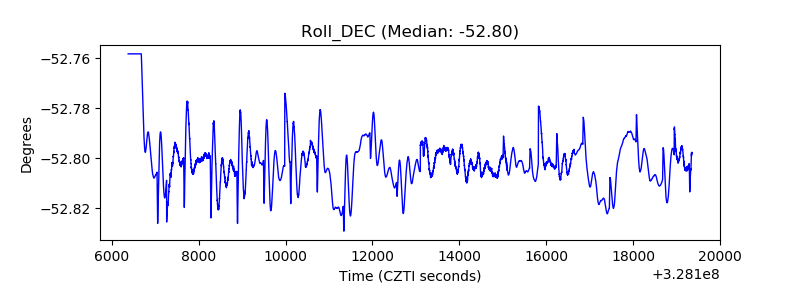 |
| _Roll_RA | 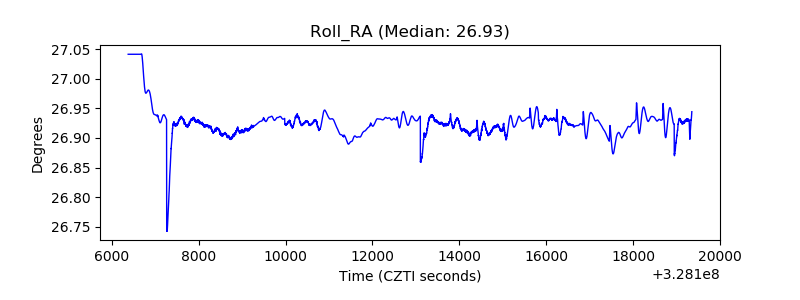 |
| Veto Counter | 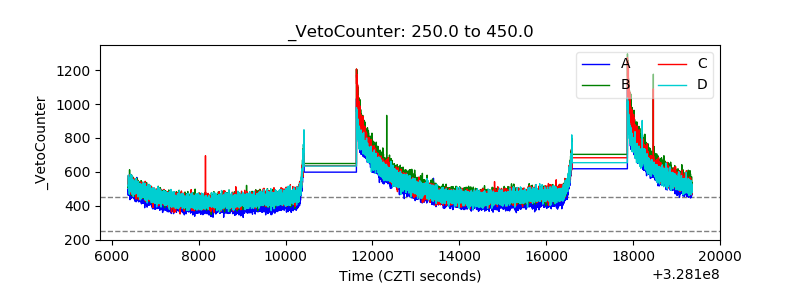 |