| Param | Original file | Final file |
|---|---|---|
| Filename | modeM0/AS1A07_027T01_9000003690_25187cztM0_level2.evt | modeM0/AS1A07_027T01_9000003690_25187cztM0_level2_quad_clean.evt |
| Size (bytes) | 514,604,160 | 72,875,520 |
| Size | 490.8 MB | 69.5 MB |
| Events in quadrant A | 3,303,225 | 455,272 |
| Events in quadrant B | 3,395,809 | 460,802 |
| Events in quadrant C | 3,455,277 | 429,557 |
| Events in quadrant D | 5,004,287 | 422,173 |
| Mode M9 | |||
|---|---|---|---|
| Quadrant | BADHDUFLAG | Total packets | Discarded packets |
| A | 0 | 18 | 0 |
| B | 0 | 19 | 0 |
| C | 0 | 19 | 0 |
| D | 0 | 19 | 0 |
| Mode M0 | |||
|---|---|---|---|
| Quadrant | BADHDUFLAG | Total packets | Discarded packets |
| A | 0 | 13484 | 0 |
| B | 0 | 13849 | 0 |
| C | 0 | 13928 | 0 |
| D | 0 | 19090 | 0 |
| Quadrant | Total seconds | Saturated seconds | Saturation percentage |
|---|---|---|---|
| A | 6293 | 47 | 0.746862% |
| B | 6293 | 74 | 1.175910% |
| C | 6293 | 88 | 1.398379% |
| D | 6293 | 394 | 6.260925% |
Noise dominated data is calculated using 1-second bins in cleaned event files. If a bin has >2000 counts, and if more than 50% of those come from <1% of pixels, then it is considered to be noise-dominated and hence unusable.
| Quadrant | # 1 sec bins | Bins with >0 counts | Bins with >2000 counts | High rate bins dominated by noise | Noise dominated (total time) | Noise dominated (detector-on time) | Marked lightcurve |
|---|---|---|---|---|---|---|---|
| A | 7608 | 6293 | 0 | 0 | 0.00% | 0.00% | 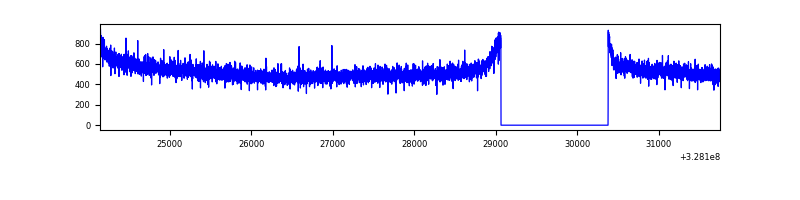 |
| B | 7608 | 6294 | 1 | 1 | 0.01% | 0.02% | 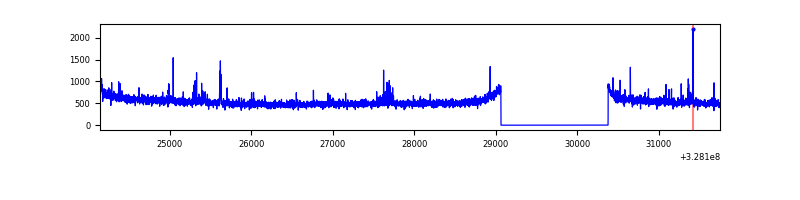 |
| C | 7608 | 6293 | 1 | 1 | 0.01% | 0.02% | 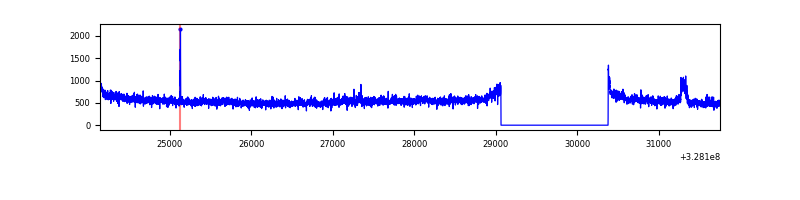 |
| D | 7608 | 6294 | 375 | 375 | 4.93% | 5.96% | 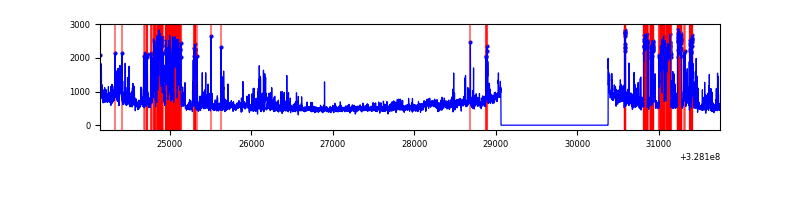 |
Top three noisy pixels from each quadrant. If the there are fewer than three noisy pixels in the level2.evt file, extra rows are filled as -1
| Pixel properties | Quadrant properties | ||||||
|---|---|---|---|---|---|---|---|
| Quadrant | DetID | PixID | Counts | Sigma | Mean | Median | Sigma |
| A | 13 | 254 | 9492 | 51.03 | 857 | 843 | 169.5 |
| A | 0 | 226 | 7480 | 39.16 | 857 | 843 | 169.5 |
| A | 3 | 137 | 7105 | 36.95 | 857 | 843 | 169.5 |
| B | 4 | 80 | 22475 | 138.74 | 847 | 828 | 156.0 |
| B | 3 | 64 | 22327 | 137.79 | 847 | 828 | 156.0 |
| B | 0 | 189 | 20701 | 127.37 | 847 | 828 | 156.0 |
| C | 7 | 247 | 133558 | 721.96 | 803 | 811 | 183.9 |
| C | 14 | 238 | 132629 | 716.91 | 803 | 811 | 183.9 |
| C | 8 | 208 | 40661 | 216.73 | 803 | 811 | 183.9 |
| D | 1 | 52 | 729681 | 3818.83 | 806 | 784 | 190.9 |
| D | 12 | 233 | 622274 | 3256.1 | 806 | 784 | 190.9 |
| D | 12 | 235 | 253630 | 1324.71 | 806 | 784 | 190.9 |
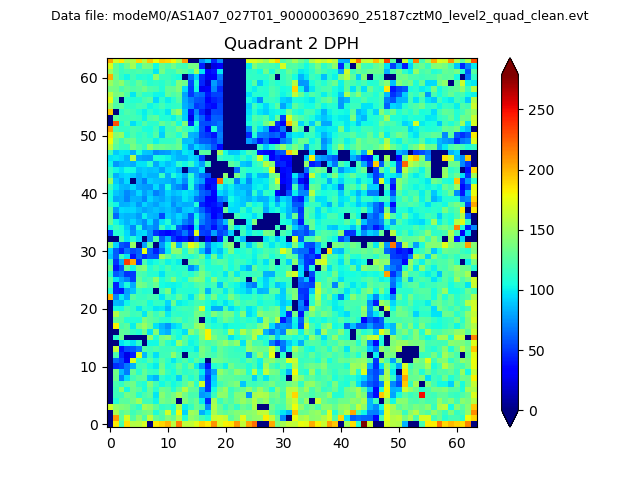
Histogram calculated using DETX and DETY for each event in the final _common_clean file
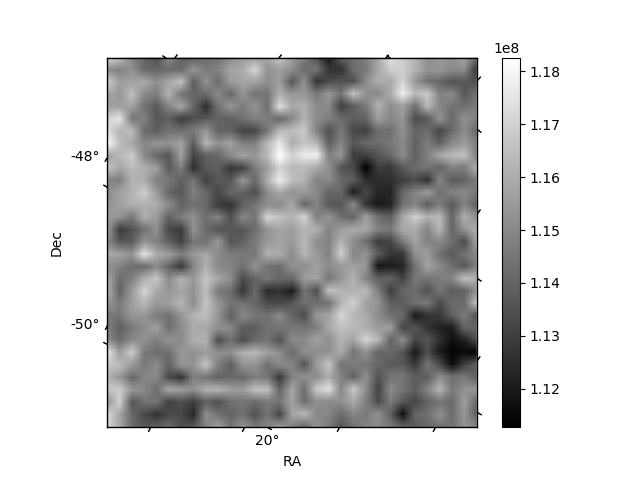
| Quadrant A | 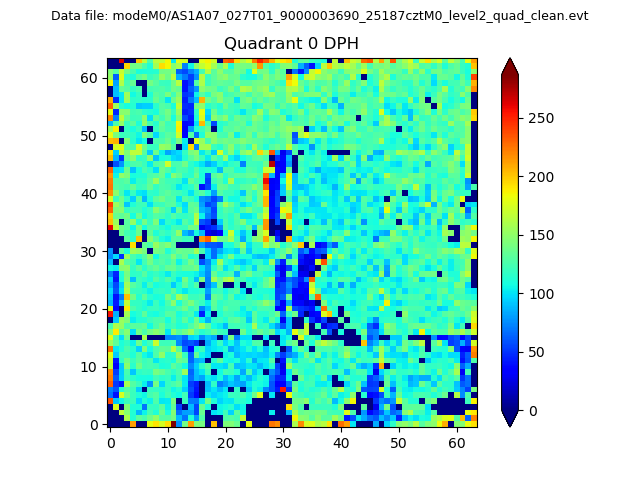 |
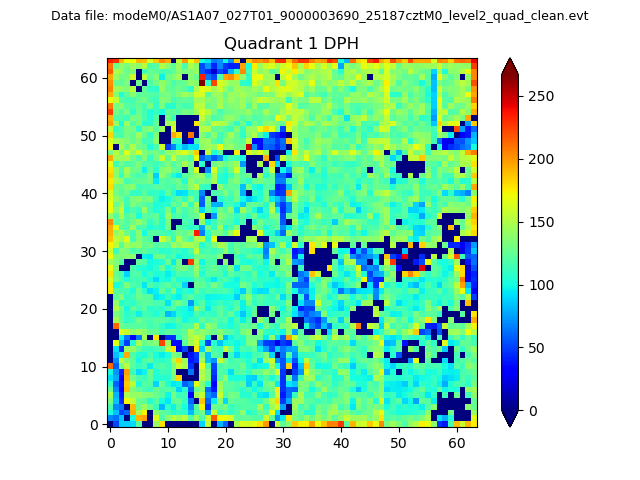 |
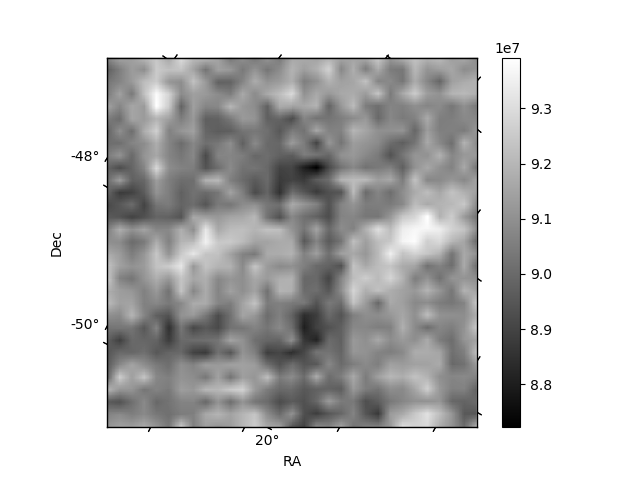
Quadrant B |
|---|---|---|---|
| Quadrant D | 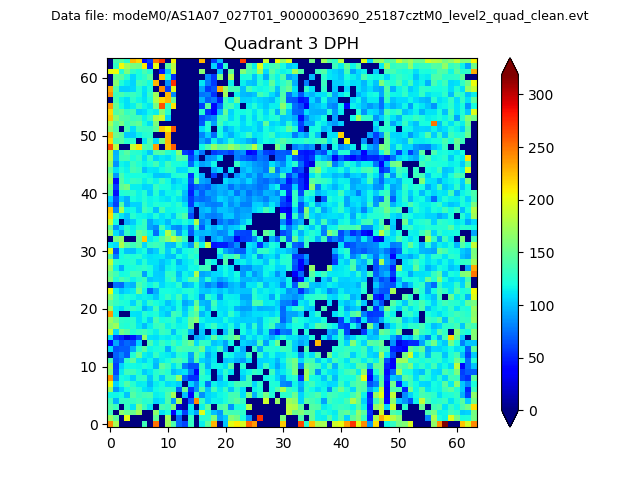 |
 |
Quadrant C |
| Plot type | Count rate plots | Images |
|---|---|---|
| Comparison with Poisson distribution Blue bars denote a histogram of data divided into 1 sec bins. Red curve is a Poisson curve with rate = median count rate of data. |
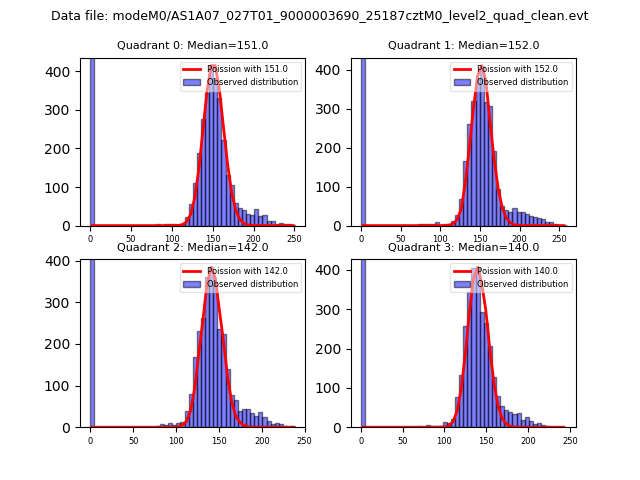 |
 |
| Quadrant-wise count rates Data is divided into 100 sec bins |
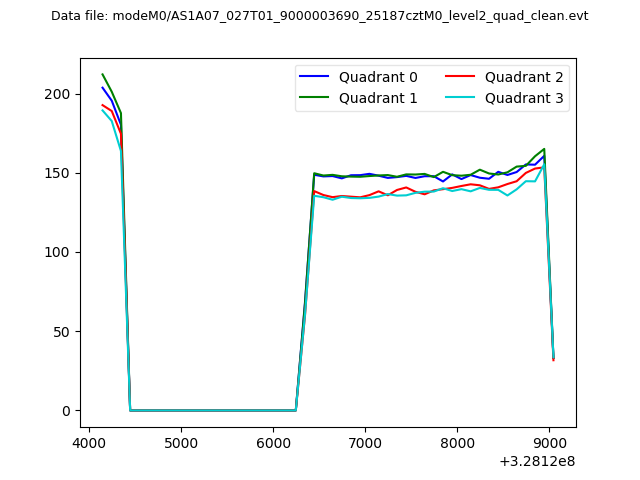 |
|
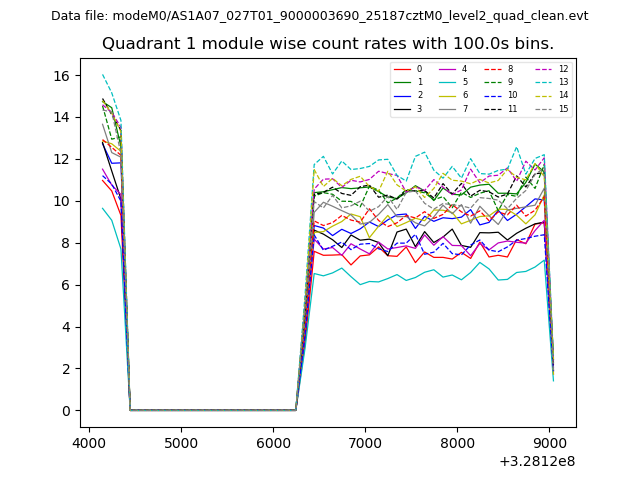
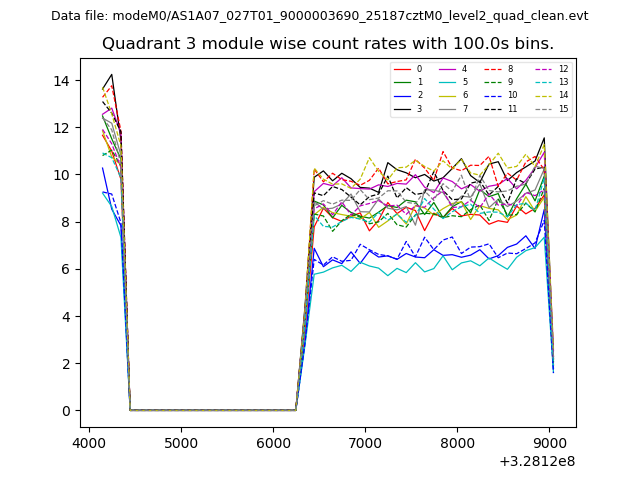
| Module-wise count rates for Quadrant A Data is divided into 100 sec bins |
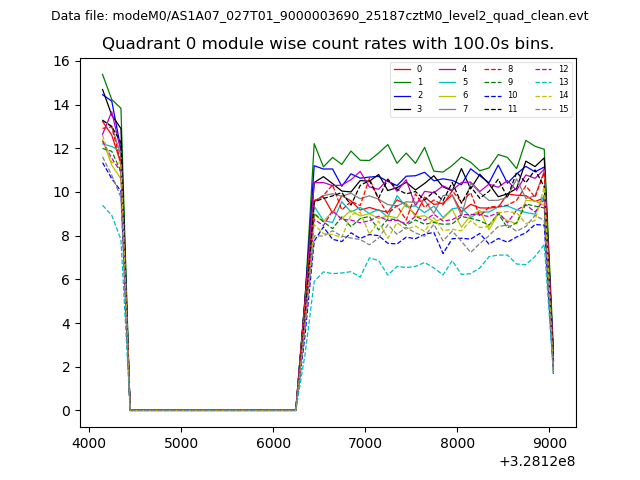 |
 |
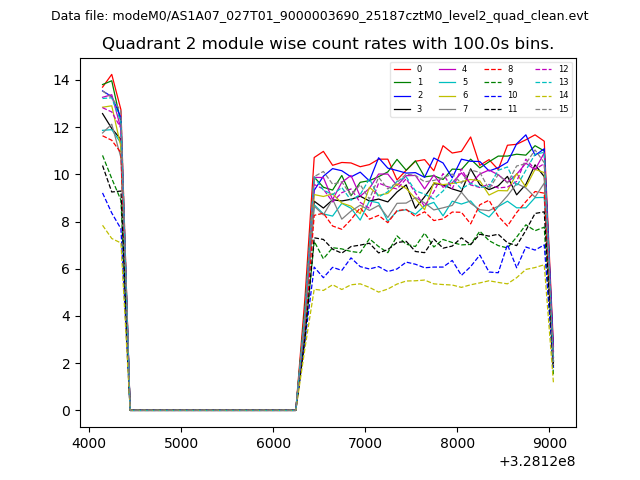
| Module-wise count rates for Quadrant B Data is divided into 100 sec bins |
 |
 |
| Module-wise count rates for Quadrant C Data is divided into 100 sec bins |
 |
 |
| Module-wise count rates for Quadrant D Data is divided into 100 sec bins |
 |
 |
| Parameter | Plot |
|---|---|
| CZT HV Monitor | 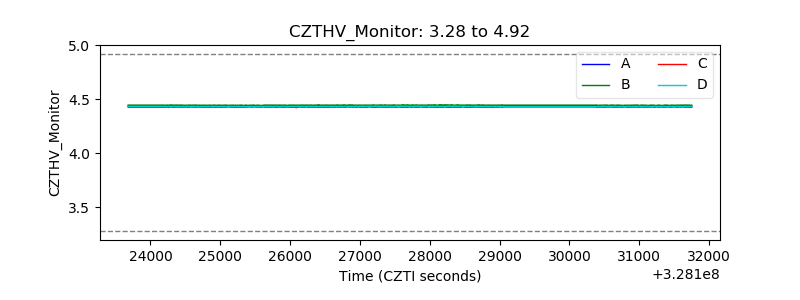 |
| D_VDD | 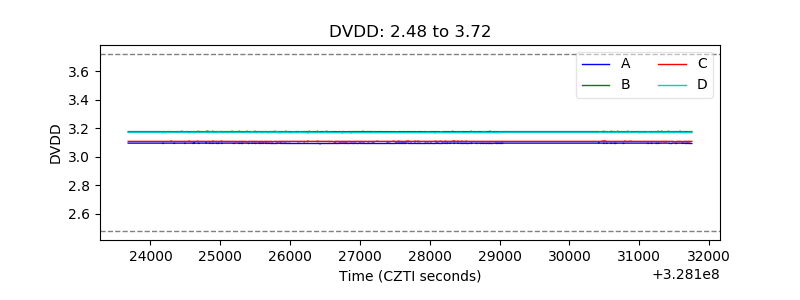 |
| Temperature 1 | 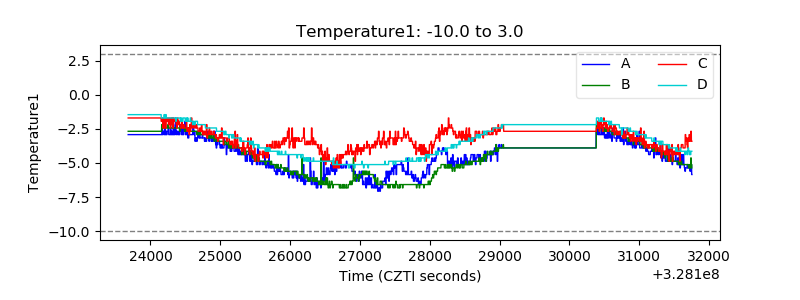 |
| Veto HV Monitor | 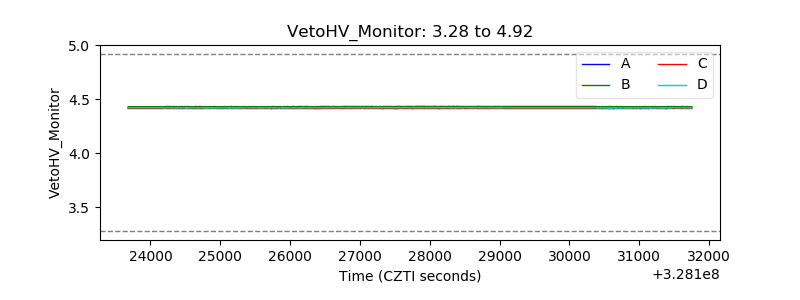 |
| Veto LLD | 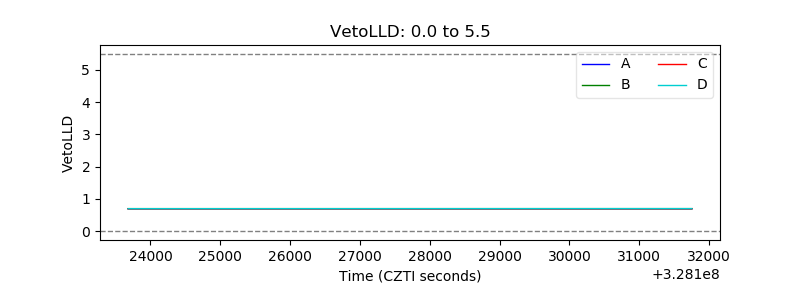 |
| Alpha Counter | 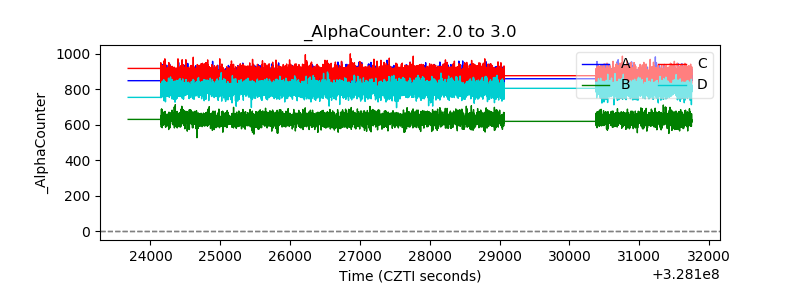 |
| _CPM_Rate | 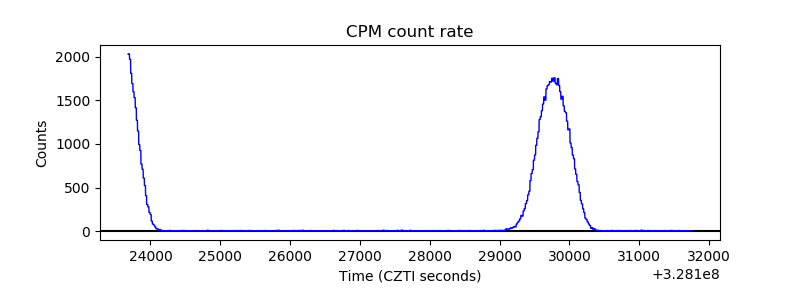 |
| CZT Counter | 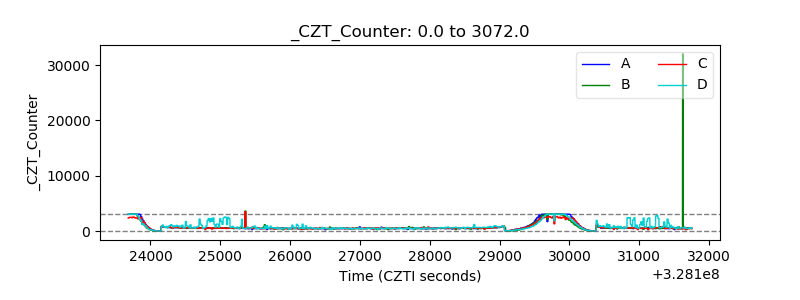 |
| +2.5 Volts monitor |  |
| +5 Volts monitor | 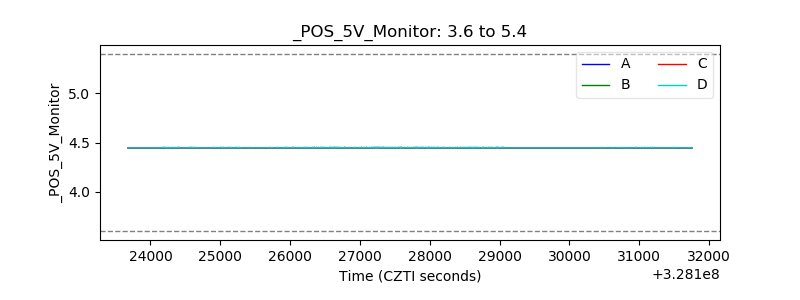 |
| _ROLL_ROT | 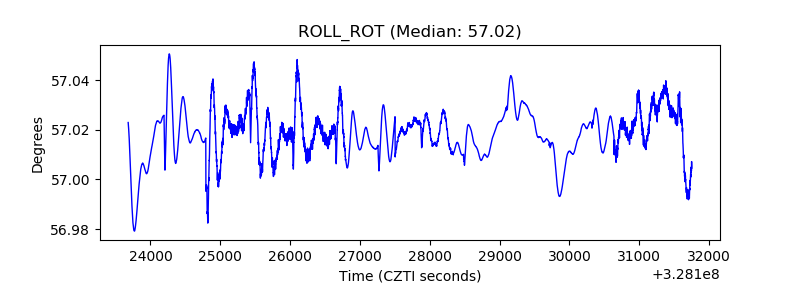 |
| _Roll_DEC | 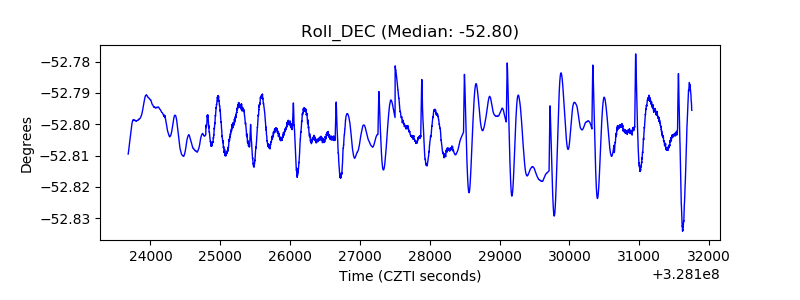 |
| _Roll_RA |  |
| Veto Counter | 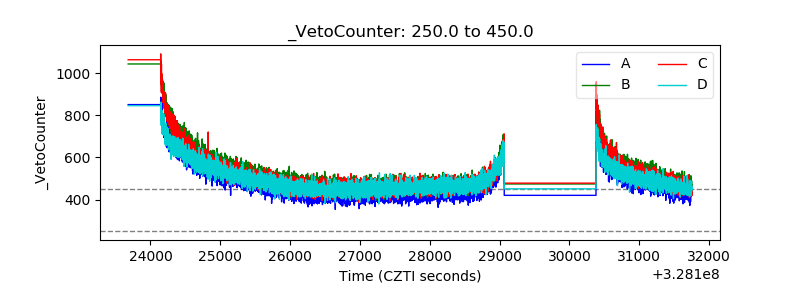 |