| Param | Original file | Final file |
|---|---|---|
| Filename | modeM0/AS1A07_027T01_9000003690_25188cztM0_level2.evt | modeM0/AS1A07_027T01_9000003690_25188cztM0_level2_quad_clean.evt |
| Size (bytes) | 501,992,640 | 74,805,120 |
| Size | 478.7 MB | 71.3 MB |
| Events in quadrant A | 3,114,985 | 467,899 |
| Events in quadrant B | 3,195,757 | 473,324 |
| Events in quadrant C | 3,549,641 | 445,674 |
| Events in quadrant D | 4,917,252 | 440,608 |
| Mode M9 | |||
|---|---|---|---|
| Quadrant | BADHDUFLAG | Total packets | Discarded packets |
| A | 0 | 11 | 0 |
| B | 0 | 11 | 0 |
| C | 0 | 11 | 0 |
| D | 0 | 11 | 0 |
| Mode M0 | |||
|---|---|---|---|
| Quadrant | BADHDUFLAG | Total packets | Discarded packets |
| A | 0 | 12930 | 0 |
| B | 0 | 13163 | 0 |
| C | 0 | 14308 | 0 |
| D | 0 | 18715 | 0 |
| Quadrant | Total seconds | Saturated seconds | Saturation percentage |
|---|---|---|---|
| A | 6266 | 57 | 0.909671% |
| B | 6266 | 83 | 1.324609% |
| C | 6267 | 89 | 1.420137% |
| D | 6267 | 351 | 5.600766% |
Noise dominated data is calculated using 1-second bins in cleaned event files. If a bin has >2000 counts, and if more than 50% of those come from <1% of pixels, then it is considered to be noise-dominated and hence unusable.
| Quadrant | # 1 sec bins | Bins with >0 counts | Bins with >2000 counts | High rate bins dominated by noise | Noise dominated (total time) | Noise dominated (detector-on time) | Marked lightcurve |
|---|---|---|---|---|---|---|---|
| A | 7346 | 6267 | 0 | 0 | 0.00% | 0.00% | 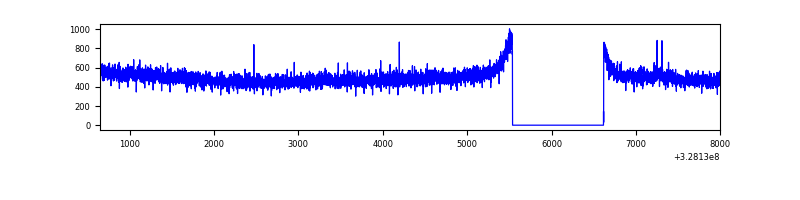 |
| B | 7346 | 6267 | 3 | 3 | 0.04% | 0.05% | 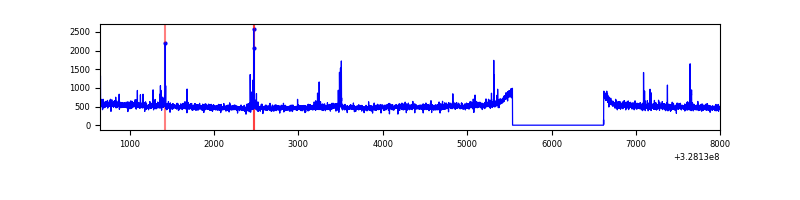 |
| C | 7347 | 6268 | 2 | 2 | 0.03% | 0.03% | 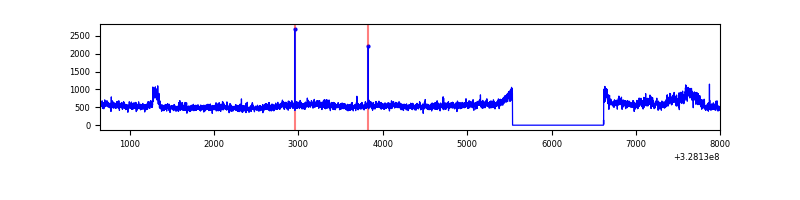 |
| D | 7347 | 6268 | 294 | 294 | 4.00% | 4.69% | 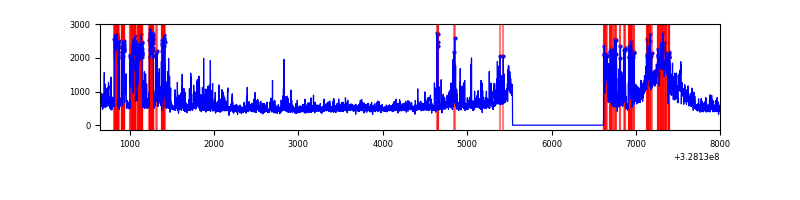 |
Top three noisy pixels from each quadrant. If the there are fewer than three noisy pixels in the level2.evt file, extra rows are filled as -1
| Pixel properties | Quadrant properties | ||||||
|---|---|---|---|---|---|---|---|
| Quadrant | DetID | PixID | Counts | Sigma | Mean | Median | Sigma |
| A | 13 | 254 | 10079 | 58.16 | 806 | 791 | 159.7 |
| A | 15 | 174 | 8086 | 45.68 | 806 | 791 | 159.7 |
| A | 3 | 137 | 7342 | 41.02 | 806 | 791 | 159.7 |
| B | 3 | 64 | 59035 | 387.62 | 797 | 779 | 150.3 |
| B | 12 | 111 | 18124 | 115.41 | 797 | 779 | 150.3 |
| B | 11 | 111 | 16025 | 101.44 | 797 | 779 | 150.3 |
| C | 7 | 247 | 430794 | 2424.83 | 763 | 770 | 177.3 |
| C | 14 | 238 | 125771 | 704.86 | 763 | 770 | 177.3 |
| C | 2 | 16 | 10354 | 54.04 | 763 | 770 | 177.3 |
| D | 12 | 235 | 582100 | 3174.75 | 764 | 740 | 183.1 |
| D | 1 | 255 | 451709 | 2462.7 | 764 | 740 | 183.1 |
| D | 1 | 52 | 441888 | 2409.07 | 764 | 740 | 183.1 |
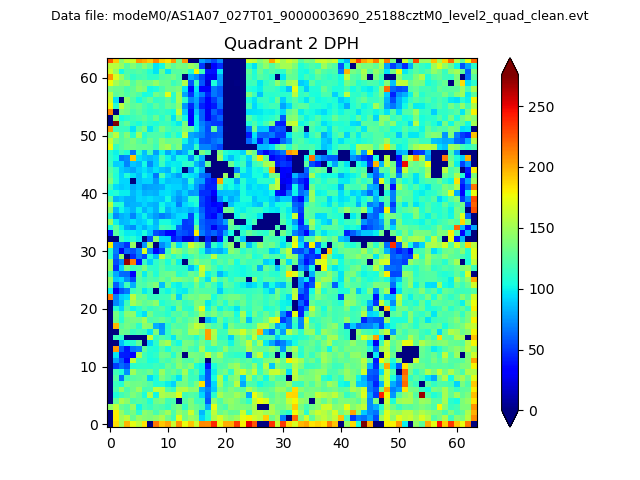
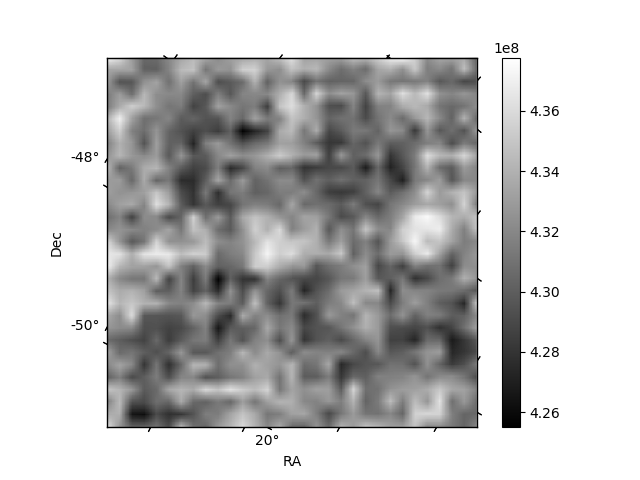
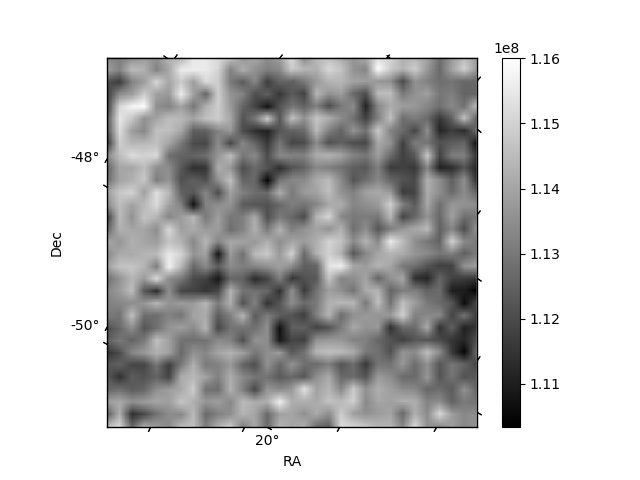
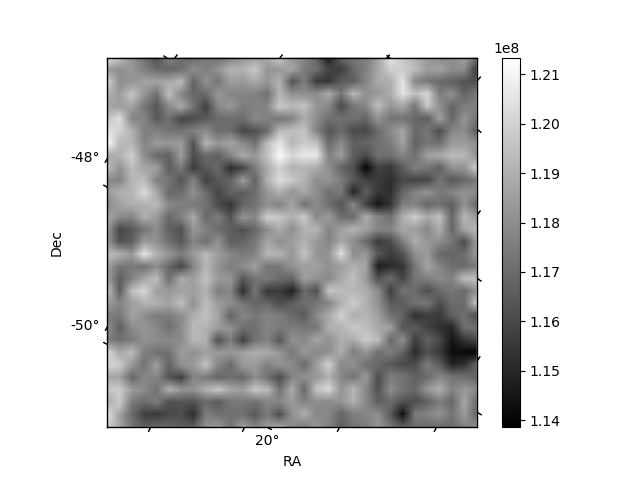
Histogram calculated using DETX and DETY for each event in the final _common_clean file
| Quadrant A | 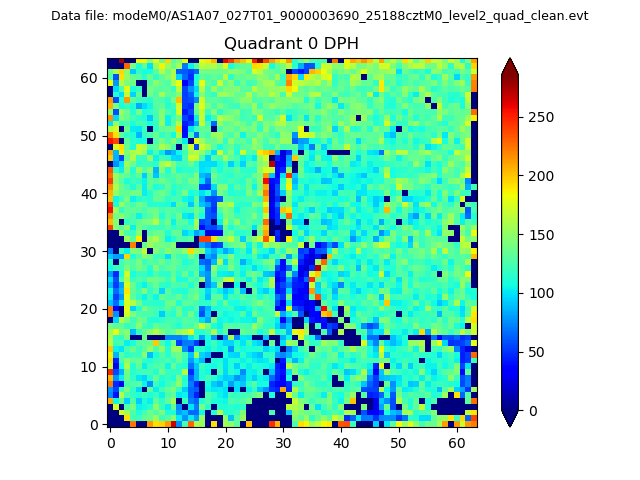 |
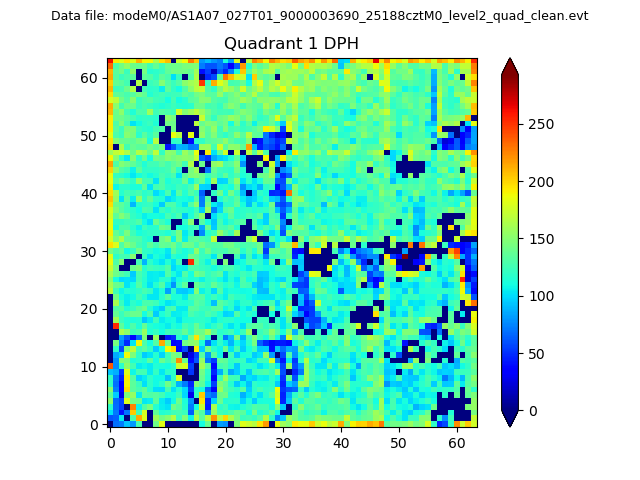 |
Quadrant B |
|---|---|---|---|
| Quadrant D | 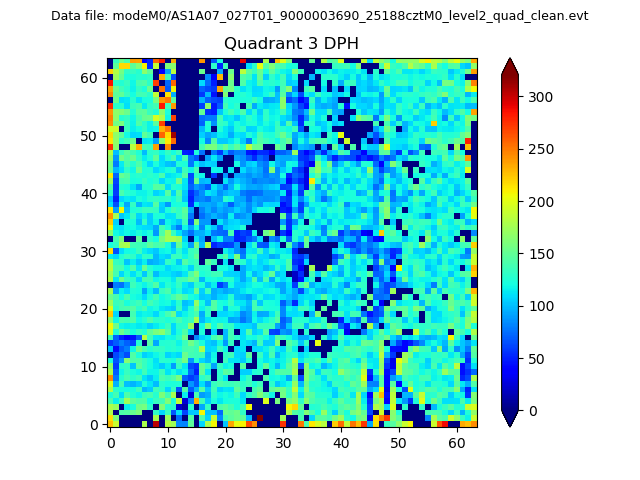 |
 |
Quadrant C |
| Plot type | Count rate plots | Images |
|---|---|---|
| Comparison with Poisson distribution Blue bars denote a histogram of data divided into 1 sec bins. Red curve is a Poisson curve with rate = median count rate of data. |
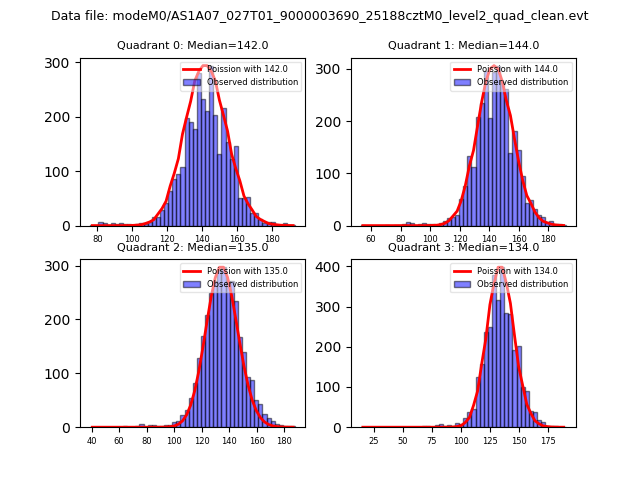 |
 |
| Quadrant-wise count rates Data is divided into 100 sec bins |
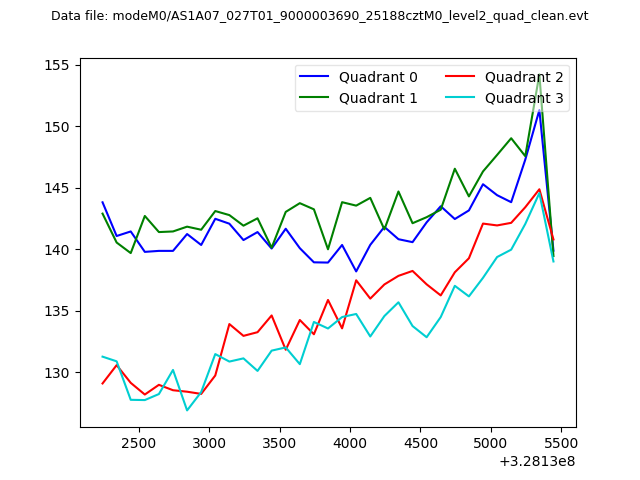 |
|
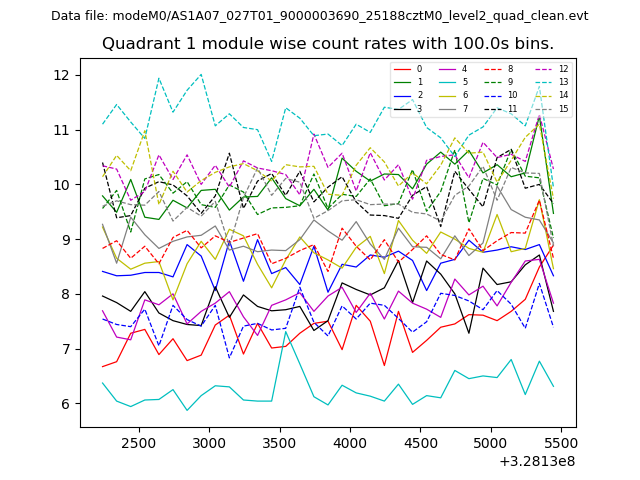
| Module-wise count rates for Quadrant A Data is divided into 100 sec bins |
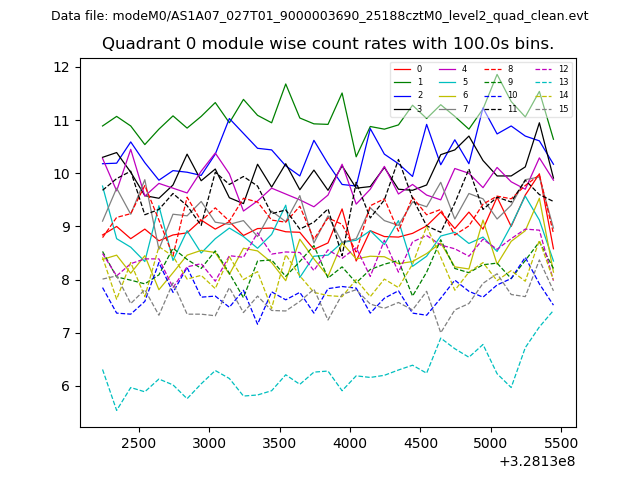 |
 |
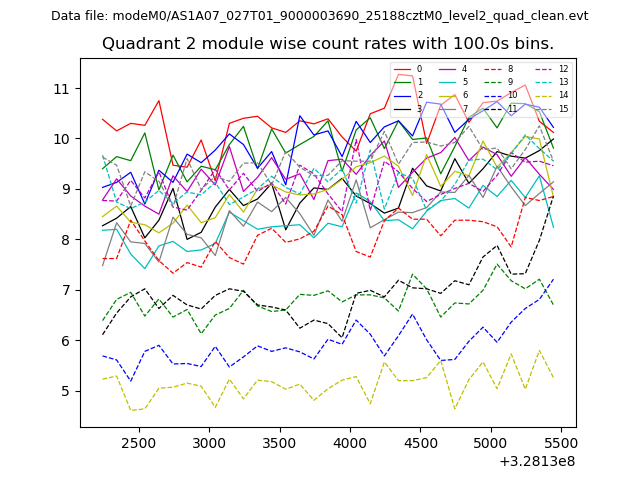
| Module-wise count rates for Quadrant B Data is divided into 100 sec bins |
 |
 |
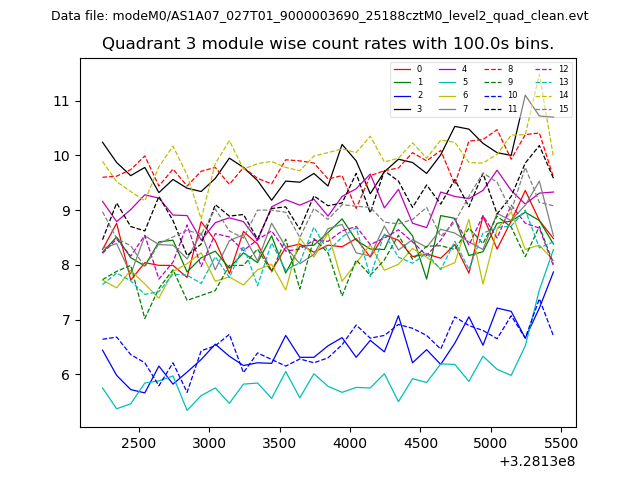
| Module-wise count rates for Quadrant C Data is divided into 100 sec bins |
 |
 |
| Module-wise count rates for Quadrant D Data is divided into 100 sec bins |
 |
 |
| Parameter | Plot |
|---|---|
| CZT HV Monitor | 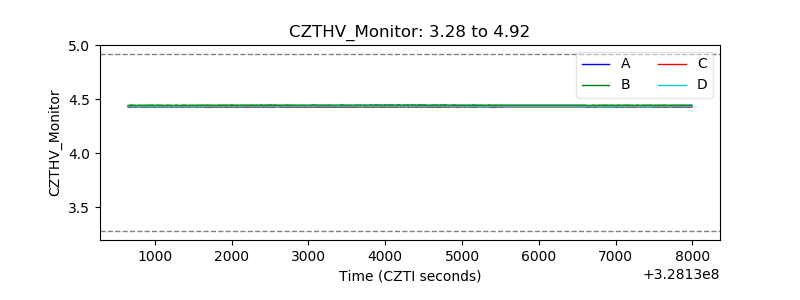 |
| D_VDD | 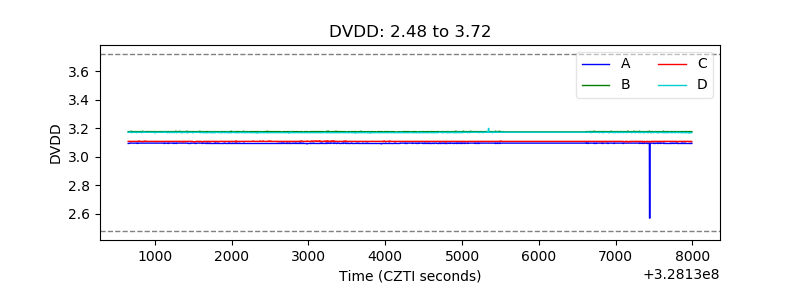 |
| Temperature 1 | 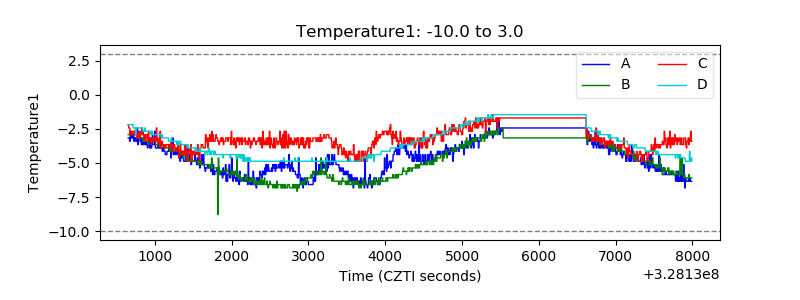 |
| Veto HV Monitor | 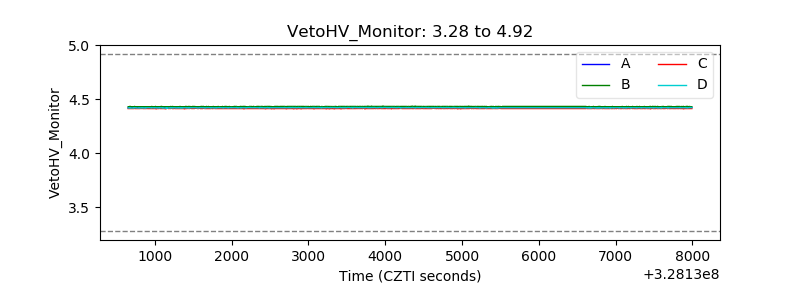 |
| Veto LLD | 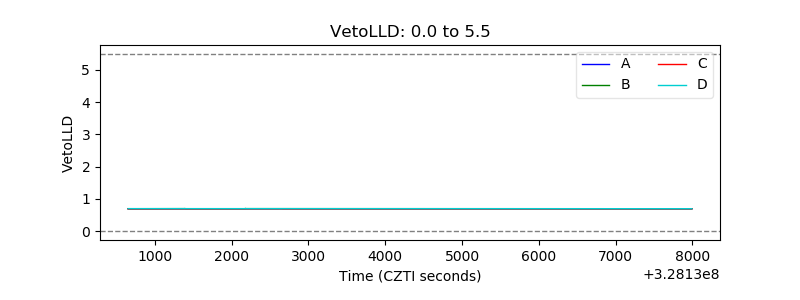 |
| Alpha Counter | 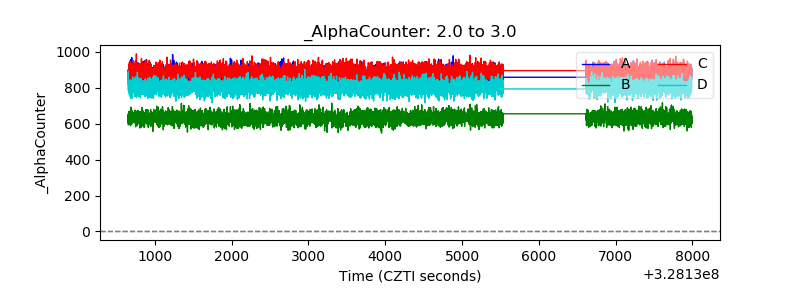 |
| _CPM_Rate | 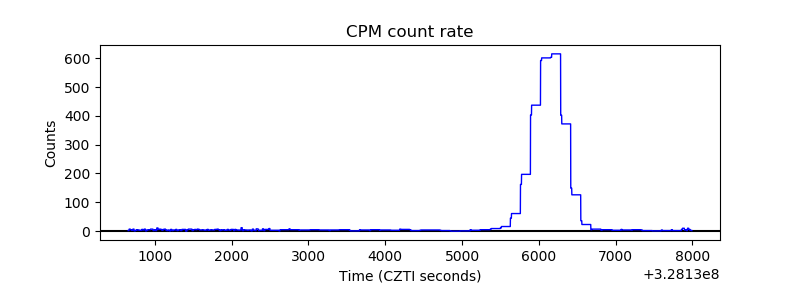 |
| CZT Counter | 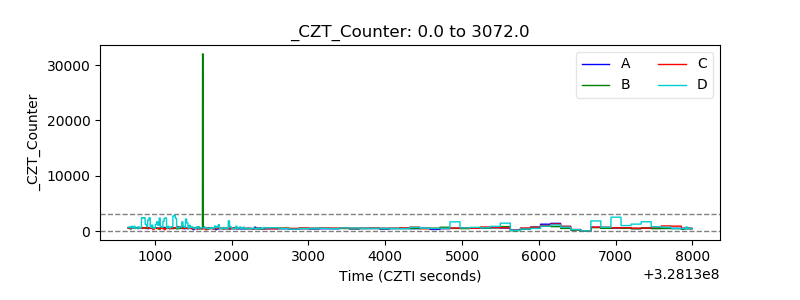 |
| +2.5 Volts monitor |  |
| +5 Volts monitor | 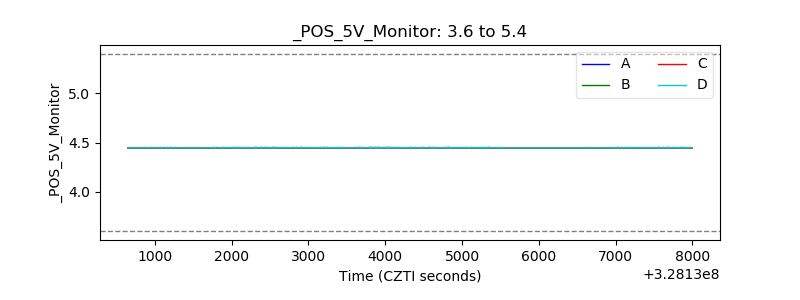 |
| _ROLL_ROT | 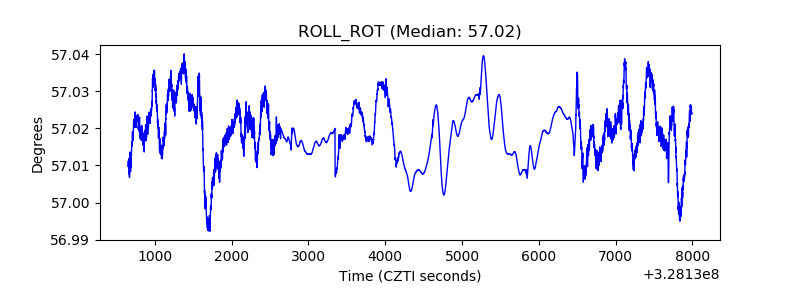 |
| _Roll_DEC | 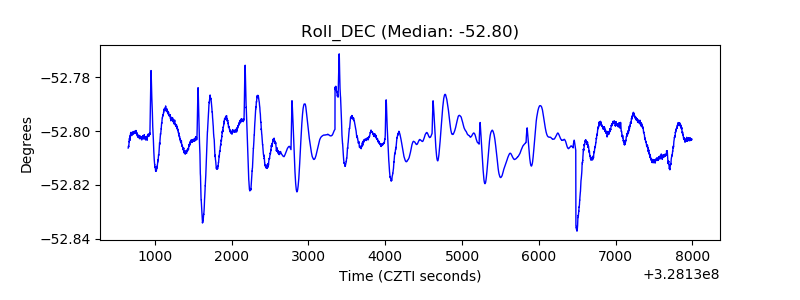 |
| _Roll_RA | 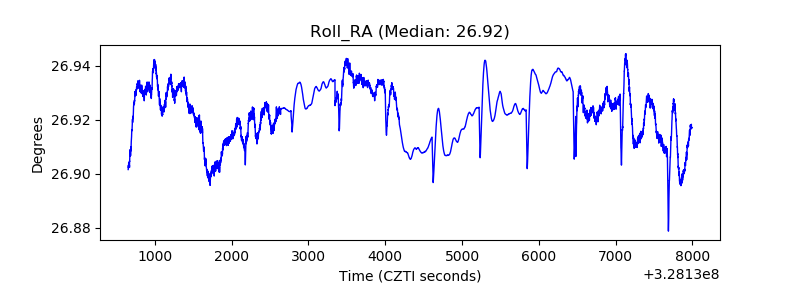 |
| Veto Counter | 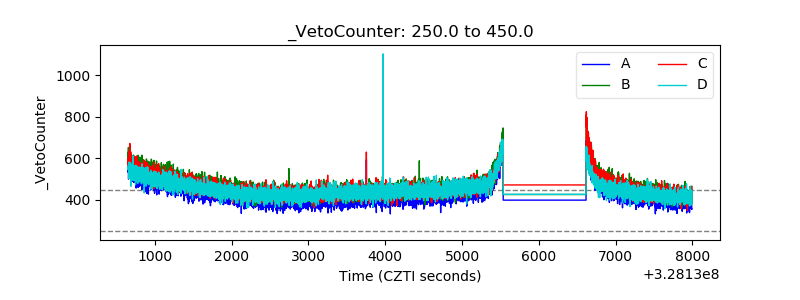 |