| Param | Original file | Final file |
|---|---|---|
| Filename | modeM0/AS1A07_027T01_9000003690_25189cztM0_level2.evt | modeM0/AS1A07_027T01_9000003690_25189cztM0_level2_quad_clean.evt |
| Size (bytes) | 539,550,720 | 87,854,400 |
| Size | 514.6 MB | 83.8 MB |
| Events in quadrant A | 3,285,509 | 558,894 |
| Events in quadrant B | 3,441,727 | 564,244 |
| Events in quadrant C | 4,535,767 | 530,343 |
| Events in quadrant D | 4,612,210 | 528,910 |
| Mode M9 | |||
|---|---|---|---|
| Quadrant | BADHDUFLAG | Total packets | Discarded packets |
| A | 0 | 7 | 0 |
| B | 0 | 8 | 0 |
| C | 0 | 8 | 0 |
| D | 0 | 8 | 0 |
| Mode M0 | |||
|---|---|---|---|
| Quadrant | BADHDUFLAG | Total packets | Discarded packets |
| A | 0 | 14054 | 0 |
| B | 0 | 14451 | 0 |
| C | 0 | 18365 | 0 |
| D | 0 | 18159 | 0 |
| Quadrant | Total seconds | Saturated seconds | Saturation percentage |
|---|---|---|---|
| A | 6859 | 40 | 0.583175% |
| B | 6859 | 77 | 1.122613% |
| C | 6859 | 131 | 1.909899% |
| D | 6858 | 162 | 2.362205% |
Noise dominated data is calculated using 1-second bins in cleaned event files. If a bin has >2000 counts, and if more than 50% of those come from <1% of pixels, then it is considered to be noise-dominated and hence unusable.
| Quadrant | # 1 sec bins | Bins with >0 counts | Bins with >2000 counts | High rate bins dominated by noise | Noise dominated (total time) | Noise dominated (detector-on time) | Marked lightcurve |
|---|---|---|---|---|---|---|---|
| A | 7604 | 6860 | 0 | 0 | 0.00% | 0.00% | 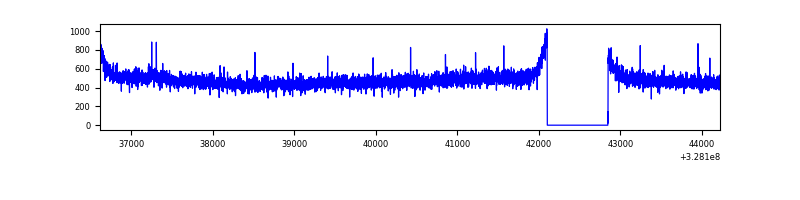 |
| B | 7604 | 6860 | 6 | 6 | 0.08% | 0.09% | 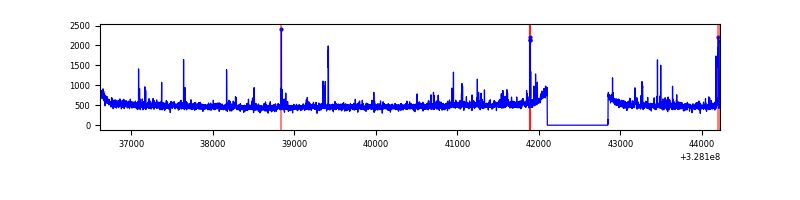 |
| C | 7604 | 6860 | 0 | 0 | 0.00% | 0.00% | 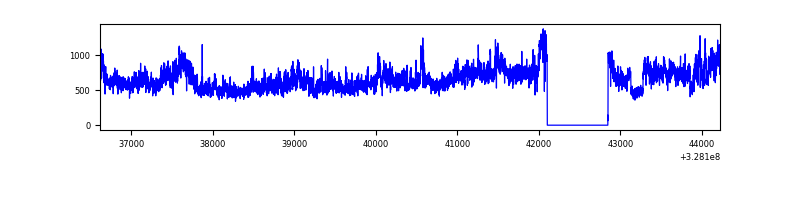 |
| D | 7603 | 6859 | 87 | 87 | 1.14% | 1.27% | 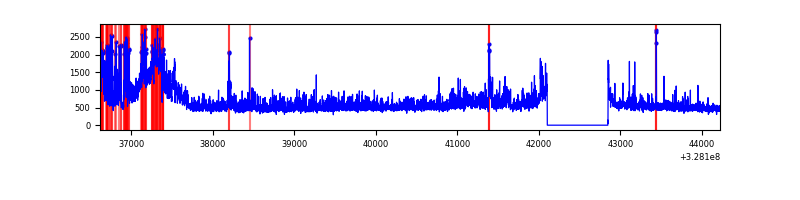 |
Top three noisy pixels from each quadrant. If the there are fewer than three noisy pixels in the level2.evt file, extra rows are filled as -1
| Pixel properties | Quadrant properties | ||||||
|---|---|---|---|---|---|---|---|
| Quadrant | DetID | PixID | Counts | Sigma | Mean | Median | Sigma |
| A | 13 | 254 | 11672 | 64.12 | 850 | 833 | 169.0 |
| A | 15 | 174 | 8559 | 45.7 | 850 | 833 | 169.0 |
| A | 3 | 137 | 7815 | 41.3 | 850 | 833 | 169.0 |
| B | 3 | 64 | 90928 | 566.11 | 842 | 822 | 159.2 |
| B | 0 | 189 | 28010 | 170.82 | 842 | 822 | 159.2 |
| B | 12 | 111 | 19591 | 117.92 | 842 | 822 | 159.2 |
| C | 7 | 247 | 1245708 | 6666.25 | 806 | 812 | 186.7 |
| C | 14 | 238 | 131934 | 702.14 | 806 | 812 | 186.7 |
| C | 3 | 233 | 5610 | 25.69 | 806 | 812 | 186.7 |
| D | 12 | 235 | 455478 | 2340.14 | 816 | 794 | 194.3 |
| D | 8 | 195 | 453164 | 2328.23 | 816 | 794 | 194.3 |
| D | 1 | 255 | 429525 | 2206.57 | 816 | 794 | 194.3 |
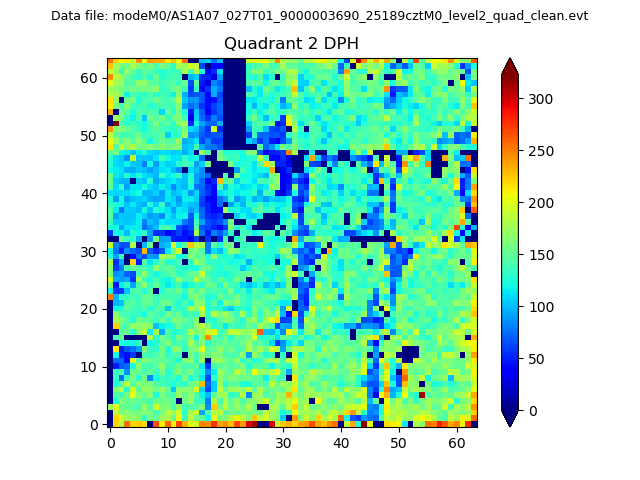
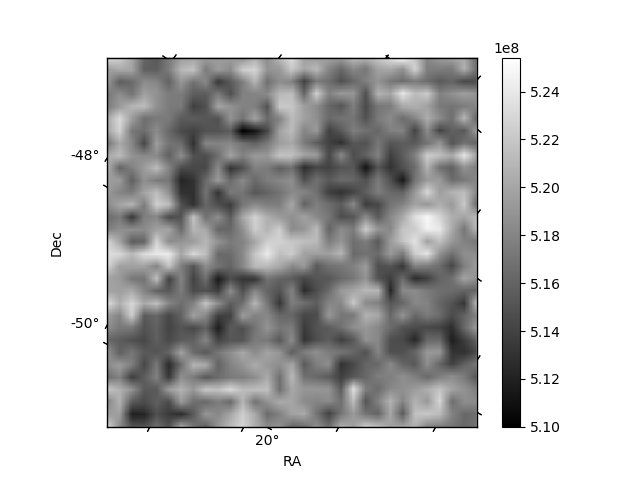
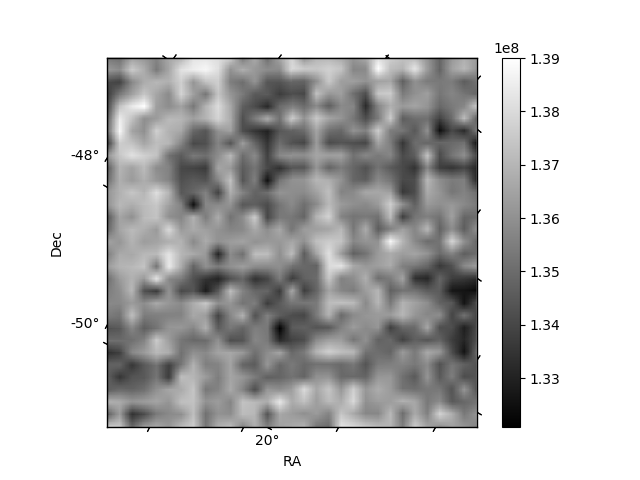
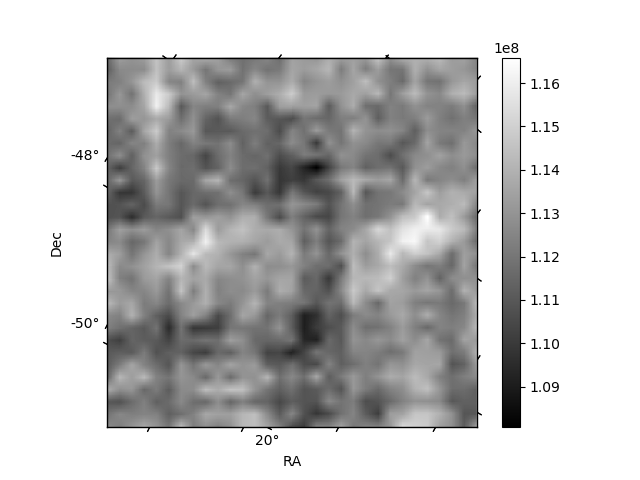
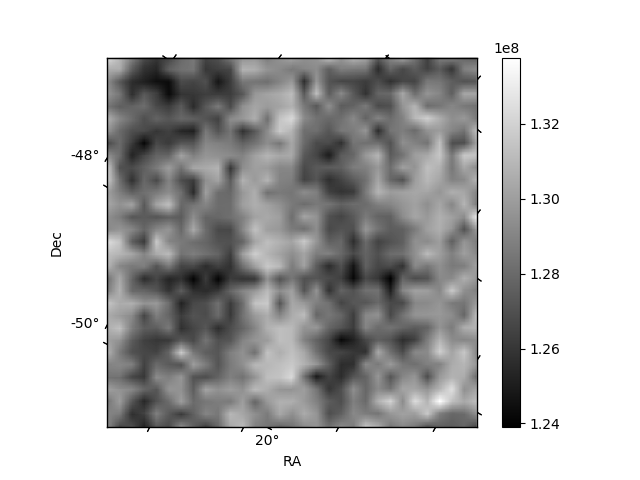
Histogram calculated using DETX and DETY for each event in the final _common_clean file
| Quadrant A | 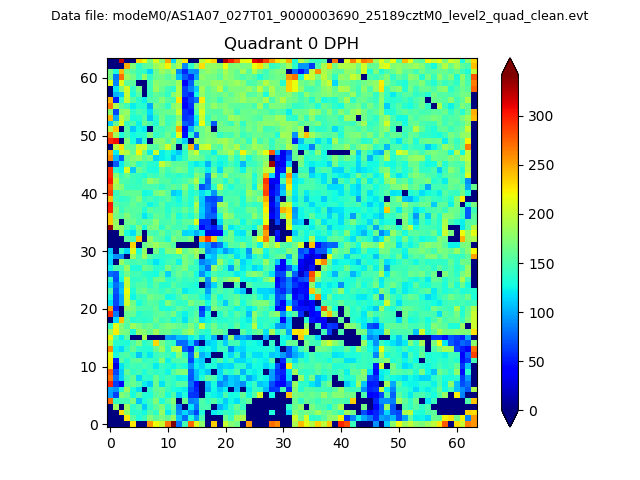 |
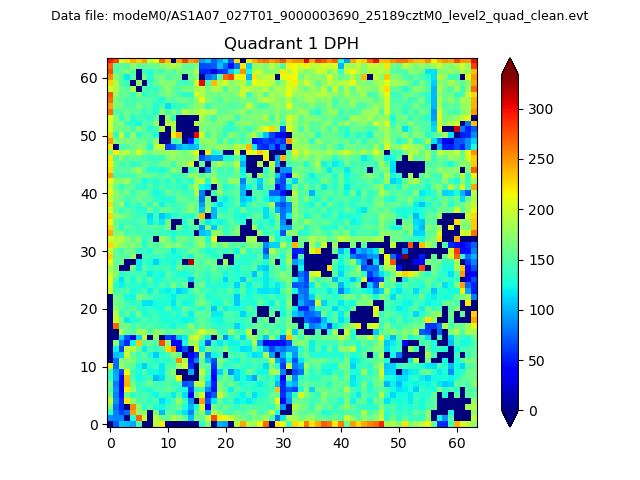 |
Quadrant B |
|---|---|---|---|
| Quadrant D | 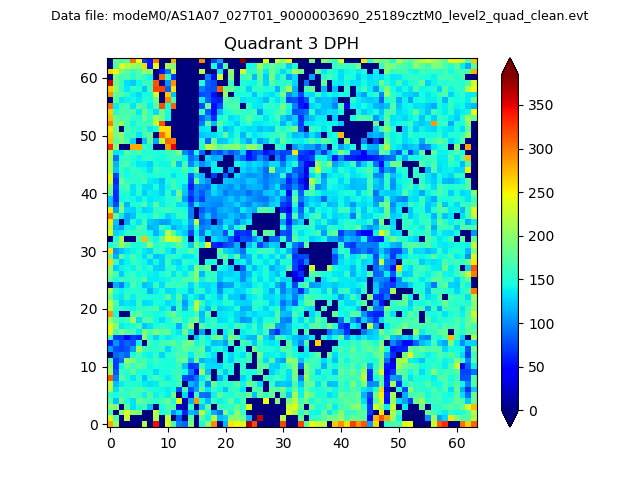 |
 |
Quadrant C |
| Plot type | Count rate plots | Images |
|---|---|---|
| Comparison with Poisson distribution Blue bars denote a histogram of data divided into 1 sec bins. Red curve is a Poisson curve with rate = median count rate of data. |
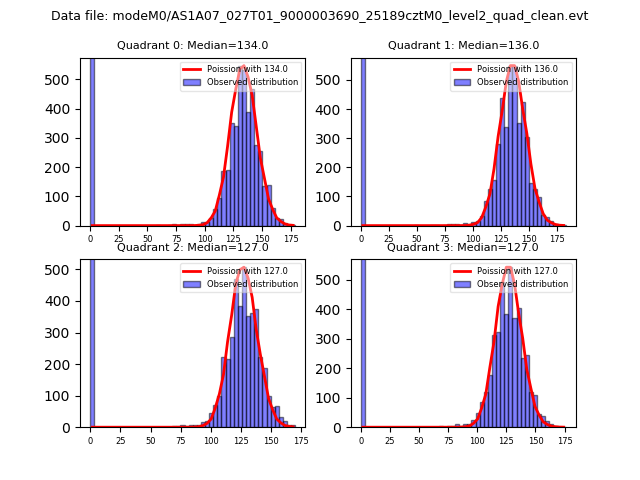 |
 |
| Quadrant-wise count rates Data is divided into 100 sec bins |
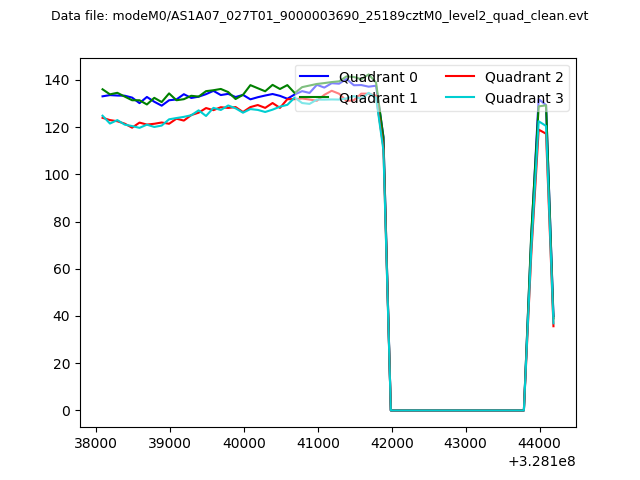 |
|
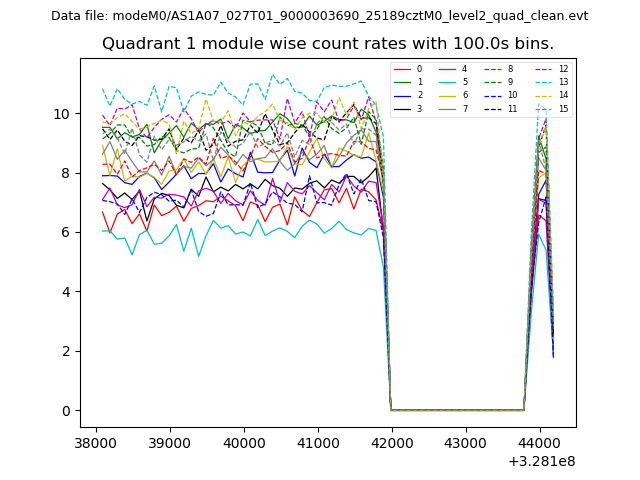
| Module-wise count rates for Quadrant A Data is divided into 100 sec bins |
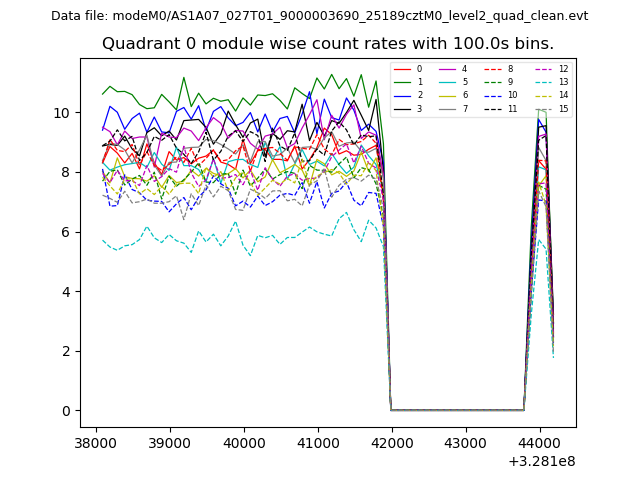 |
 |
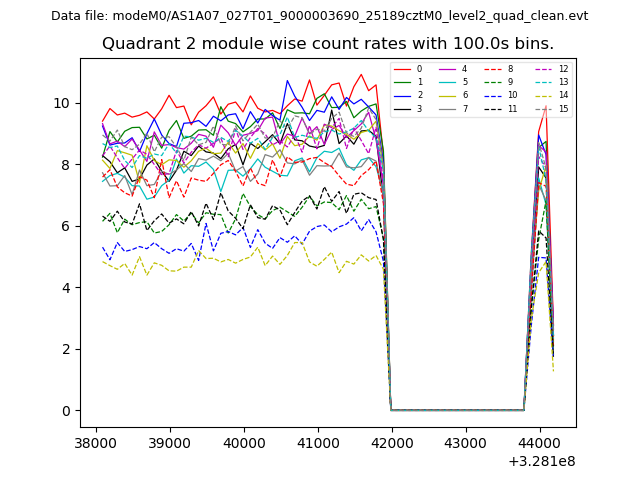
| Module-wise count rates for Quadrant B Data is divided into 100 sec bins |
 |
 |
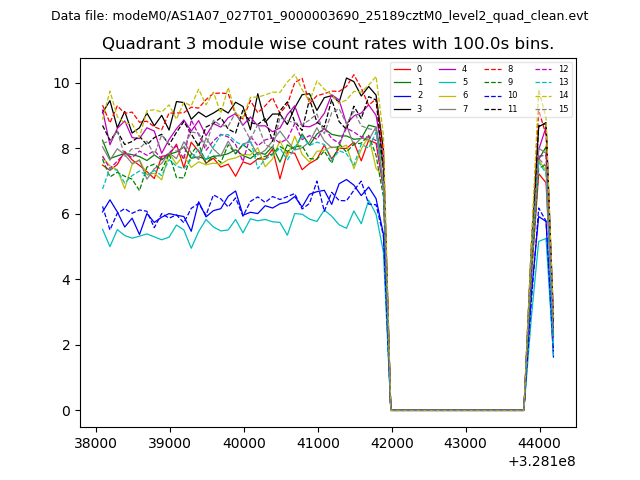
| Module-wise count rates for Quadrant C Data is divided into 100 sec bins |
 |
 |
| Module-wise count rates for Quadrant D Data is divided into 100 sec bins |
 |
 |
| Parameter | Plot |
|---|---|
| CZT HV Monitor | 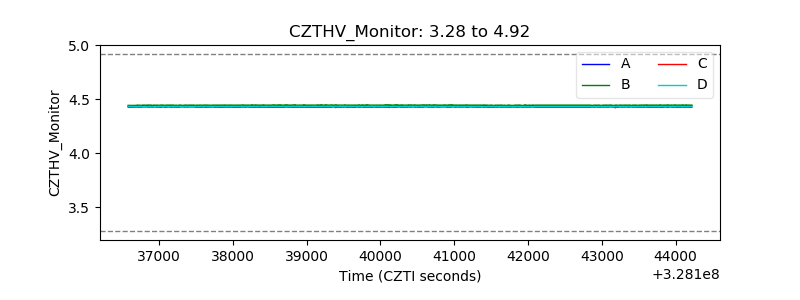 |
| D_VDD | 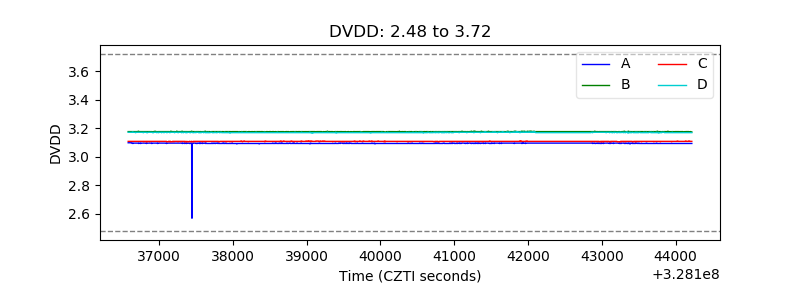 |
| Temperature 1 | 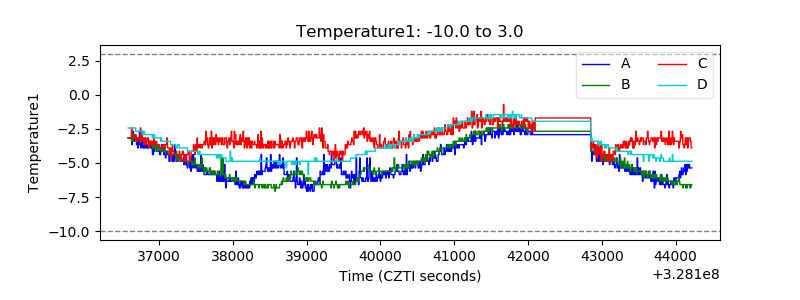 |
| Veto HV Monitor | 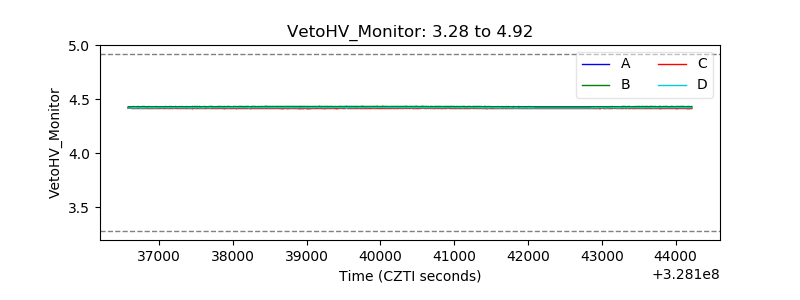 |
| Veto LLD | 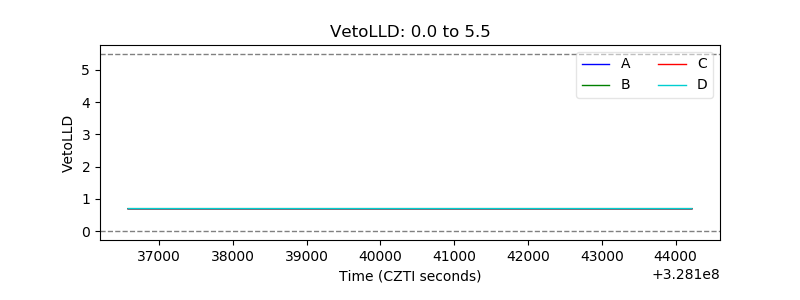 |
| Alpha Counter | 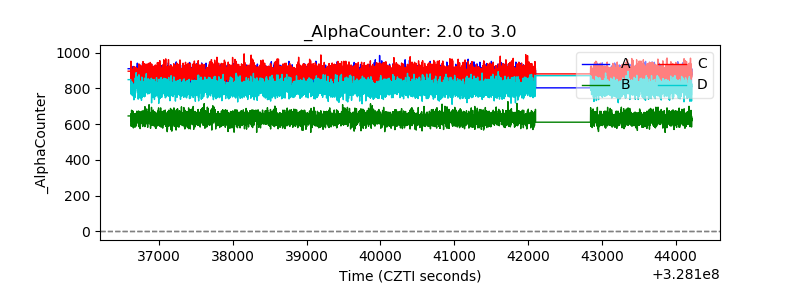 |
| _CPM_Rate | 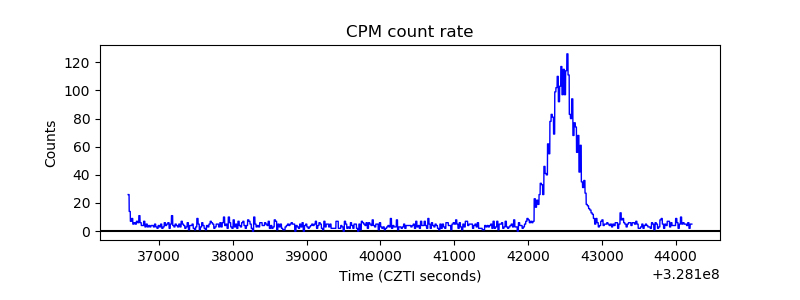 |
| CZT Counter | 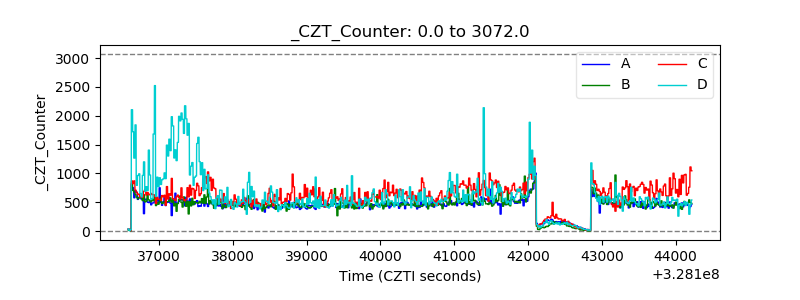 |
| +2.5 Volts monitor |  |
| +5 Volts monitor |  |
| _ROLL_ROT | 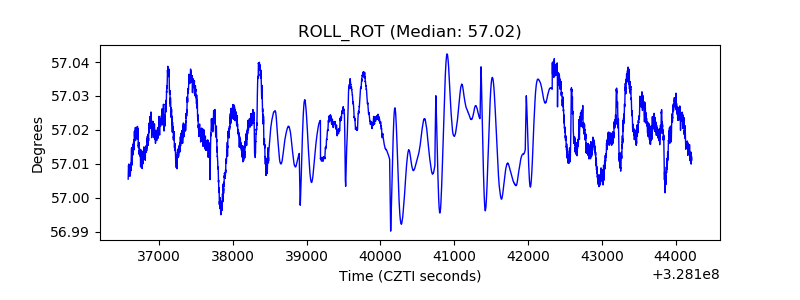 |
| _Roll_DEC | 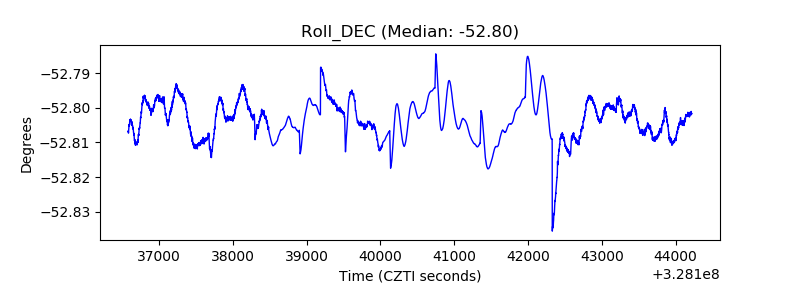 |
| _Roll_RA | 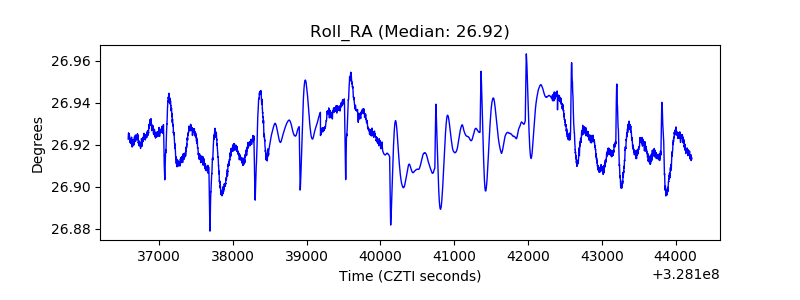 |
| Veto Counter | 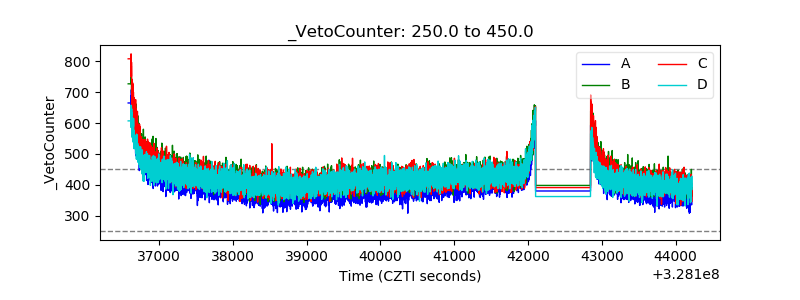 |