| Param | Original file | Final file |
|---|---|---|
| Filename | modeM0/AS1A07_027T01_9000003690_25190cztM0_level2.evt | modeM0/AS1A07_027T01_9000003690_25190cztM0_level2_quad_clean.evt |
| Size (bytes) | 525,323,520 | 93,312,000 |
| Size | 501.0 MB | 89.0 MB |
| Events in quadrant A | 3,243,357 | 600,288 |
| Events in quadrant B | 3,589,825 | 599,580 |
| Events in quadrant C | 4,500,495 | 570,269 |
| Events in quadrant D | 4,102,734 | 569,774 |
| Mode M9 | |||
|---|---|---|---|
| Quadrant | BADHDUFLAG | Total packets | Discarded packets |
| A | 0 | 4 | 0 |
| B | 0 | 4 | 0 |
| C | 0 | 4 | 0 |
| D | 0 | 4 | 0 |
| Mode M0 | |||
|---|---|---|---|
| Quadrant | BADHDUFLAG | Total packets | Discarded packets |
| A | 0 | 14172 | 0 |
| B | 0 | 15058 | 0 |
| C | 0 | 17904 | 0 |
| D | 0 | 16761 | 0 |
| Quadrant | Total seconds | Saturated seconds | Saturation percentage |
|---|---|---|---|
| A | 6973 | 26 | 0.372867% |
| B | 6974 | 133 | 1.907083% |
| C | 6974 | 107 | 1.534270% |
| D | 6974 | 65 | 0.932033% |
Noise dominated data is calculated using 1-second bins in cleaned event files. If a bin has >2000 counts, and if more than 50% of those come from <1% of pixels, then it is considered to be noise-dominated and hence unusable.
| Quadrant | # 1 sec bins | Bins with >0 counts | Bins with >2000 counts | High rate bins dominated by noise | Noise dominated (total time) | Noise dominated (detector-on time) | Marked lightcurve |
|---|---|---|---|---|---|---|---|
| A | 7378 | 6974 | 0 | 0 | 0.00% | 0.00% | 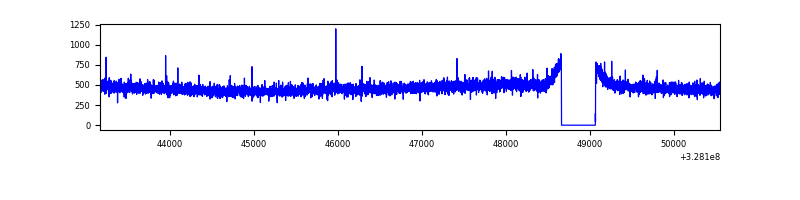 |
| B | 7379 | 6975 | 55 | 55 | 0.75% | 0.79% | 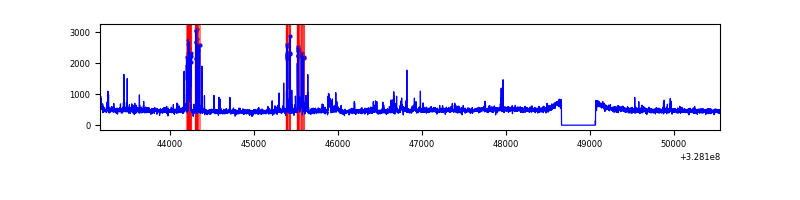 |
| C | 7379 | 6975 | 0 | 0 | 0.00% | 0.00% |  |
| D | 7379 | 6975 | 28 | 28 | 0.38% | 0.40% | 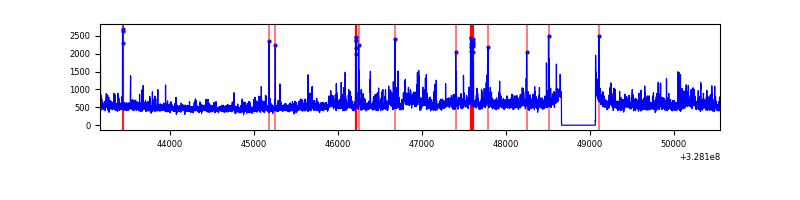 |
Top three noisy pixels from each quadrant. If the there are fewer than three noisy pixels in the level2.evt file, extra rows are filled as -1
| Pixel properties | Quadrant properties | ||||||
|---|---|---|---|---|---|---|---|
| Quadrant | DetID | PixID | Counts | Sigma | Mean | Median | Sigma |
| A | 13 | 254 | 11769 | 64.58 | 841 | 823 | 169.5 |
| A | 3 | 137 | 7786 | 41.08 | 841 | 823 | 169.5 |
| A | 0 | 226 | 7156 | 37.36 | 841 | 823 | 169.5 |
| B | 3 | 64 | 248223 | 1555.94 | 832 | 811 | 159.0 |
| B | 0 | 189 | 36851 | 226.65 | 832 | 811 | 159.0 |
| B | 5 | 235 | 21332 | 129.05 | 832 | 811 | 159.0 |
| C | 7 | 247 | 1221372 | 6473.73 | 803 | 807 | 188.5 |
| C | 14 | 238 | 131040 | 690.74 | 803 | 807 | 188.5 |
| C | 8 | 208 | 11060 | 54.38 | 803 | 807 | 188.5 |
| D | 8 | 195 | 436204 | 2208.26 | 815 | 792 | 197.2 |
| D | 12 | 235 | 364929 | 1846.78 | 815 | 792 | 197.2 |
| D | 2 | 244 | 131811 | 664.48 | 815 | 792 | 197.2 |
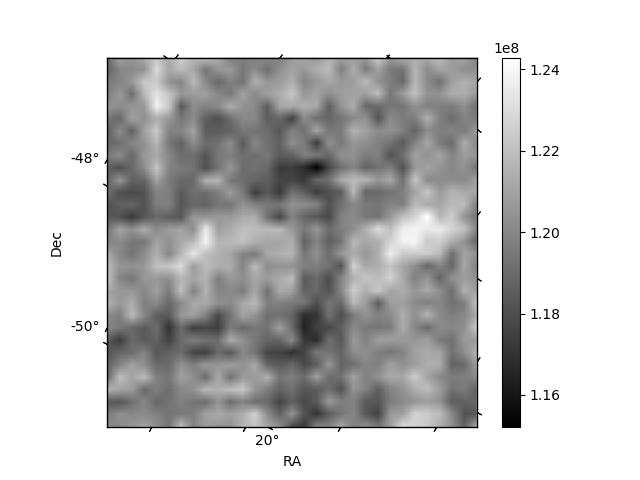
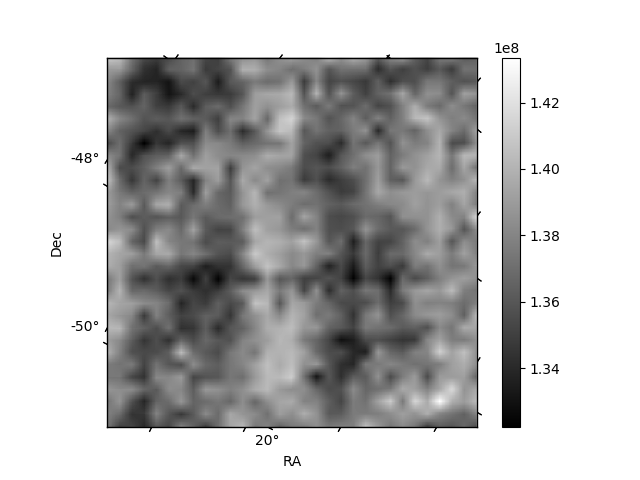
Histogram calculated using DETX and DETY for each event in the final _common_clean file
| Quadrant A | 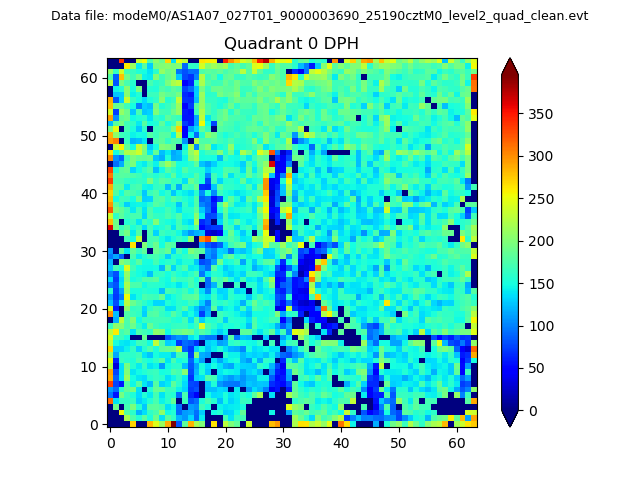 |
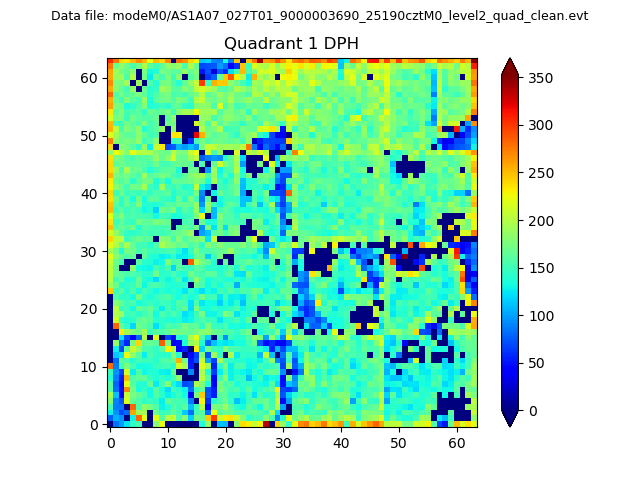 |
Quadrant B |
|---|---|---|---|
| Quadrant D | 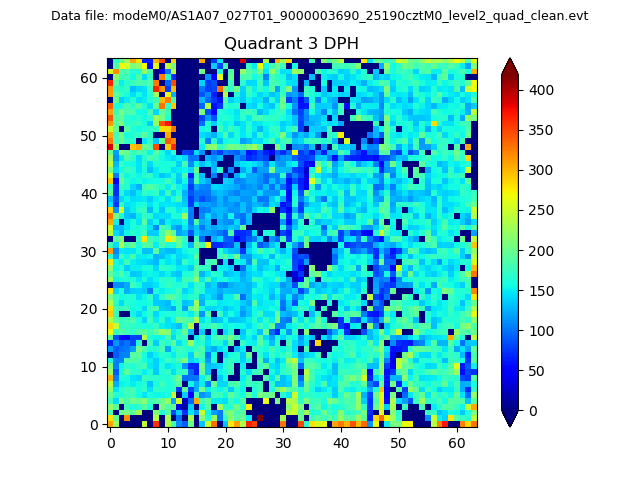 |
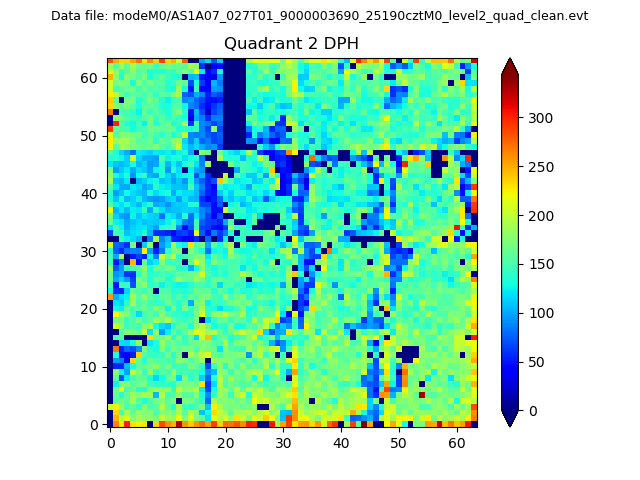 |
Quadrant C |
| Plot type | Count rate plots | Images |
|---|---|---|
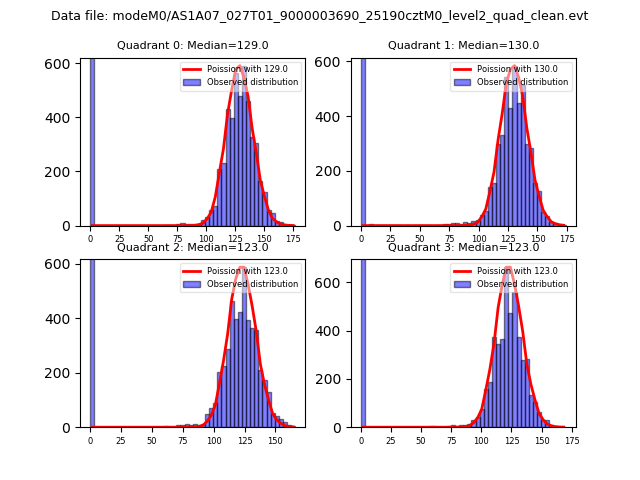
| Comparison with Poisson distribution Blue bars denote a histogram of data divided into 1 sec bins. Red curve is a Poisson curve with rate = median count rate of data. |
 |
 |
| Quadrant-wise count rates Data is divided into 100 sec bins |
 |
|
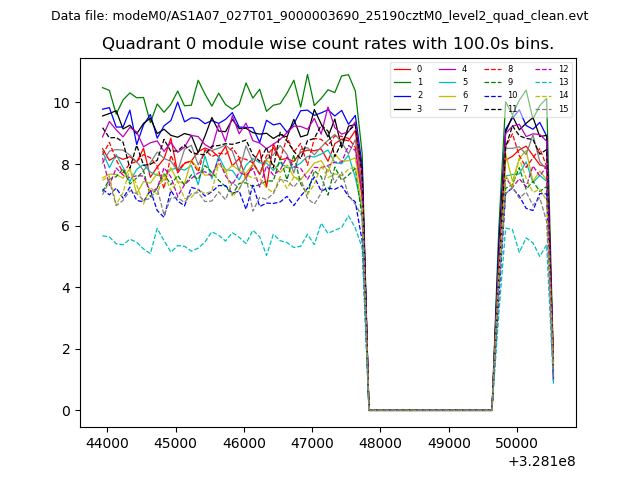
| Module-wise count rates for Quadrant A Data is divided into 100 sec bins |
 |
 |
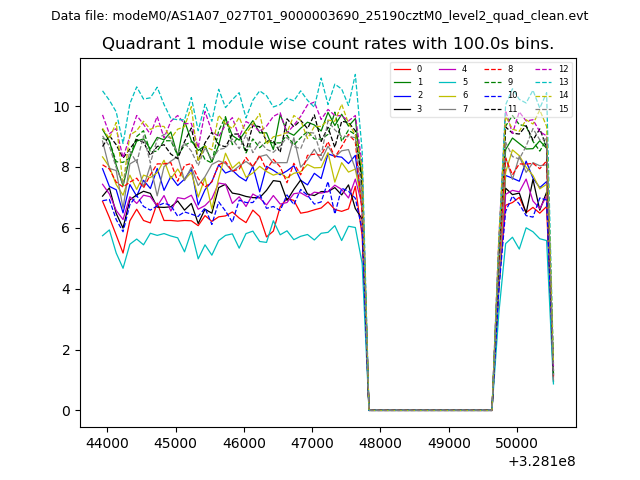
| Module-wise count rates for Quadrant B Data is divided into 100 sec bins |
 |
 |
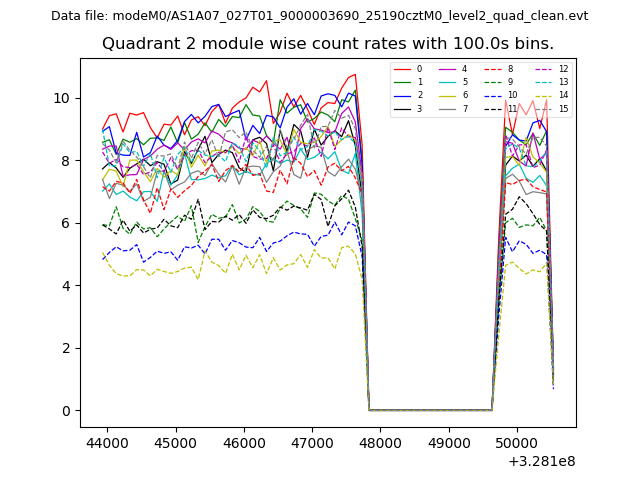
| Module-wise count rates for Quadrant C Data is divided into 100 sec bins |
 |
 |
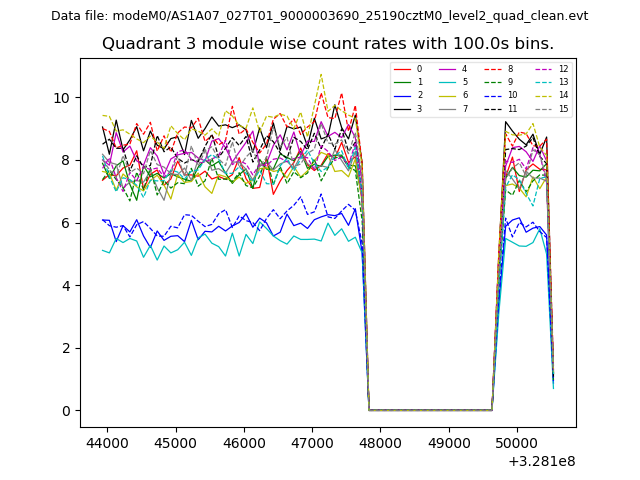
| Module-wise count rates for Quadrant D Data is divided into 100 sec bins |
 |
 |
| Parameter | Plot |
|---|---|
| CZT HV Monitor | 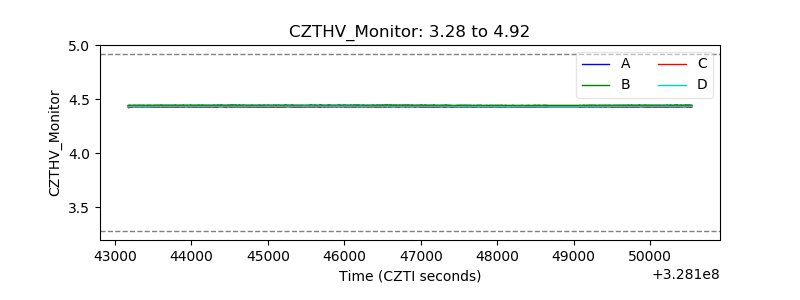 |
| D_VDD | 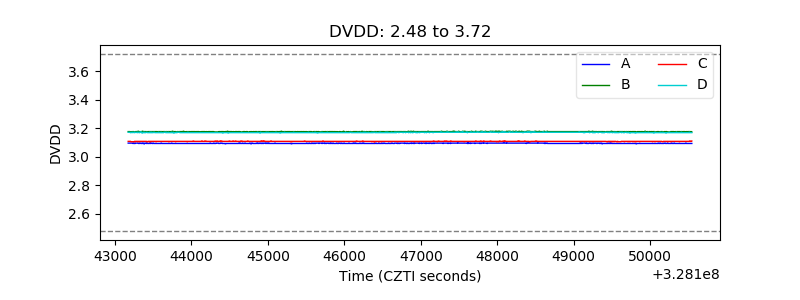 |
| Temperature 1 | 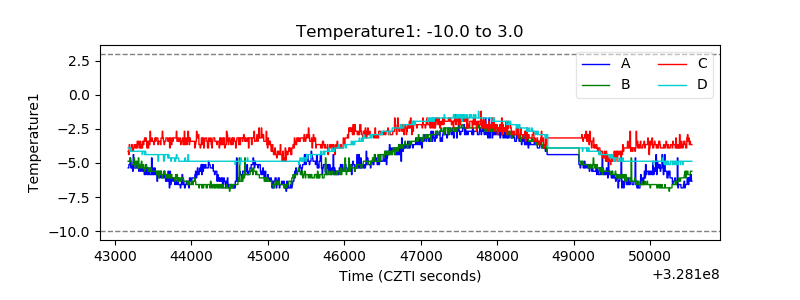 |
| Veto HV Monitor | 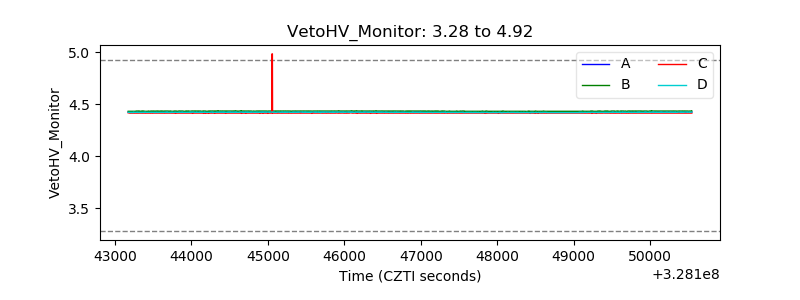 |
| Veto LLD | 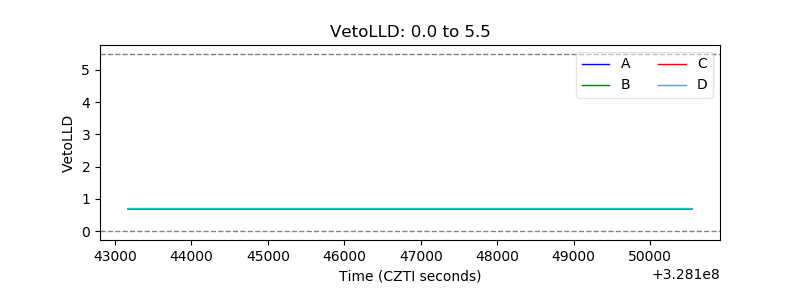 |
| Alpha Counter | 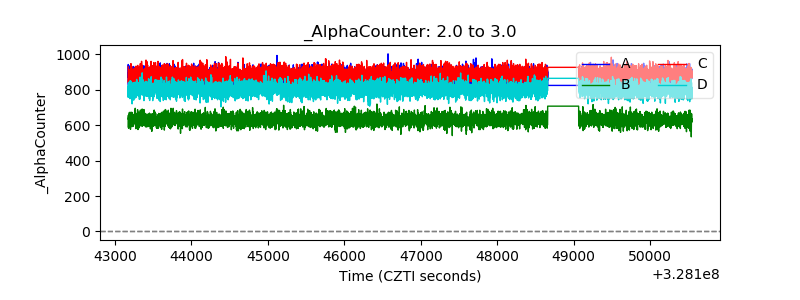 |
| _CPM_Rate | 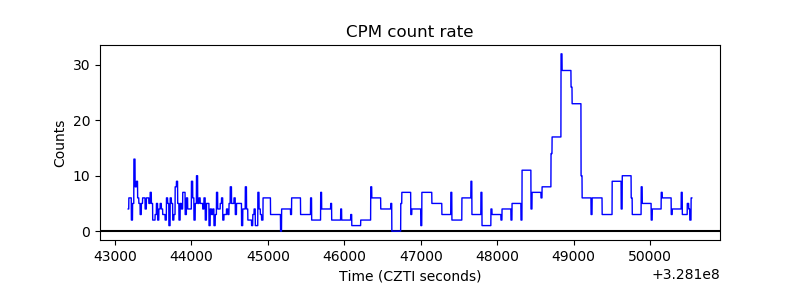 |
| CZT Counter | 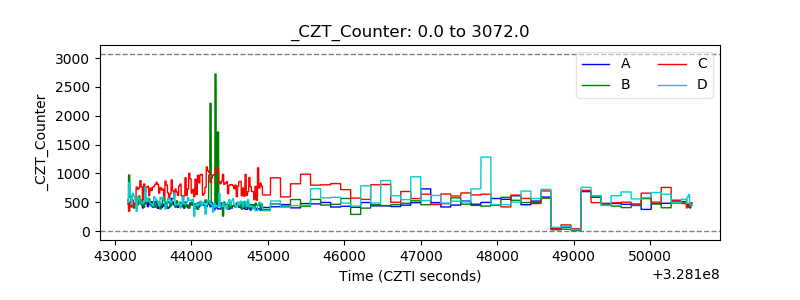 |
| +2.5 Volts monitor |  |
| +5 Volts monitor |  |
| _ROLL_ROT | 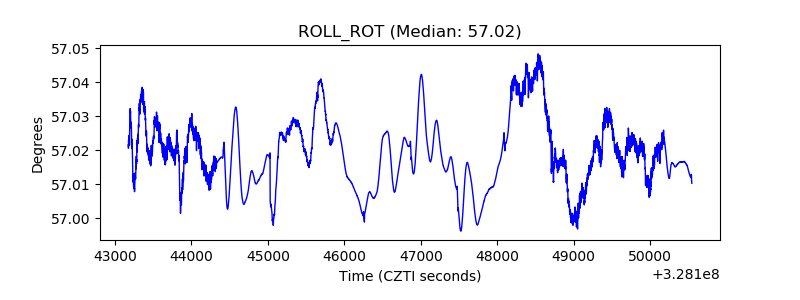 |
| _Roll_DEC | 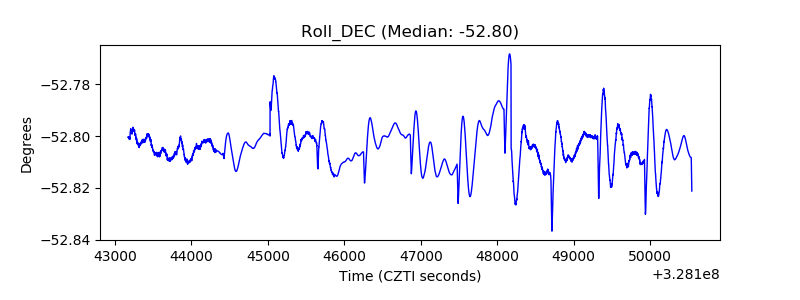 |
| _Roll_RA |  |
| Veto Counter | 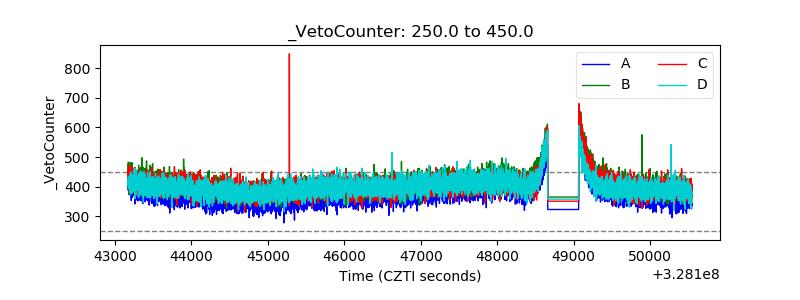 |