| Param | Original file | Final file |
|---|---|---|
| Filename | modeM0/AS1A07_027T01_9000003690_25191cztM0_level2.evt | modeM0/AS1A07_027T01_9000003690_25191cztM0_level2_quad_clean.evt |
| Size (bytes) | 538,920,000 | 103,069,440 |
| Size | 514.0 MB | 98.3 MB |
| Events in quadrant A | 3,594,649 | 659,787 |
| Events in quadrant B | 3,673,494 | 667,473 |
| Events in quadrant C | 3,770,454 | 635,231 |
| Events in quadrant D | 4,762,958 | 626,597 |
| Mode M9 | |||
|---|---|---|---|
| Quadrant | BADHDUFLAG | Total packets | Discarded packets |
| A | 0 | 6 | 0 |
| B | 0 | 6 | 0 |
| C | 0 | 6 | 0 |
| D | 0 | 6 | 0 |
| Mode M0 | |||
|---|---|---|---|
| Quadrant | BADHDUFLAG | Total packets | Discarded packets |
| A | 0 | 15708 | 0 |
| B | 0 | 15844 | 0 |
| C | 0 | 15899 | 0 |
| D | 0 | 19190 | 0 |
| Quadrant | Total seconds | Saturated seconds | Saturation percentage |
|---|---|---|---|
| A | 7650 | 104 | 1.359477% |
| B | 7650 | 148 | 1.934641% |
| C | 7650 | 198 | 2.588235% |
| D | 7651 | 157 | 2.052019% |
Noise dominated data is calculated using 1-second bins in cleaned event files. If a bin has >2000 counts, and if more than 50% of those come from <1% of pixels, then it is considered to be noise-dominated and hence unusable.
| Quadrant | # 1 sec bins | Bins with >0 counts | Bins with >2000 counts | High rate bins dominated by noise | Noise dominated (total time) | Noise dominated (detector-on time) | Marked lightcurve |
|---|---|---|---|---|---|---|---|
| A | 8310 | 7653 | 0 | 0 | 0.00% | 0.00% | 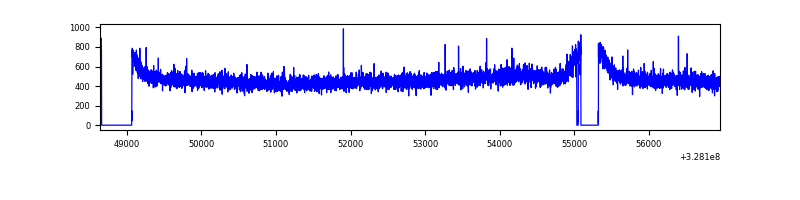 |
| B | 8310 | 7653 | 1 | 1 | 0.01% | 0.01% | 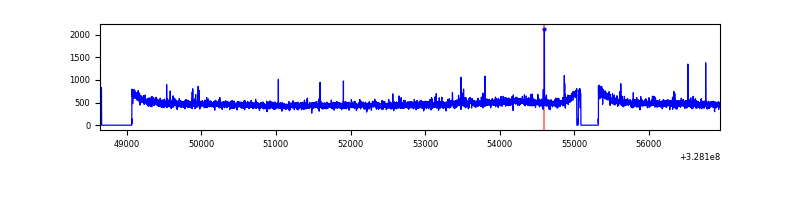 |
| C | 8310 | 7653 | 0 | 0 | 0.00% | 0.00% | 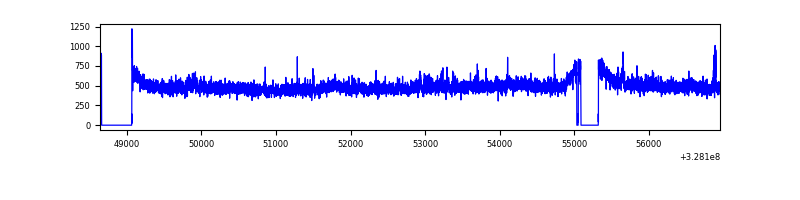 |
| D | 8311 | 7654 | 22 | 22 | 0.26% | 0.29% | 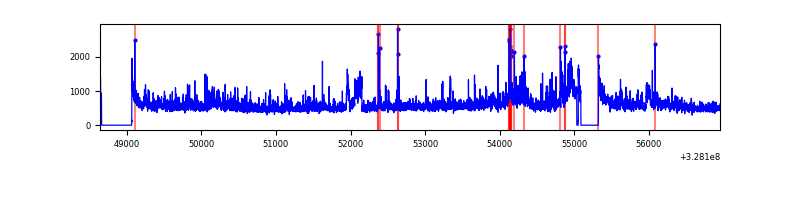 |
Top three noisy pixels from each quadrant. If the there are fewer than three noisy pixels in the level2.evt file, extra rows are filled as -1
| Pixel properties | Quadrant properties | ||||||
|---|---|---|---|---|---|---|---|
| Quadrant | DetID | PixID | Counts | Sigma | Mean | Median | Sigma |
| A | 13 | 254 | 12344 | 60.75 | 932 | 911 | 188.2 |
| A | 3 | 137 | 8801 | 41.92 | 932 | 911 | 188.2 |
| A | 0 | 226 | 7740 | 36.28 | 932 | 911 | 188.2 |
| B | 12 | 111 | 22266 | 120.22 | 926 | 901 | 177.7 |
| B | 11 | 111 | 20190 | 108.54 | 926 | 901 | 177.7 |
| B | 14 | 111 | 18081 | 96.67 | 926 | 901 | 177.7 |
| C | 14 | 238 | 143276 | 680.0 | 891 | 894 | 209.4 |
| C | 7 | 247 | 124114 | 588.48 | 891 | 894 | 209.4 |
| C | 9 | 54 | 25508 | 117.55 | 891 | 894 | 209.4 |
| D | 12 | 235 | 647429 | 2970.37 | 902 | 874 | 217.7 |
| D | 8 | 195 | 460205 | 2110.23 | 902 | 874 | 217.7 |
| D | 2 | 244 | 153080 | 699.26 | 902 | 874 | 217.7 |
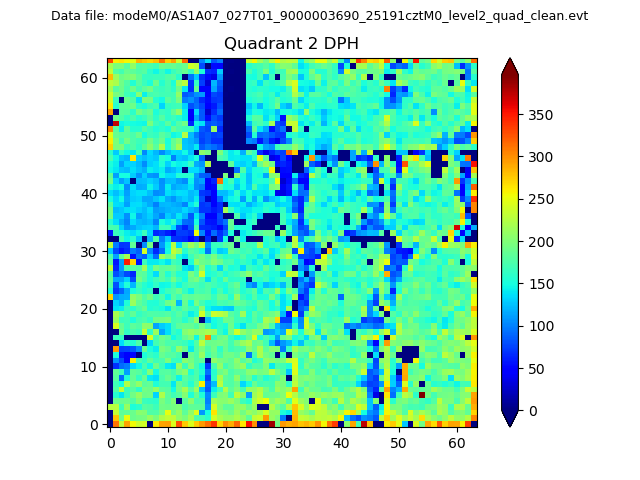
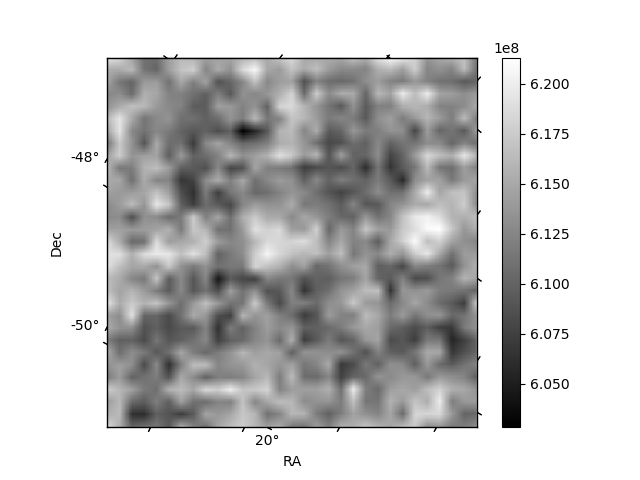
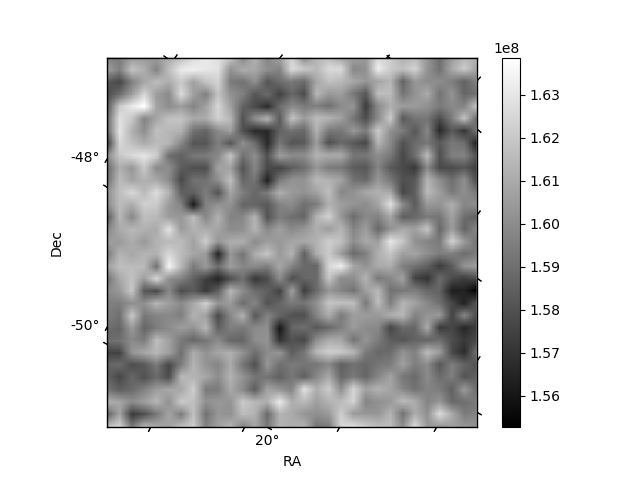
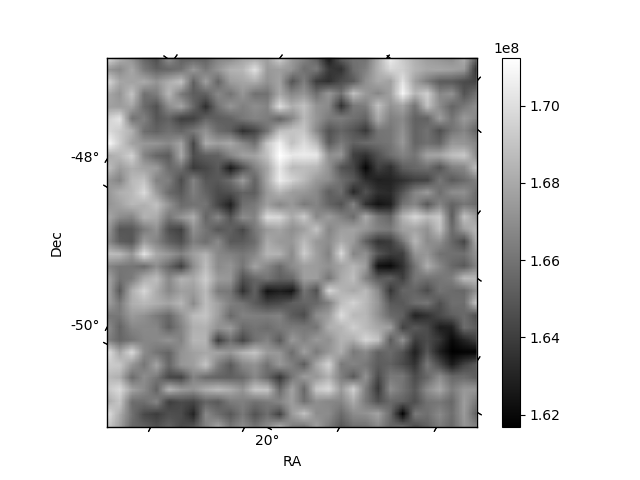
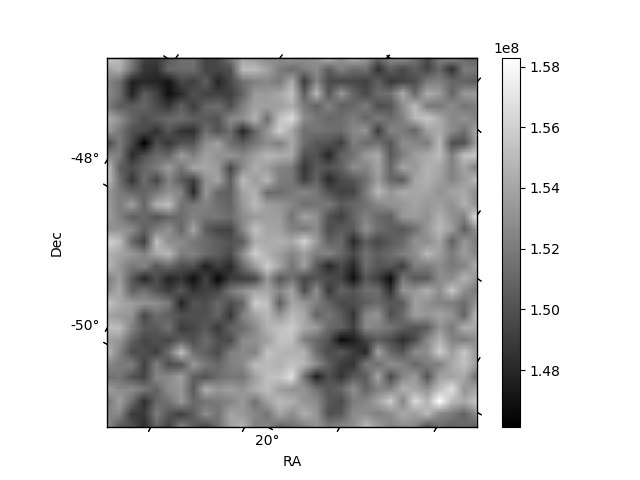
Histogram calculated using DETX and DETY for each event in the final _common_clean file
| Quadrant A | 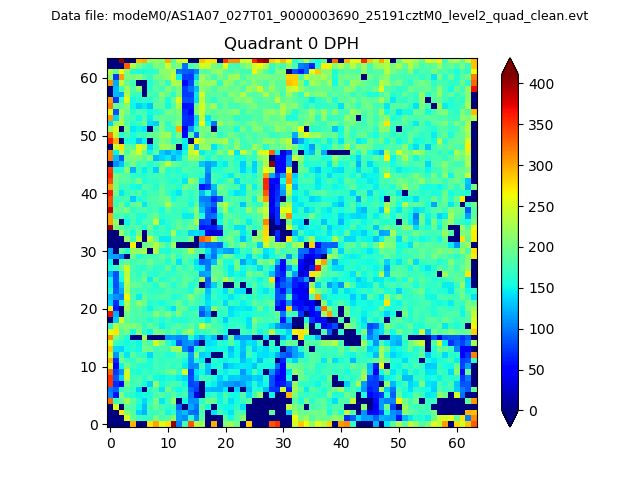 |
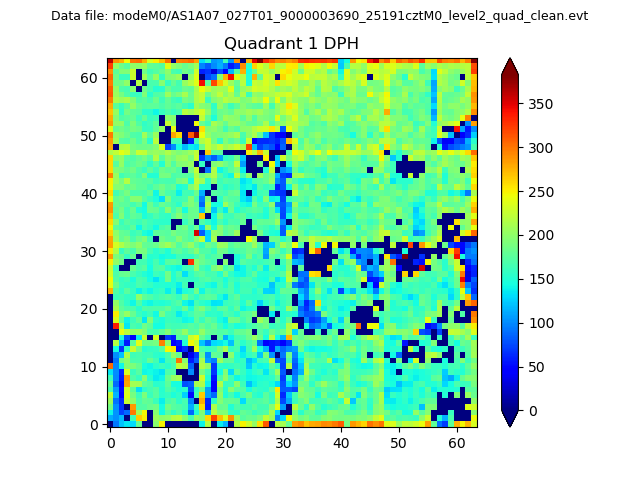 |
Quadrant B |
|---|---|---|---|
| Quadrant D | 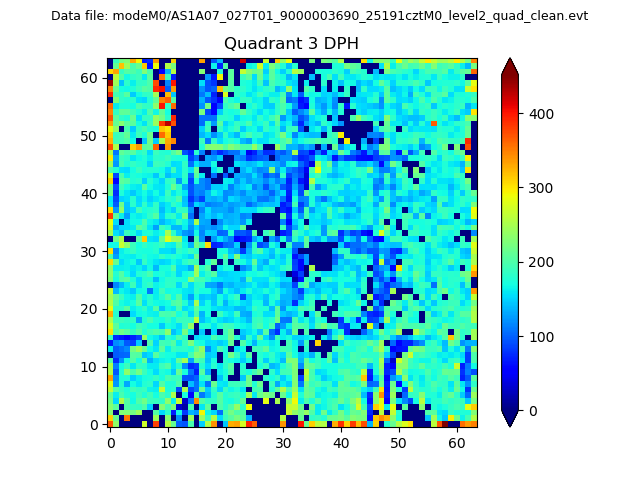 |
 |
Quadrant C |
| Plot type | Count rate plots | Images |
|---|---|---|
| Comparison with Poisson distribution Blue bars denote a histogram of data divided into 1 sec bins. Red curve is a Poisson curve with rate = median count rate of data. |
 |
 |
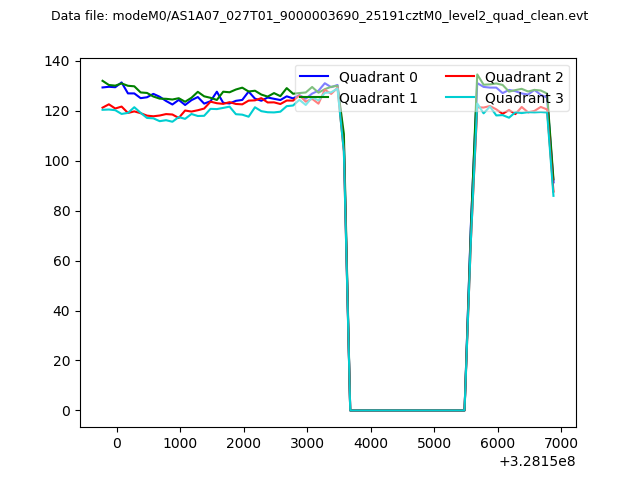
| Quadrant-wise count rates Data is divided into 100 sec bins |
 |
|
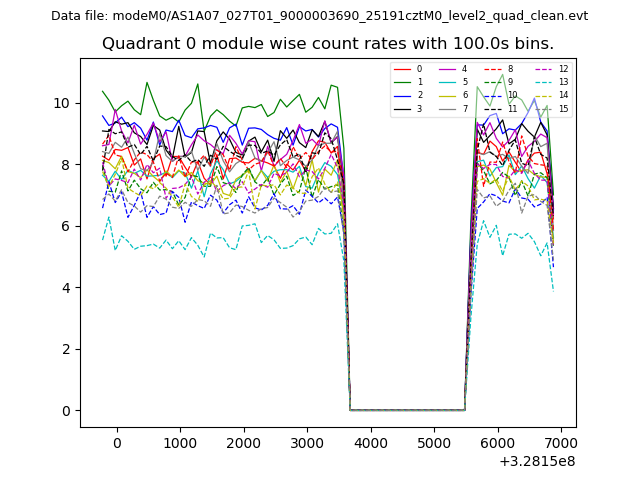
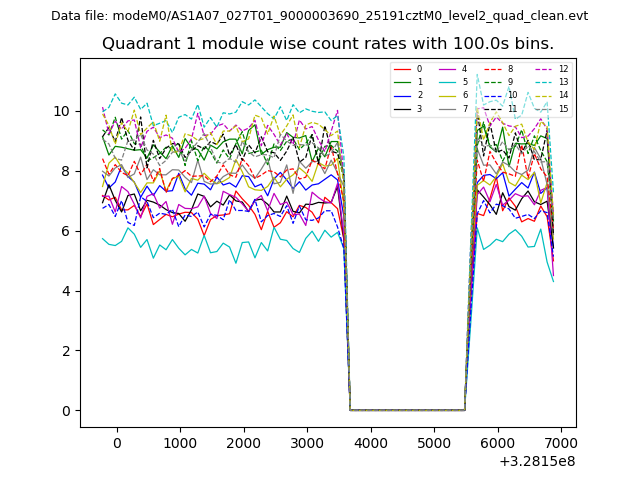
| Module-wise count rates for Quadrant A Data is divided into 100 sec bins |
 |
 |
| Module-wise count rates for Quadrant B Data is divided into 100 sec bins |
 |
 |
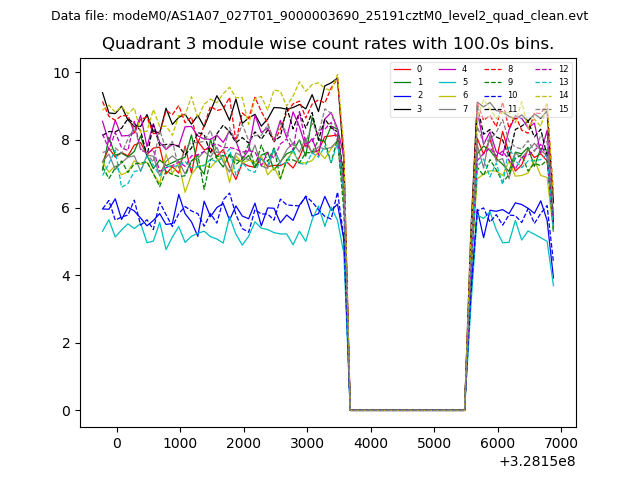
| Module-wise count rates for Quadrant C Data is divided into 100 sec bins |
 |
 |
| Module-wise count rates for Quadrant D Data is divided into 100 sec bins |
 |
 |
| Parameter | Plot |
|---|---|
| CZT HV Monitor | 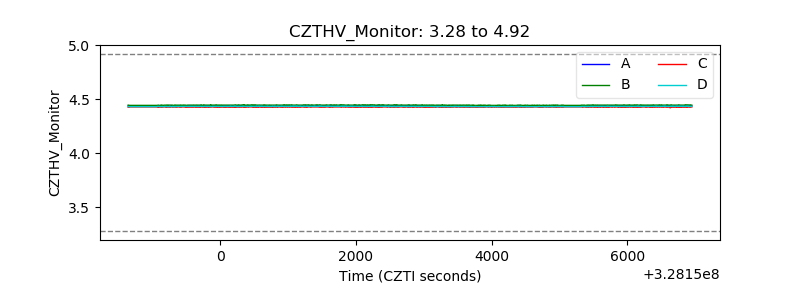 |
| D_VDD | 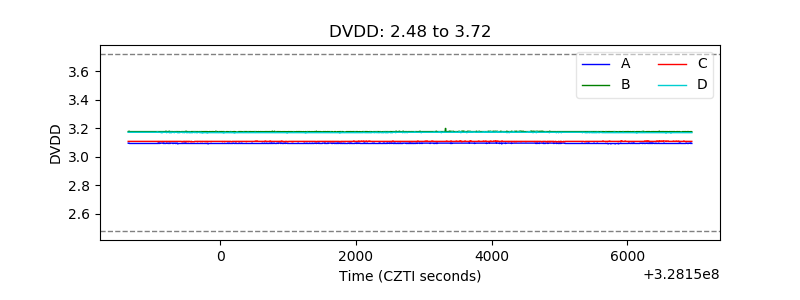 |
| Temperature 1 | 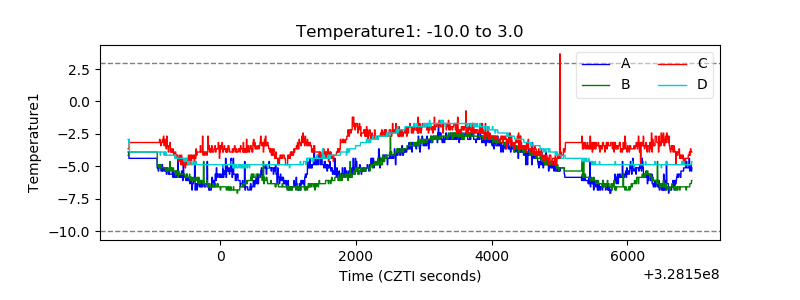 |
| Veto HV Monitor | 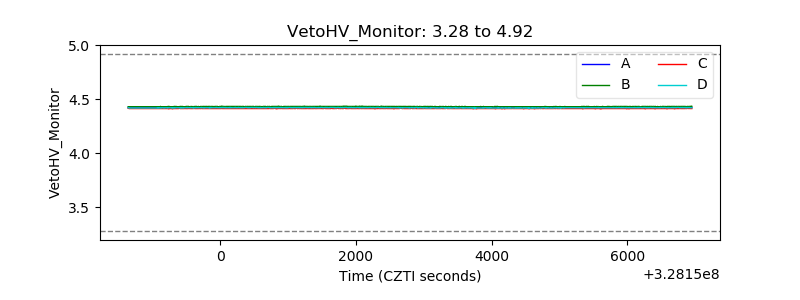 |
| Veto LLD | 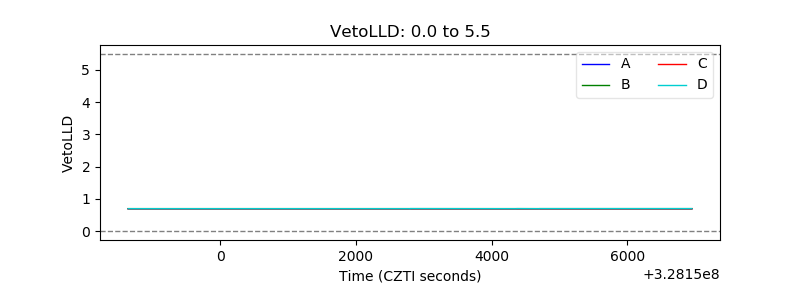 |
| Alpha Counter | 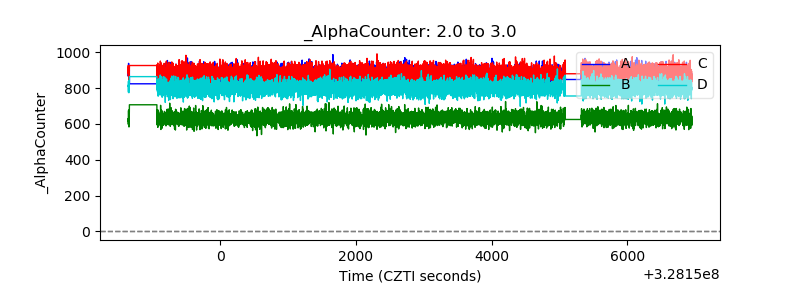 |
| _CPM_Rate | 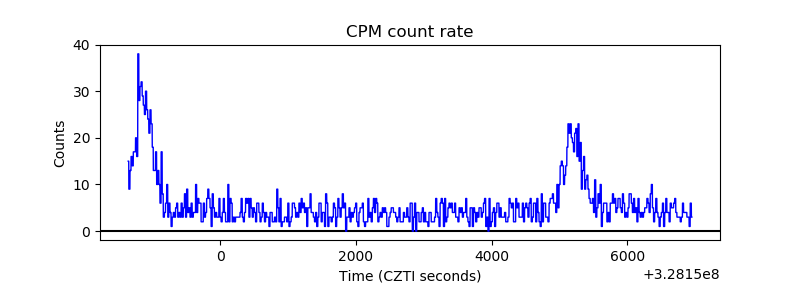 |
| CZT Counter | 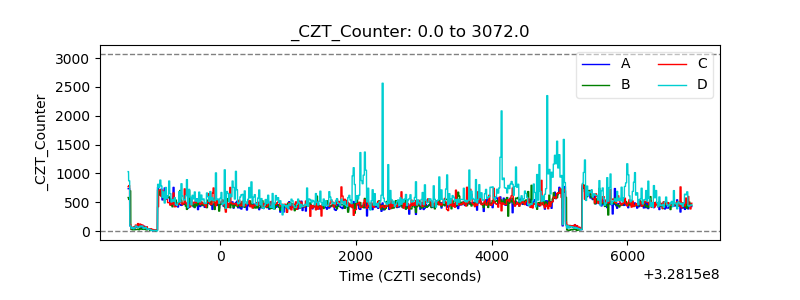 |
| +2.5 Volts monitor |  |
| +5 Volts monitor |  |
| _ROLL_ROT | 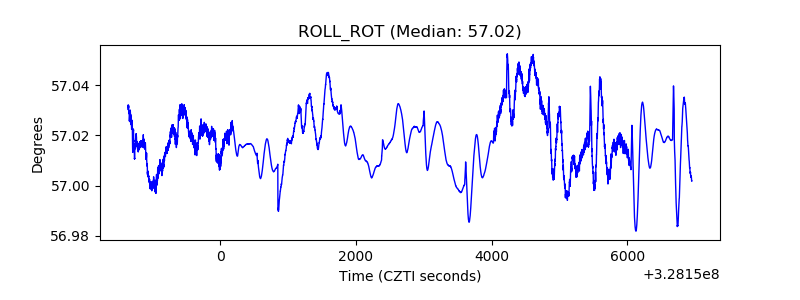 |
| _Roll_DEC | 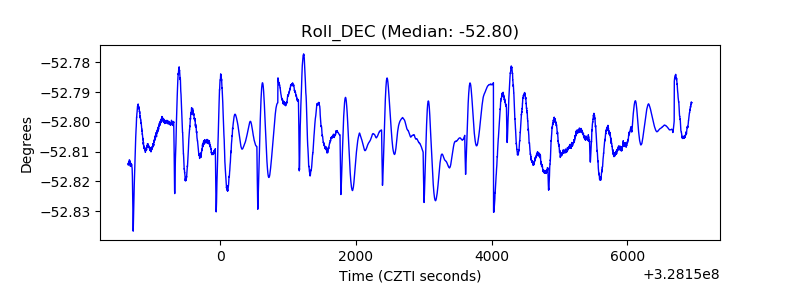 |
| _Roll_RA | 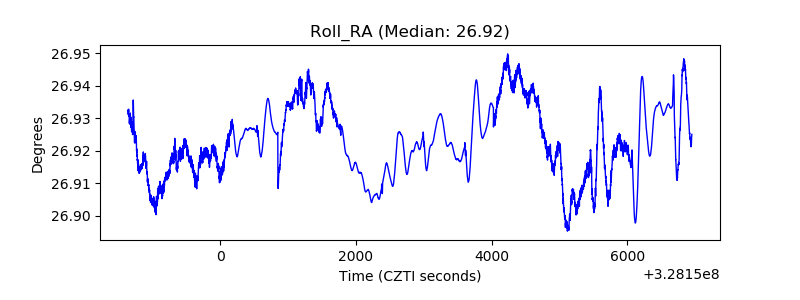 |
| Veto Counter |  |