| Param | Original file | Final file |
|---|---|---|
| Filename | modeM0/AS1A07_027T01_9000003690_25192cztM0_level2.evt | modeM0/AS1A07_027T01_9000003690_25192cztM0_level2_quad_clean.evt |
| Size (bytes) | 524,393,280 | 108,115,200 |
| Size | 500.1 MB | 103.1 MB |
| Events in quadrant A | 3,548,896 | 697,508 |
| Events in quadrant B | 3,637,258 | 706,881 |
| Events in quadrant C | 3,690,951 | 675,090 |
| Events in quadrant D | 4,488,668 | 666,717 |
| Mode M9 | |||
|---|---|---|---|
| Quadrant | BADHDUFLAG | Total packets | Discarded packets |
| A | 0 | 4 | 0 |
| B | 0 | 5 | 0 |
| C | 0 | 5 | 0 |
| D | 0 | 5 | 0 |
| Mode M0 | |||
|---|---|---|---|
| Quadrant | BADHDUFLAG | Total packets | Discarded packets |
| A | 0 | 15527 | 0 |
| B | 0 | 15659 | 0 |
| C | 0 | 15676 | 0 |
| D | 0 | 18317 | 0 |
| Quadrant | Total seconds | Saturated seconds | Saturation percentage |
|---|---|---|---|
| A | 7591 | 75 | 0.988012% |
| B | 7591 | 108 | 1.422737% |
| C | 7591 | 175 | 2.305362% |
| D | 7591 | 108 | 1.422737% |
Noise dominated data is calculated using 1-second bins in cleaned event files. If a bin has >2000 counts, and if more than 50% of those come from <1% of pixels, then it is considered to be noise-dominated and hence unusable.
| Quadrant | # 1 sec bins | Bins with >0 counts | Bins with >2000 counts | High rate bins dominated by noise | Noise dominated (total time) | Noise dominated (detector-on time) | Marked lightcurve |
|---|---|---|---|---|---|---|---|
| A | 8011 | 7592 | 0 | 0 | 0.00% | 0.00% | 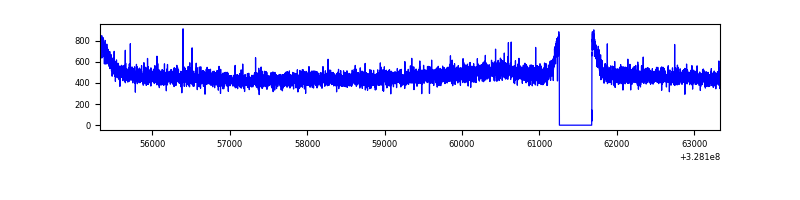 |
| B | 8011 | 7592 | 0 | 0 | 0.00% | 0.00% | 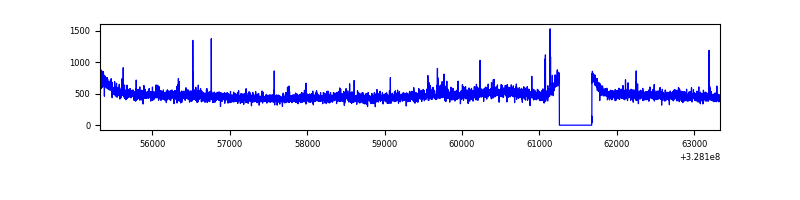 |
| C | 8011 | 7592 | 0 | 0 | 0.00% | 0.00% | 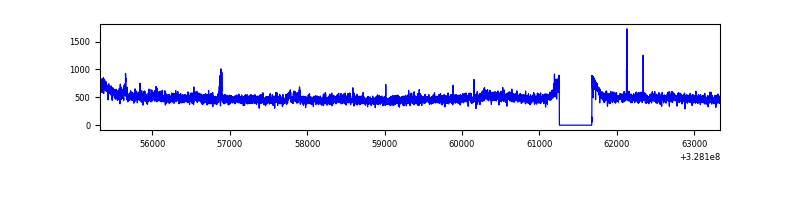 |
| D | 8011 | 7592 | 13 | 13 | 0.16% | 0.17% | 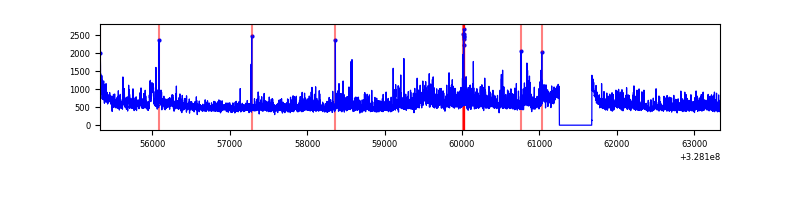 |
Top three noisy pixels from each quadrant. If the there are fewer than three noisy pixels in the level2.evt file, extra rows are filled as -1
| Pixel properties | Quadrant properties | ||||||
|---|---|---|---|---|---|---|---|
| Quadrant | DetID | PixID | Counts | Sigma | Mean | Median | Sigma |
| A | 13 | 254 | 11728 | 58.26 | 920 | 898 | 185.9 |
| A | 3 | 137 | 8765 | 42.32 | 920 | 898 | 185.9 |
| A | 0 | 226 | 7790 | 37.08 | 920 | 898 | 185.9 |
| B | 12 | 111 | 21979 | 119.0 | 916 | 889 | 177.2 |
| B | 11 | 111 | 19910 | 107.33 | 916 | 889 | 177.2 |
| B | 3 | 64 | 19345 | 104.14 | 916 | 889 | 177.2 |
| C | 14 | 238 | 142119 | 674.59 | 887 | 890 | 209.4 |
| C | 7 | 247 | 38065 | 177.57 | 887 | 890 | 209.4 |
| C | 9 | 54 | 25285 | 116.52 | 887 | 890 | 209.4 |
| D | 8 | 195 | 573885 | 2643.18 | 897 | 869 | 216.8 |
| D | 12 | 235 | 396815 | 1826.4 | 897 | 869 | 216.8 |
| D | 12 | 233 | 40568 | 183.12 | 897 | 869 | 216.8 |
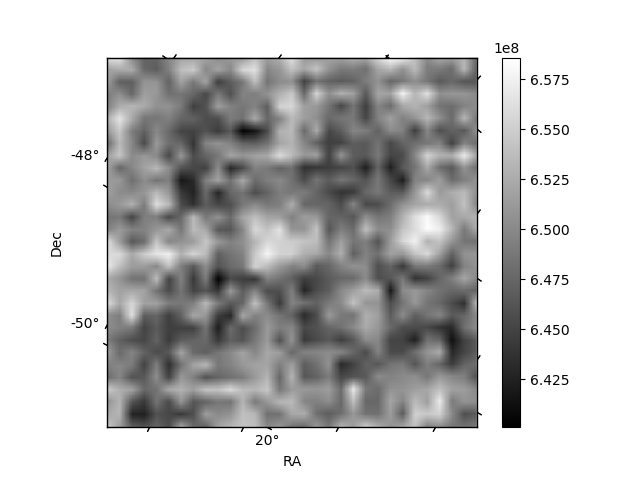
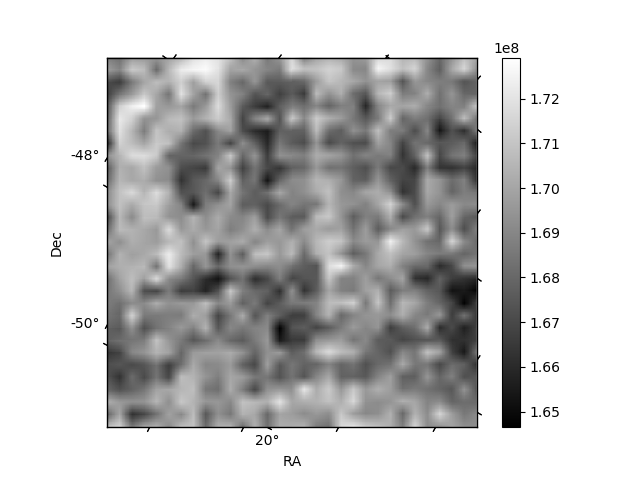
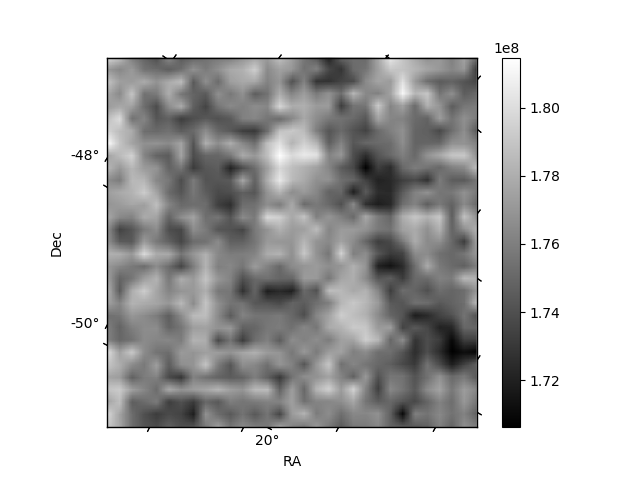
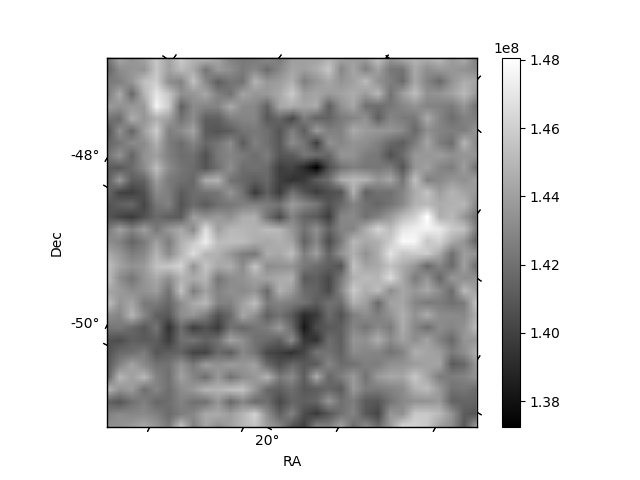
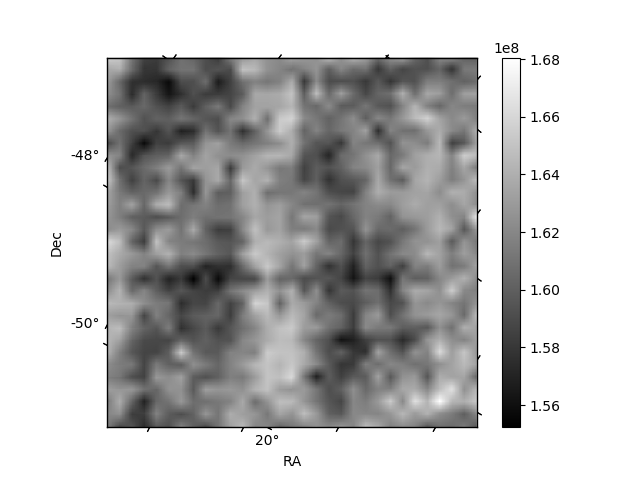
Histogram calculated using DETX and DETY for each event in the final _common_clean file
| Quadrant A | 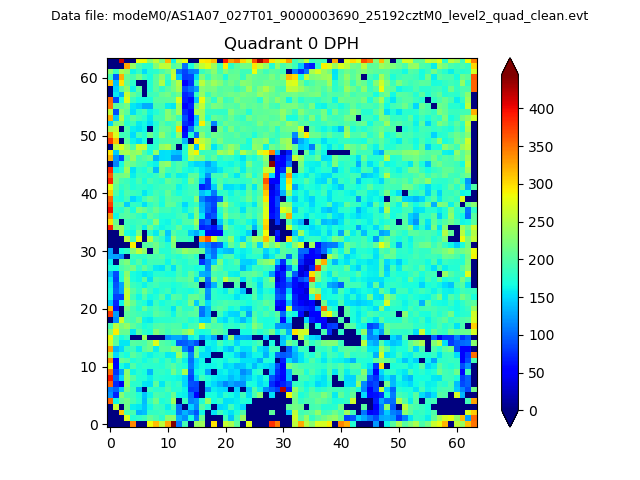 |
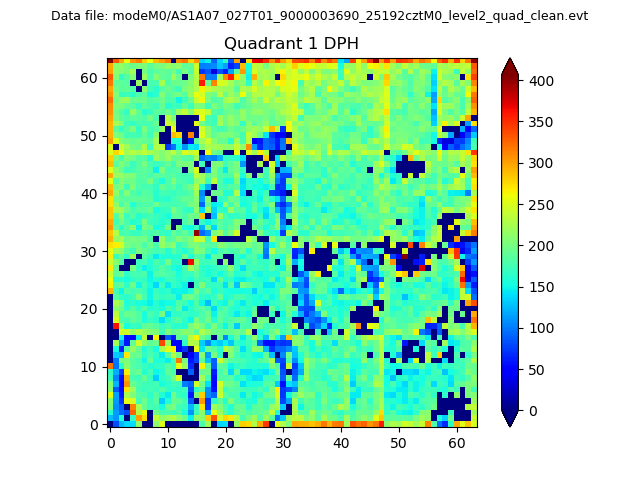 |
Quadrant B |
|---|---|---|---|
| Quadrant D | 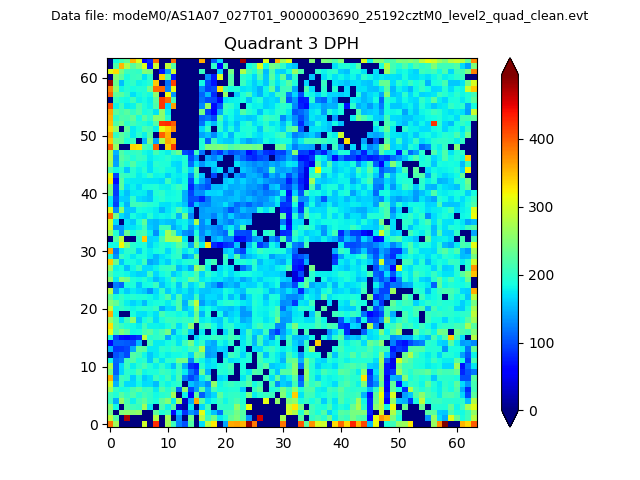 |
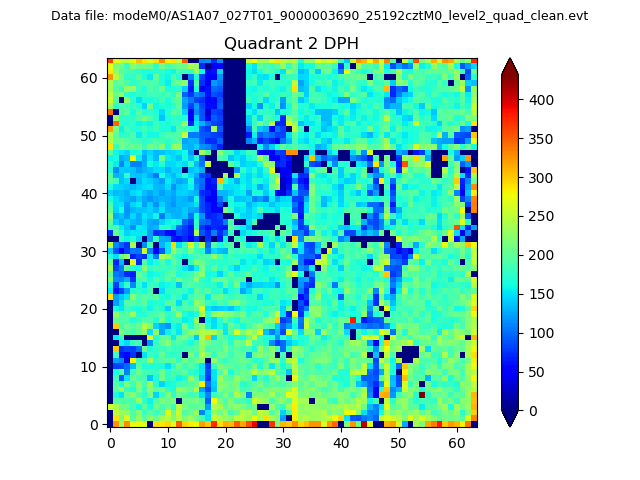 |
Quadrant C |
| Plot type | Count rate plots | Images |
|---|---|---|
| Comparison with Poisson distribution Blue bars denote a histogram of data divided into 1 sec bins. Red curve is a Poisson curve with rate = median count rate of data. |
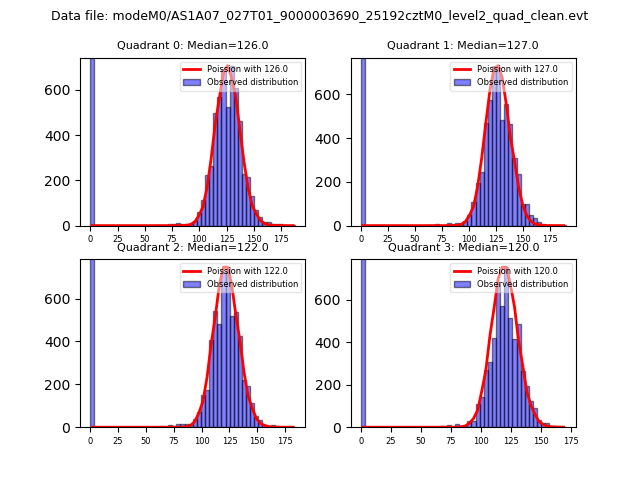 |
 |
| Quadrant-wise count rates Data is divided into 100 sec bins |
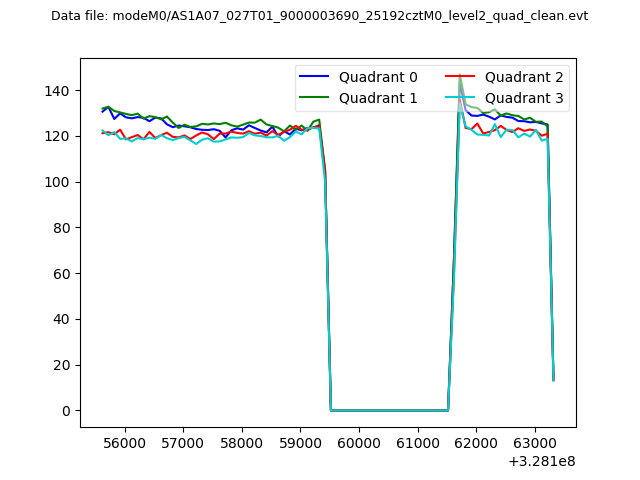 |
|
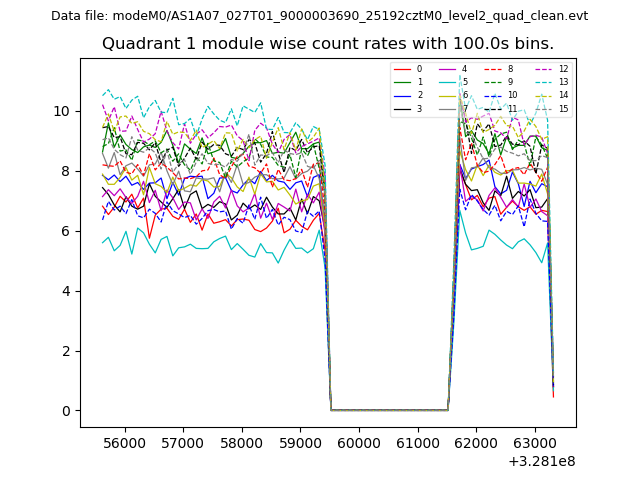
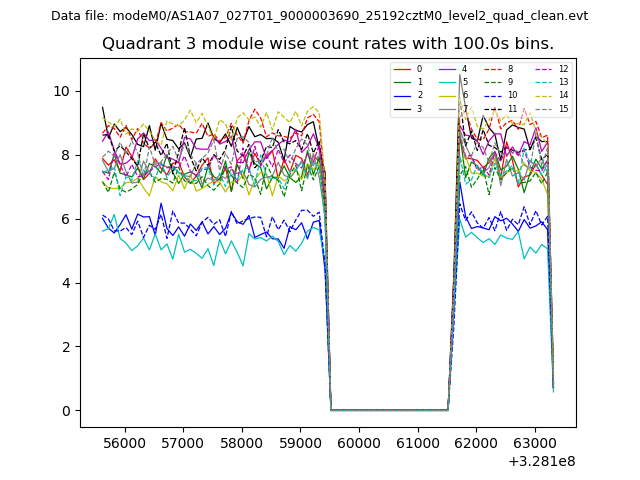
| Module-wise count rates for Quadrant A Data is divided into 100 sec bins |
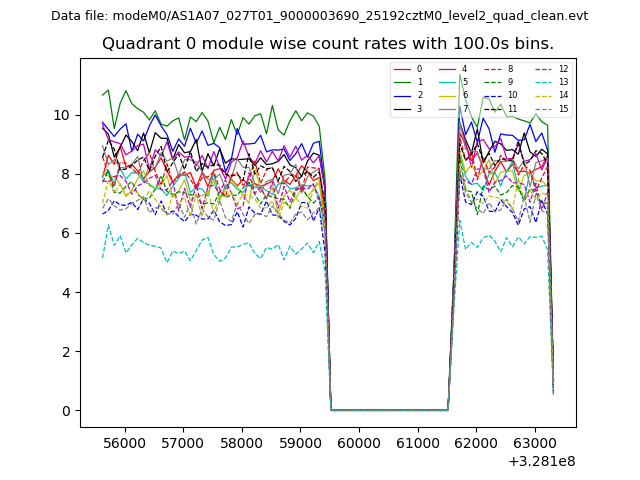 |
 |
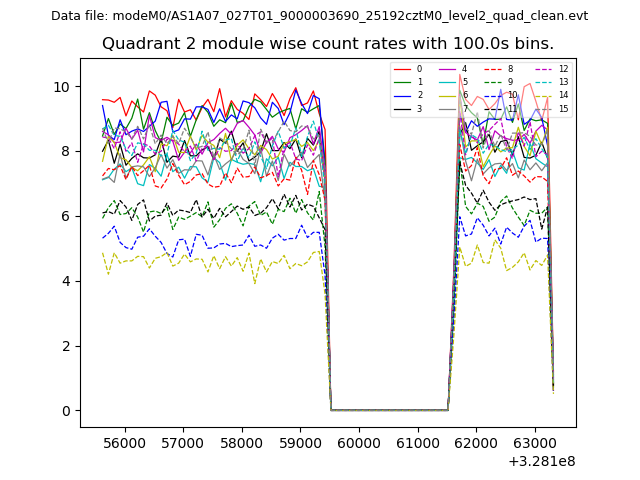
| Module-wise count rates for Quadrant B Data is divided into 100 sec bins |
 |
 |
| Module-wise count rates for Quadrant C Data is divided into 100 sec bins |
 |
 |
| Module-wise count rates for Quadrant D Data is divided into 100 sec bins |
 |
 |
| Parameter | Plot |
|---|---|
| CZT HV Monitor | 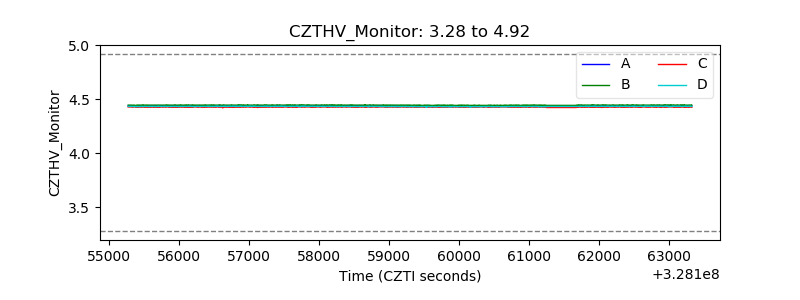 |
| D_VDD | 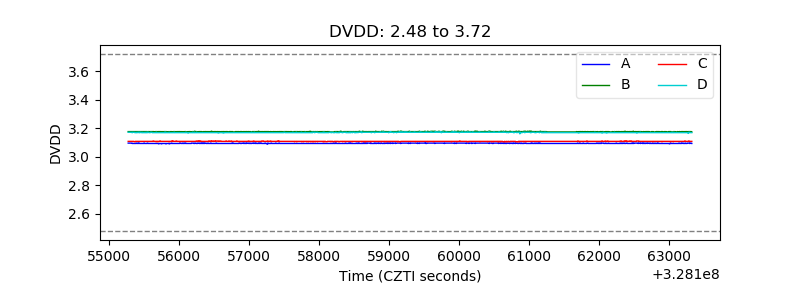 |
| Temperature 1 | 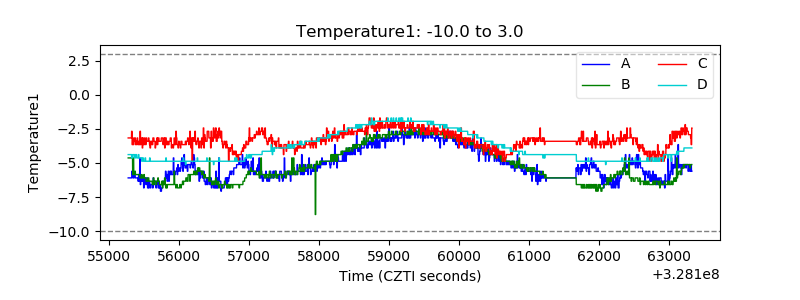 |
| Veto HV Monitor |  |
| Veto LLD | 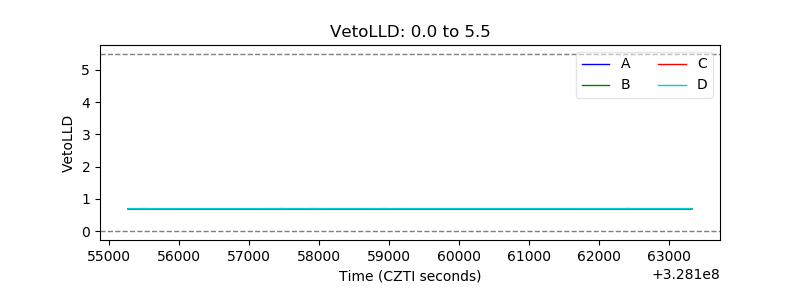 |
| Alpha Counter |  |
| _CPM_Rate | 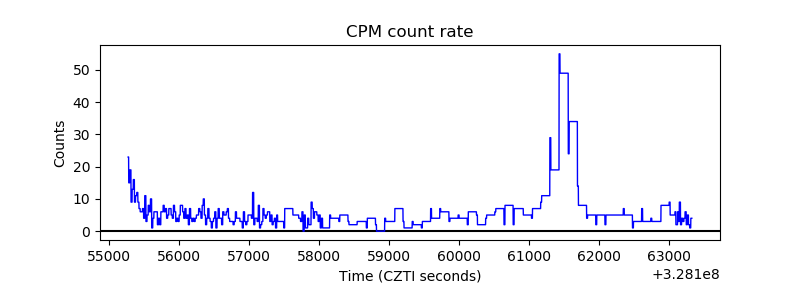 |
| CZT Counter | 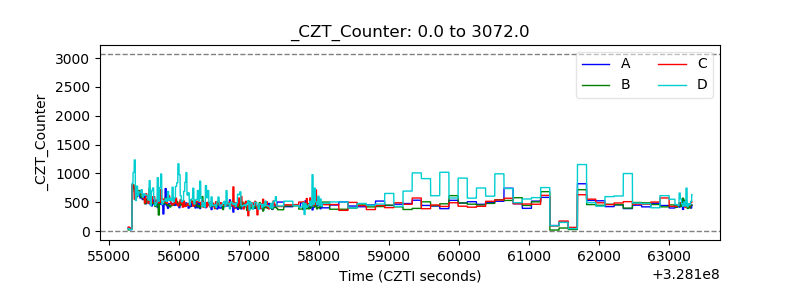 |
| +2.5 Volts monitor |  |
| +5 Volts monitor |  |
| _ROLL_ROT | 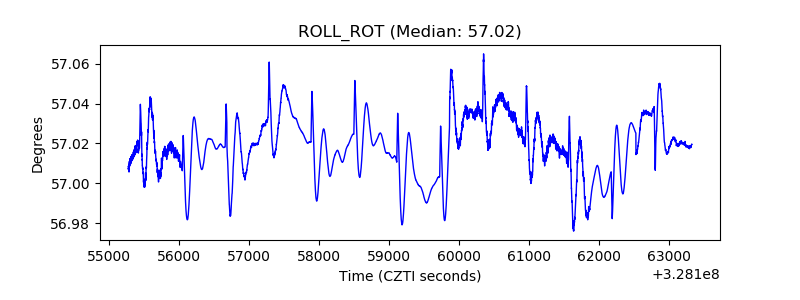 |
| _Roll_DEC | 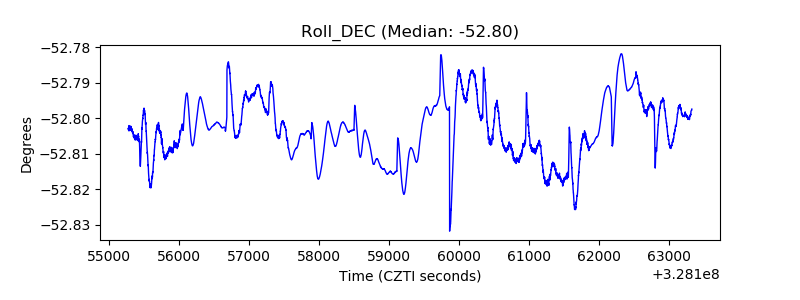 |
| _Roll_RA | 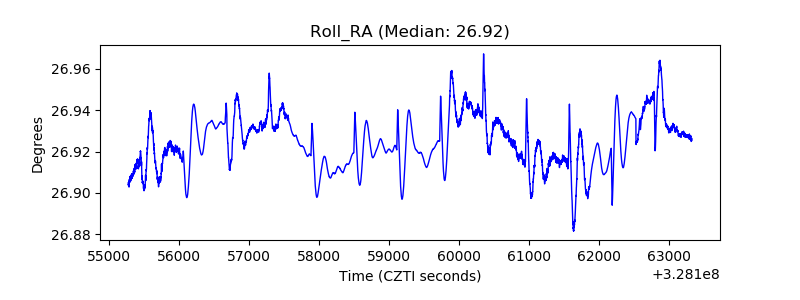 |
| Veto Counter | 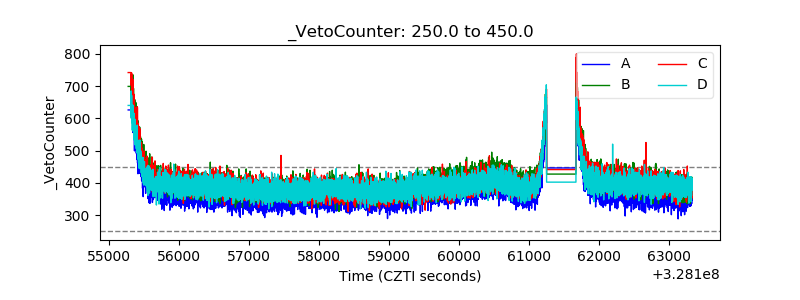 |