| Param | Original file | Final file |
|---|---|---|
| Filename | modeM0/AS1A07_027T01_9000003690_25194cztM0_level2.evt | modeM0/AS1A07_027T01_9000003690_25194cztM0_level2_quad_clean.evt |
| Size (bytes) | 888,750,720 | 172,762,560 |
| Size | 847.6 MB | 164.8 MB |
| Events in quadrant A | 5,874,503 | 1,102,973 |
| Events in quadrant B | 6,710,354 | 1,115,002 |
| Events in quadrant C | 6,106,528 | 1,079,990 |
| Events in quadrant D | 7,367,864 | 1,059,776 |
| Mode M9 | |||
|---|---|---|---|
| Quadrant | BADHDUFLAG | Total packets | Discarded packets |
| A | 0 | 14 | 0 |
| B | 0 | 14 | 0 |
| C | 0 | 14 | 0 |
| D | 0 | 14 | 0 |
| Mode M0 | |||
|---|---|---|---|
| Quadrant | BADHDUFLAG | Total packets | Discarded packets |
| A | 0 | 25664 | 0 |
| B | 0 | 28173 | 0 |
| C | 0 | 25957 | 0 |
| D | 0 | 29967 | 0 |
| Quadrant | Total seconds | Saturated seconds | Saturation percentage |
|---|---|---|---|
| A | 12658 | 69 | 0.545110% |
| B | 12659 | 310 | 2.448851% |
| C | 12659 | 159 | 1.256023% |
| D | 12659 | 158 | 1.248124% |
Noise dominated data is calculated using 1-second bins in cleaned event files. If a bin has >2000 counts, and if more than 50% of those come from <1% of pixels, then it is considered to be noise-dominated and hence unusable.
| Quadrant | # 1 sec bins | Bins with >0 counts | Bins with >2000 counts | High rate bins dominated by noise | Noise dominated (total time) | Noise dominated (detector-on time) | Marked lightcurve |
|---|---|---|---|---|---|---|---|
| A | 14013 | 12660 | 0 | 0 | 0.00% | 0.00% | 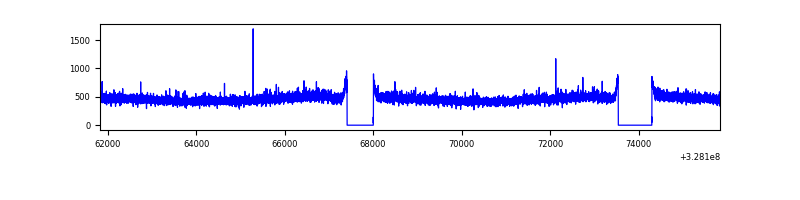 |
| B | 14014 | 12661 | 122 | 122 | 0.87% | 0.96% | 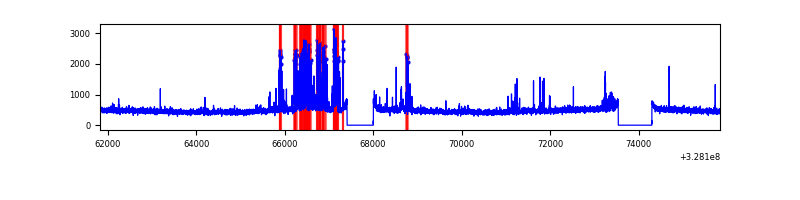 |
| C | 14014 | 12661 | 4 | 4 | 0.03% | 0.03% | 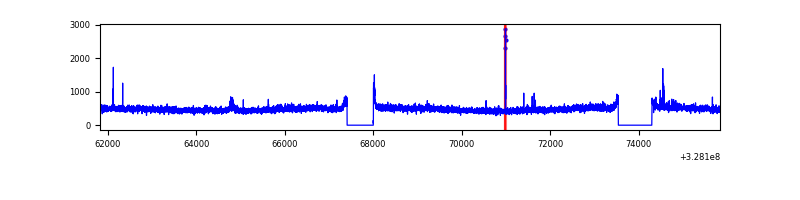 |
| D | 14014 | 12661 | 91 | 91 | 0.65% | 0.72% | 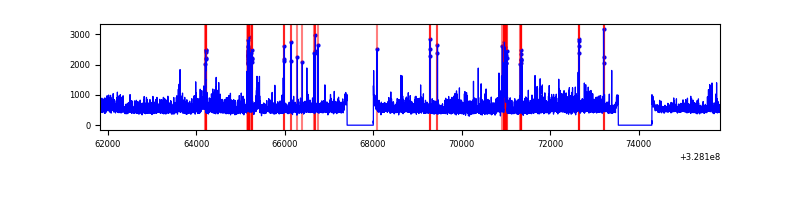 |
Top three noisy pixels from each quadrant. If the there are fewer than three noisy pixels in the level2.evt file, extra rows are filled as -1
| Pixel properties | Quadrant properties | ||||||
|---|---|---|---|---|---|---|---|
| Quadrant | DetID | PixID | Counts | Sigma | Mean | Median | Sigma |
| A | 13 | 254 | 18956 | 57.47 | 1521 | 1489 | 304.0 |
| A | 3 | 137 | 14400 | 42.48 | 1521 | 1489 | 304.0 |
| A | 0 | 226 | 12929 | 37.64 | 1521 | 1489 | 304.0 |
| B | 3 | 64 | 684083 | 2397.75 | 1497 | 1458 | 284.7 |
| B | 4 | 80 | 56206 | 192.3 | 1497 | 1458 | 284.7 |
| B | 0 | 190 | 44906 | 152.61 | 1497 | 1458 | 284.7 |
| C | 14 | 238 | 232613 | 674.66 | 1467 | 1476 | 342.6 |
| C | 8 | 208 | 73305 | 209.66 | 1467 | 1476 | 342.6 |
| C | 7 | 247 | 51365 | 145.62 | 1467 | 1476 | 342.6 |
| D | 8 | 195 | 906611 | 2514.04 | 1494 | 1452 | 360.0 |
| D | 12 | 235 | 447608 | 1239.18 | 1494 | 1452 | 360.0 |
| D | 2 | 244 | 203498 | 561.17 | 1494 | 1452 | 360.0 |
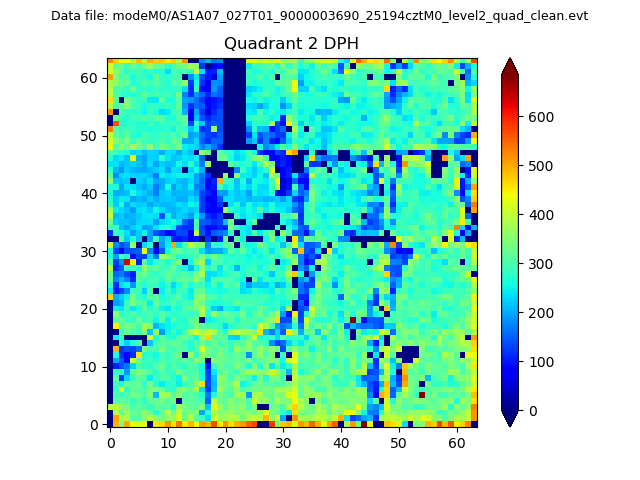
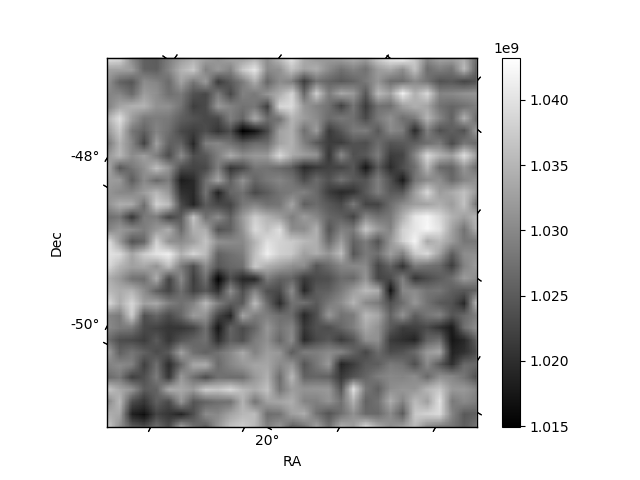
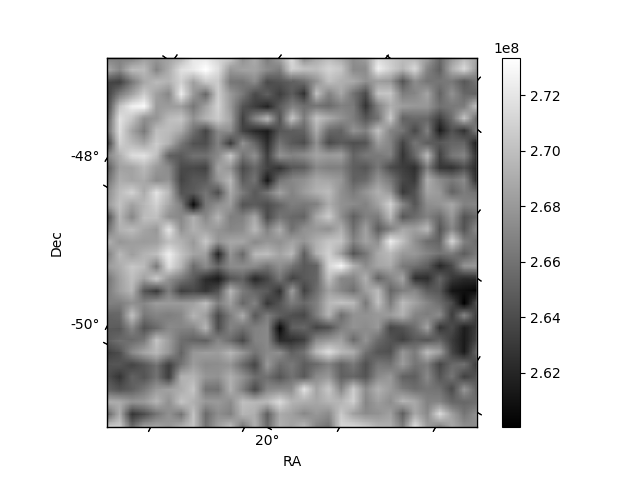
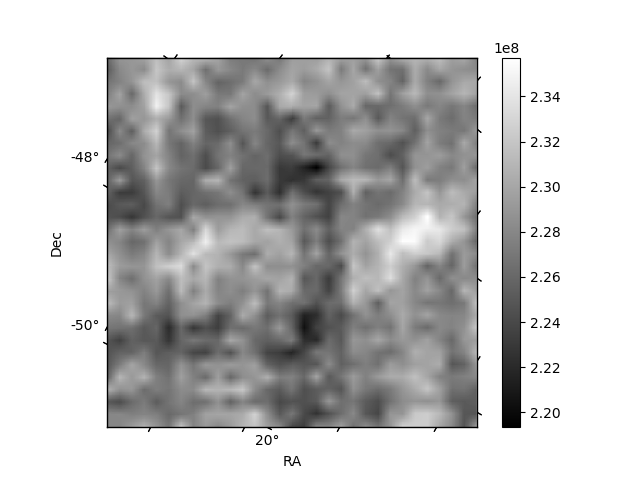
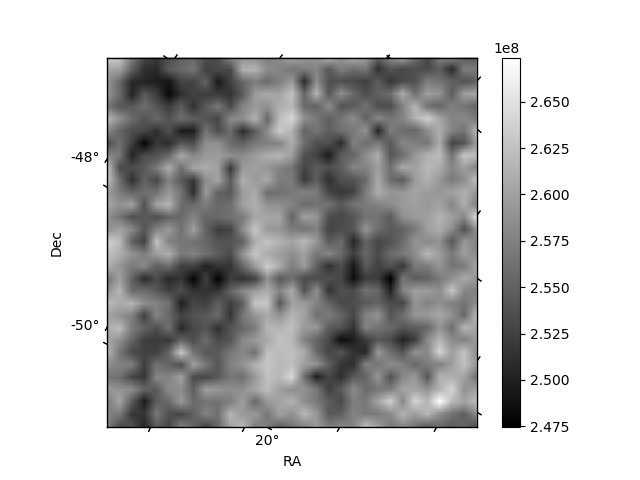
Histogram calculated using DETX and DETY for each event in the final _common_clean file
| Quadrant A | 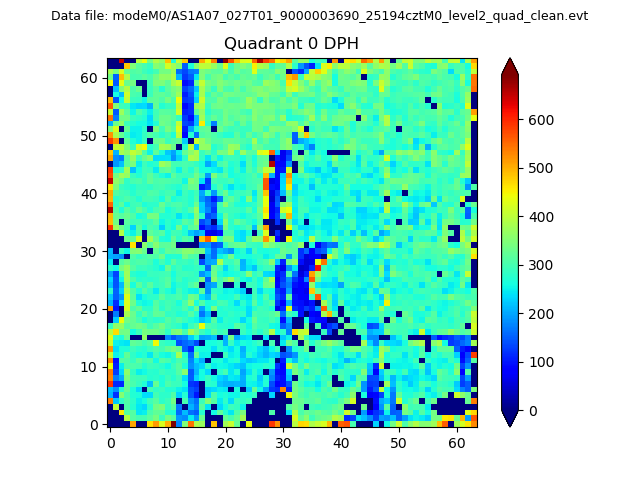 |
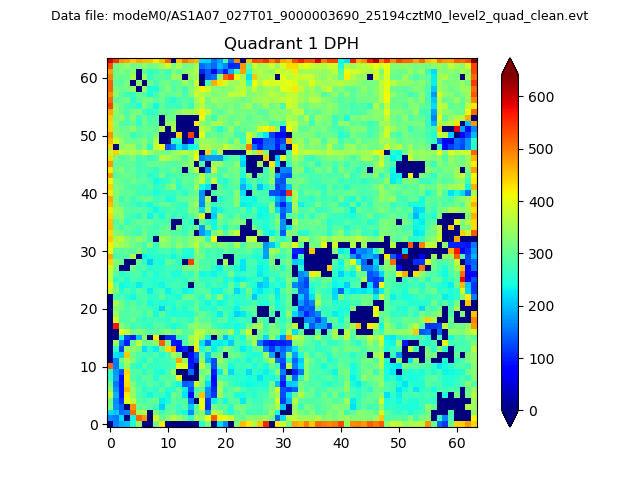 |
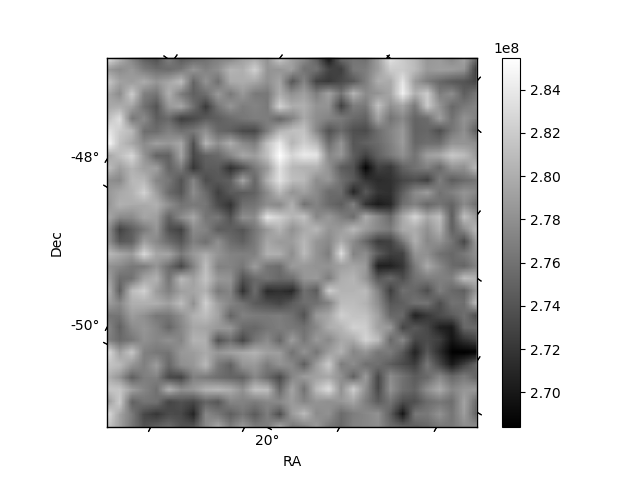
Quadrant B |
|---|---|---|---|
| Quadrant D | 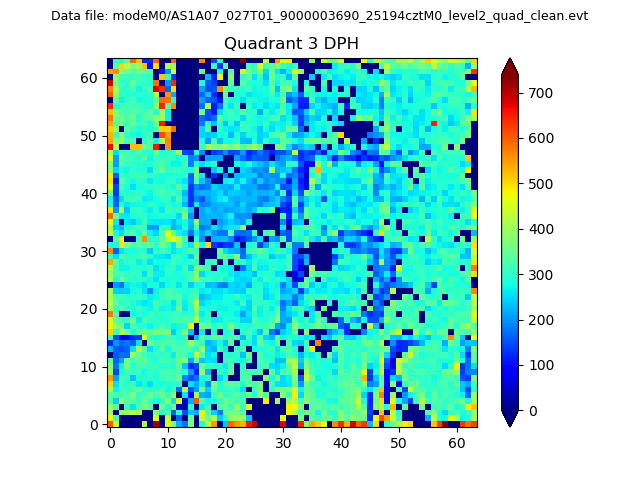 |
 |
Quadrant C |
| Plot type | Count rate plots | Images |
|---|---|---|
| Comparison with Poisson distribution Blue bars denote a histogram of data divided into 1 sec bins. Red curve is a Poisson curve with rate = median count rate of data. |
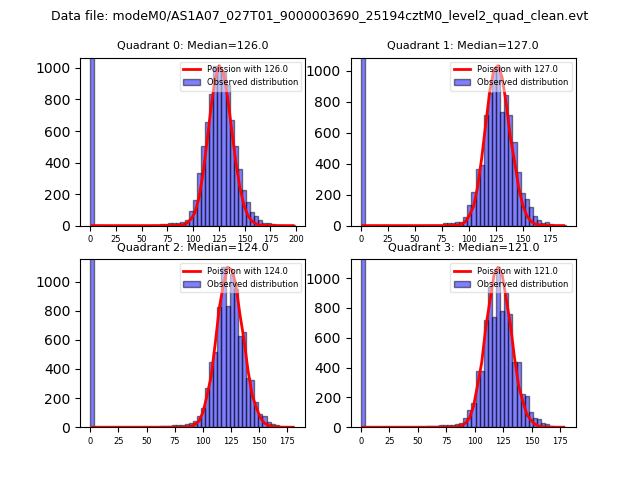 |
 |
| Quadrant-wise count rates Data is divided into 100 sec bins |
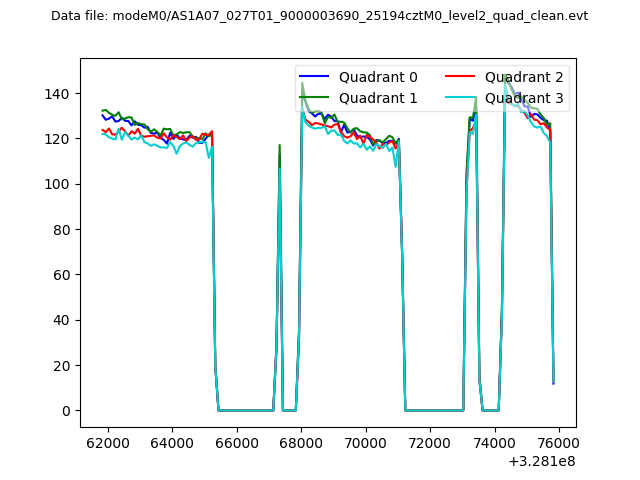 |
|
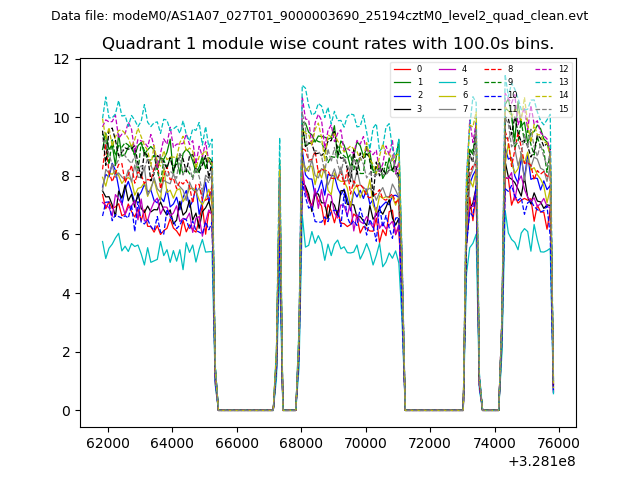
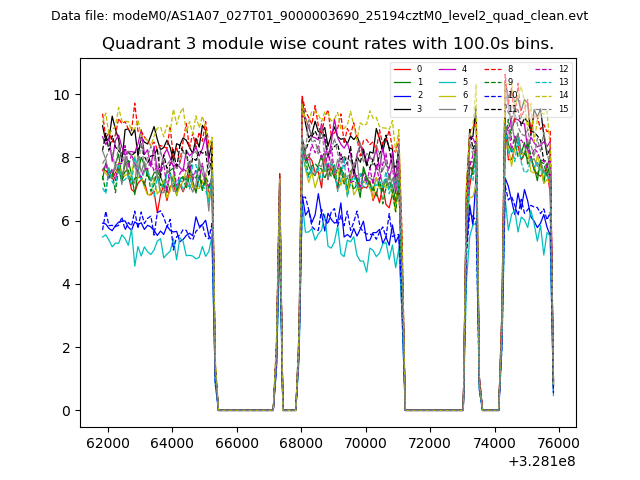
| Module-wise count rates for Quadrant A Data is divided into 100 sec bins |
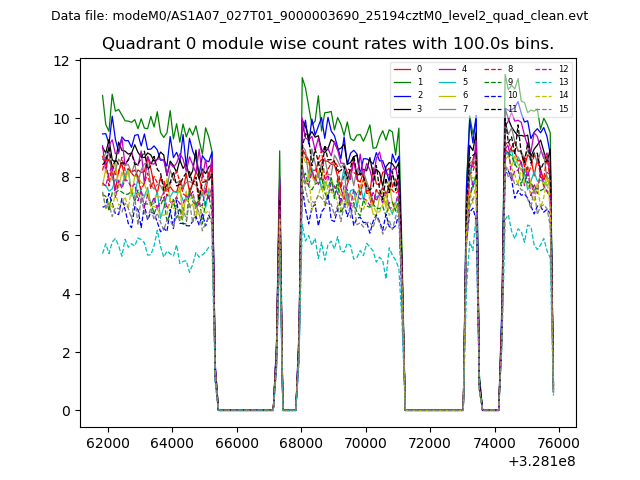 |
 |
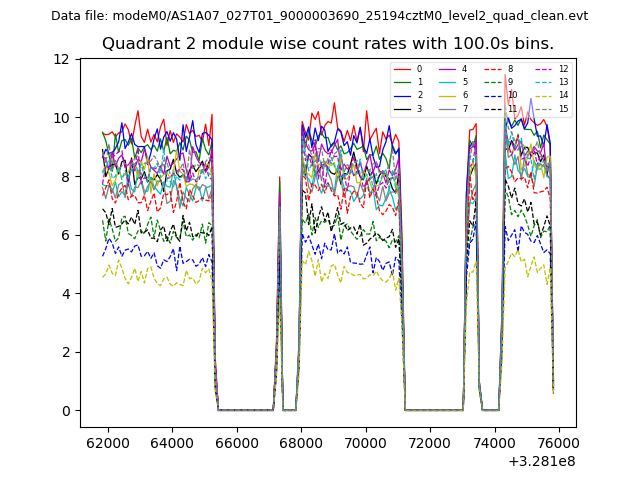
| Module-wise count rates for Quadrant B Data is divided into 100 sec bins |
 |
 |
| Module-wise count rates for Quadrant C Data is divided into 100 sec bins |
 |
 |
| Module-wise count rates for Quadrant D Data is divided into 100 sec bins |
 |
 |
| Parameter | Plot |
|---|---|
| CZT HV Monitor | 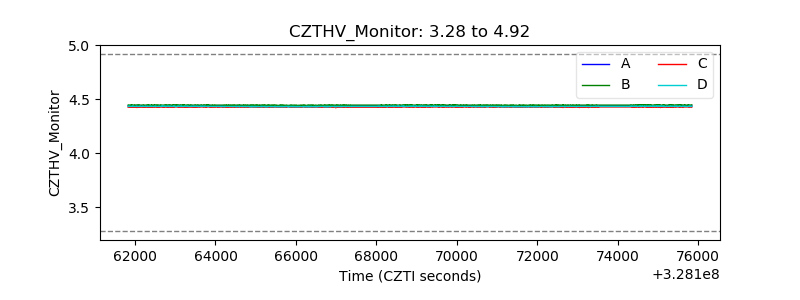 |
| D_VDD | 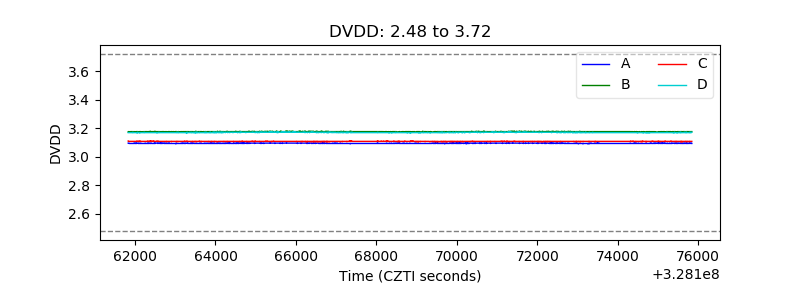 |
| Temperature 1 | 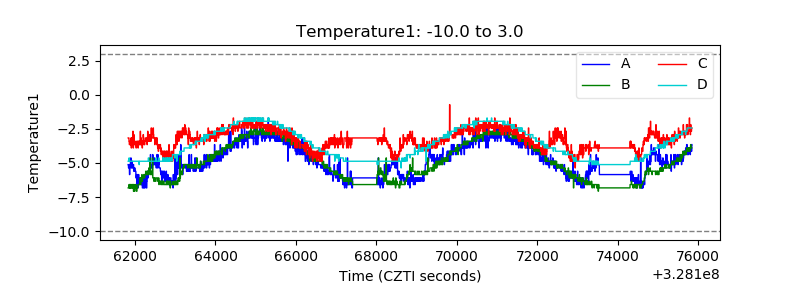 |
| Veto HV Monitor |  |
| Veto LLD | 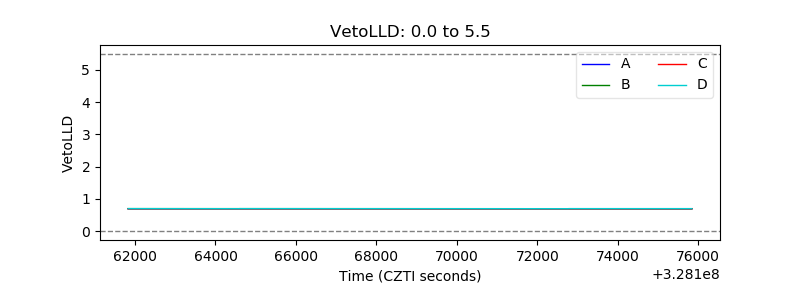 |
| Alpha Counter |  |
| _CPM_Rate | 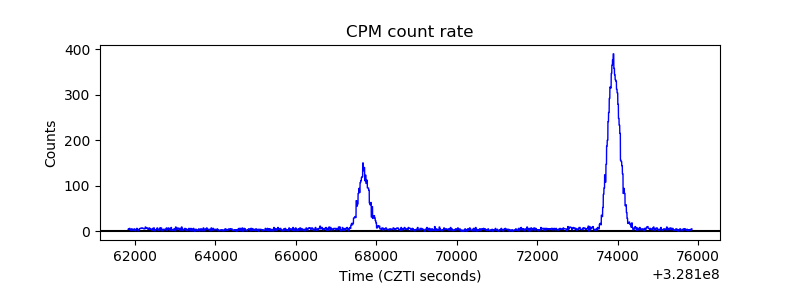 |
| CZT Counter | 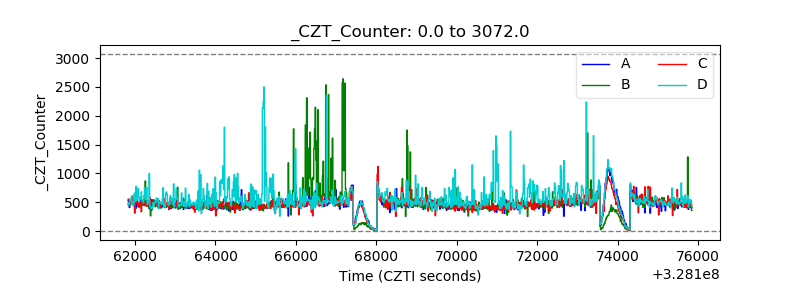 |
| +2.5 Volts monitor |  |
| +5 Volts monitor |  |
| _ROLL_ROT | 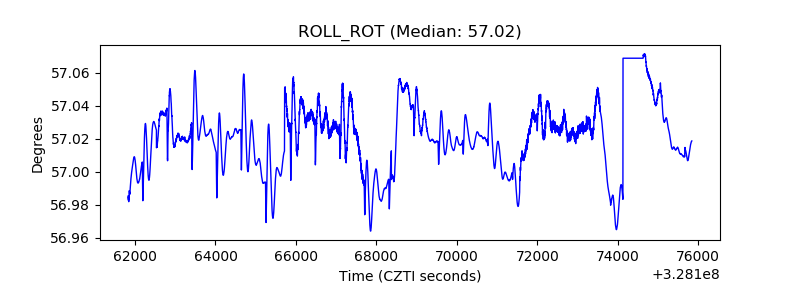 |
| _Roll_DEC | 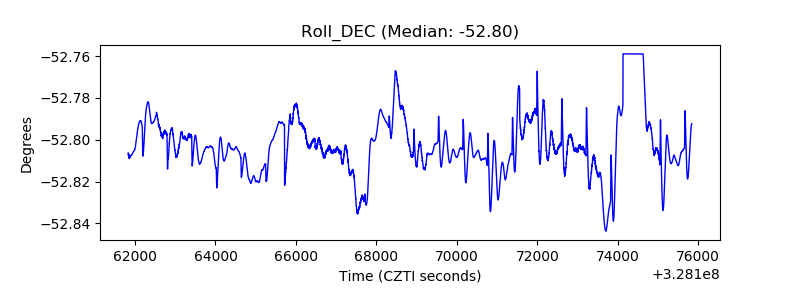 |
| _Roll_RA | 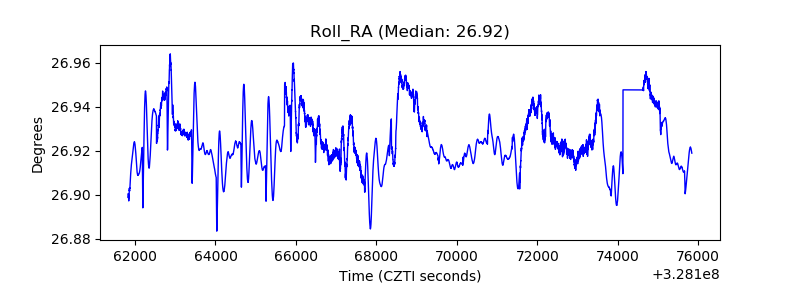 |
| Veto Counter | 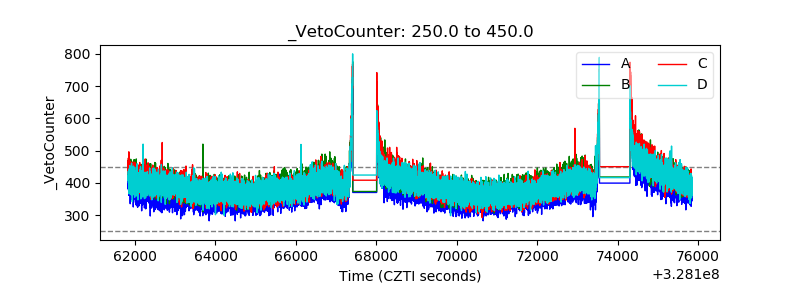 |