| Param | Original file | Final file |
|---|---|---|
| Filename | modeM0/AS1A07_027T01_9000003690_25195cztM0_level2.evt | modeM0/AS1A07_027T01_9000003690_25195cztM0_level2_quad_clean.evt |
| Size (bytes) | 481,343,040 | 100,128,960 |
| Size | 459.0 MB | 95.5 MB |
| Events in quadrant A | 3,276,427 | 648,415 |
| Events in quadrant B | 3,276,320 | 655,863 |
| Events in quadrant C | 3,581,263 | 627,583 |
| Events in quadrant D | 3,980,478 | 625,344 |
| Mode M9 | |||
|---|---|---|---|
| Quadrant | BADHDUFLAG | Total packets | Discarded packets |
| A | 0 | 11 | 0 |
| B | 0 | 12 | 0 |
| C | 0 | 12 | 0 |
| D | 0 | 12 | 0 |
| Mode M0 | |||
|---|---|---|---|
| Quadrant | BADHDUFLAG | Total packets | Discarded packets |
| A | 0 | 13999 | 0 |
| B | 0 | 13995 | 0 |
| C | 0 | 14905 | 0 |
| D | 0 | 16086 | 0 |
| Quadrant | Total seconds | Saturated seconds | Saturation percentage |
|---|---|---|---|
| A | 6818 | 53 | 0.777354% |
| B | 6818 | 57 | 0.836022% |
| C | 6818 | 194 | 2.845409% |
| D | 6818 | 99 | 1.452039% |
Noise dominated data is calculated using 1-second bins in cleaned event files. If a bin has >2000 counts, and if more than 50% of those come from <1% of pixels, then it is considered to be noise-dominated and hence unusable.
| Quadrant | # 1 sec bins | Bins with >0 counts | Bins with >2000 counts | High rate bins dominated by noise | Noise dominated (total time) | Noise dominated (detector-on time) | Marked lightcurve |
|---|---|---|---|---|---|---|---|
| A | 7713 | 6819 | 0 | 0 | 0.00% | 0.00% | 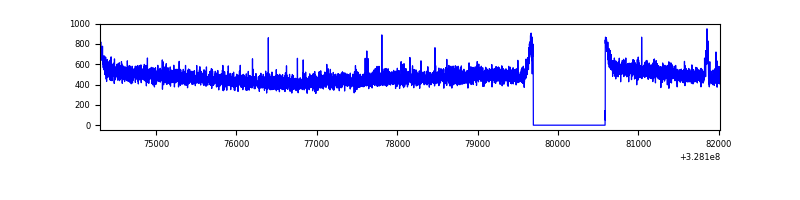 |
| B | 7713 | 6819 | 0 | 0 | 0.00% | 0.00% | 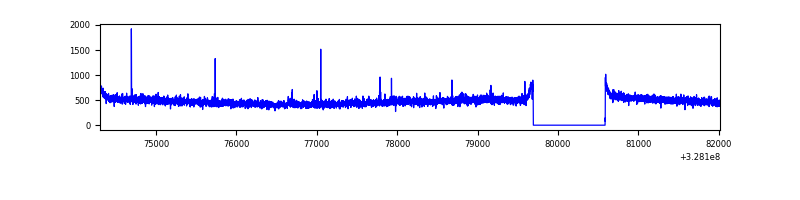 |
| C | 7713 | 6819 | 25 | 25 | 0.32% | 0.37% | 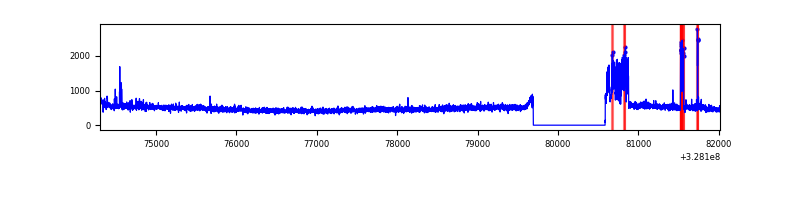 |
| D | 7713 | 6819 | 42 | 42 | 0.54% | 0.62% | 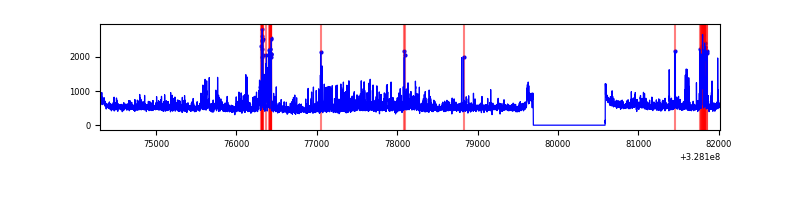 |
Top three noisy pixels from each quadrant. If the there are fewer than three noisy pixels in the level2.evt file, extra rows are filled as -1
| Pixel properties | Quadrant properties | ||||||
|---|---|---|---|---|---|---|---|
| Quadrant | DetID | PixID | Counts | Sigma | Mean | Median | Sigma |
| A | 13 | 170 | 18508 | 103.57 | 844 | 826 | 170.7 |
| A | 13 | 254 | 10135 | 54.53 | 844 | 826 | 170.7 |
| A | 3 | 137 | 7619 | 39.79 | 844 | 826 | 170.7 |
| B | 12 | 111 | 19728 | 118.59 | 830 | 810 | 159.5 |
| B | 11 | 111 | 17863 | 106.9 | 830 | 810 | 159.5 |
| B | 14 | 111 | 16395 | 97.7 | 830 | 810 | 159.5 |
| C | 0 | 239 | 278899 | 1468.02 | 806 | 811 | 189.4 |
| C | 14 | 238 | 127095 | 666.65 | 806 | 811 | 189.4 |
| C | 8 | 208 | 19972 | 101.15 | 806 | 811 | 189.4 |
| D | 8 | 195 | 320792 | 1603.26 | 828 | 806 | 199.6 |
| D | 12 | 233 | 274156 | 1369.59 | 828 | 806 | 199.6 |
| D | 2 | 244 | 116542 | 579.88 | 828 | 806 | 199.6 |
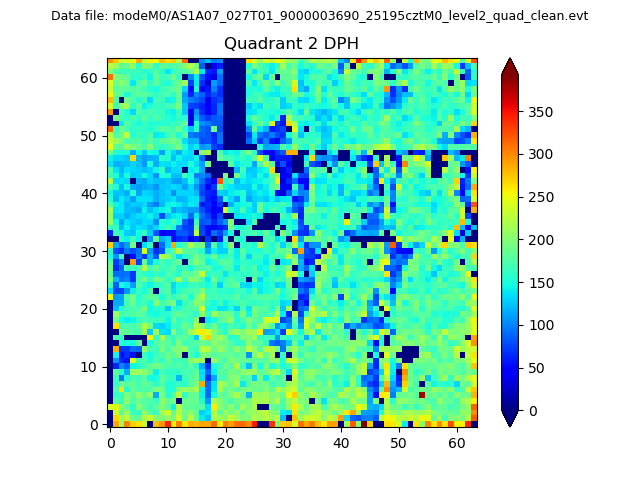
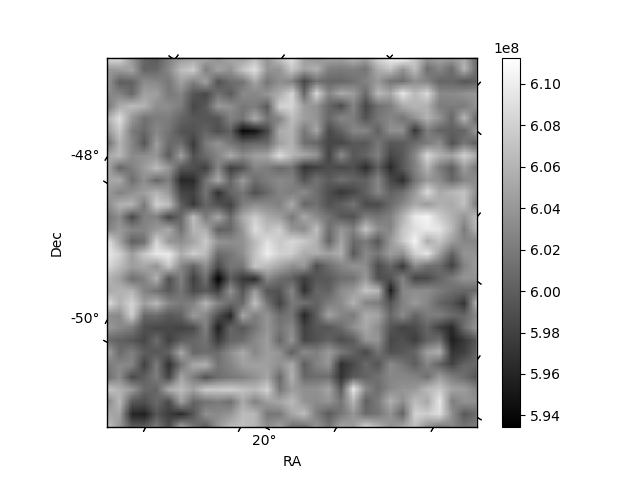
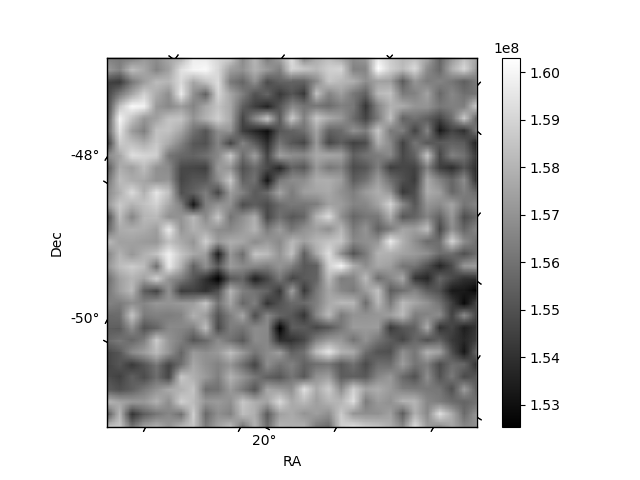
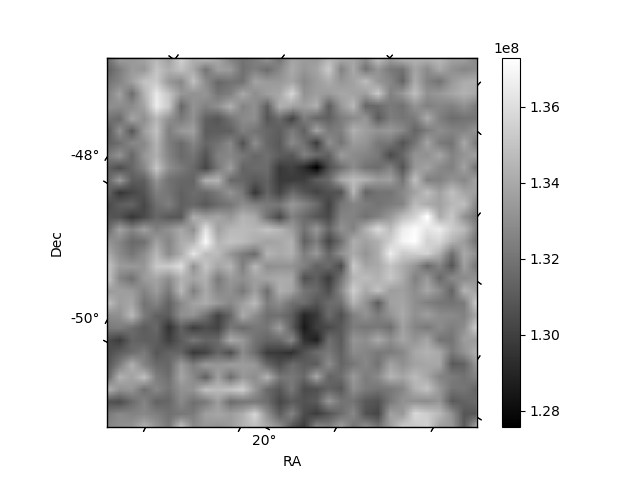
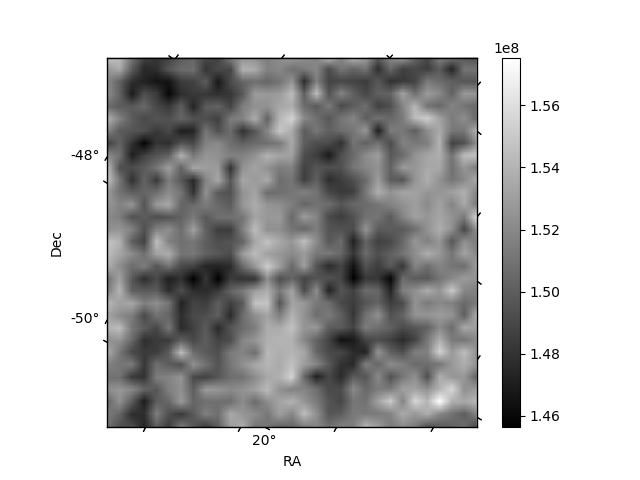
Histogram calculated using DETX and DETY for each event in the final _common_clean file
| Quadrant A | 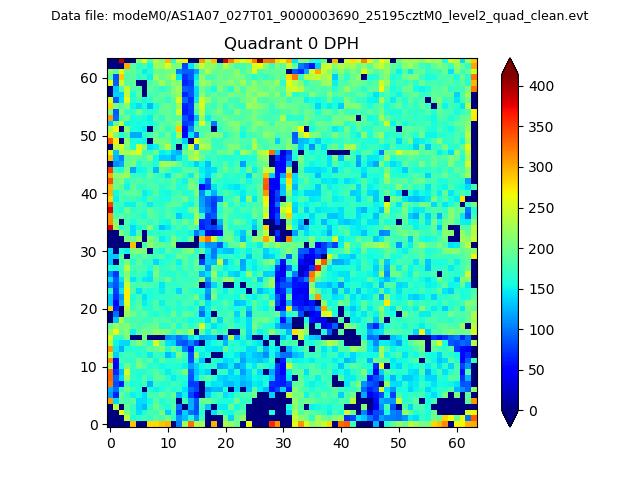 |
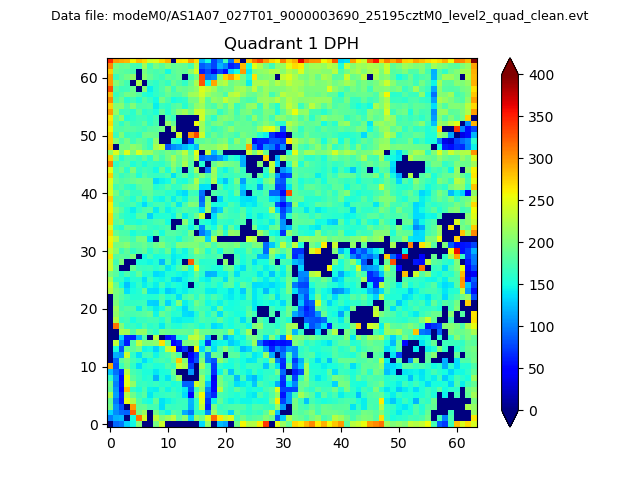 |
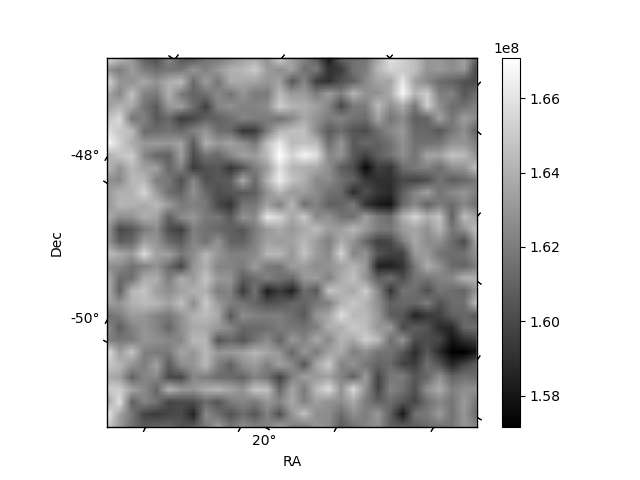
Quadrant B |
|---|---|---|---|
| Quadrant D | 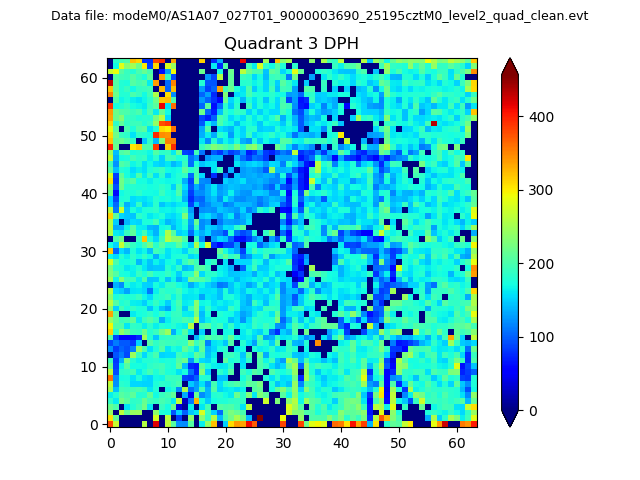 |
 |
Quadrant C |
| Plot type | Count rate plots | Images |
|---|---|---|
| Comparison with Poisson distribution Blue bars denote a histogram of data divided into 1 sec bins. Red curve is a Poisson curve with rate = median count rate of data. |
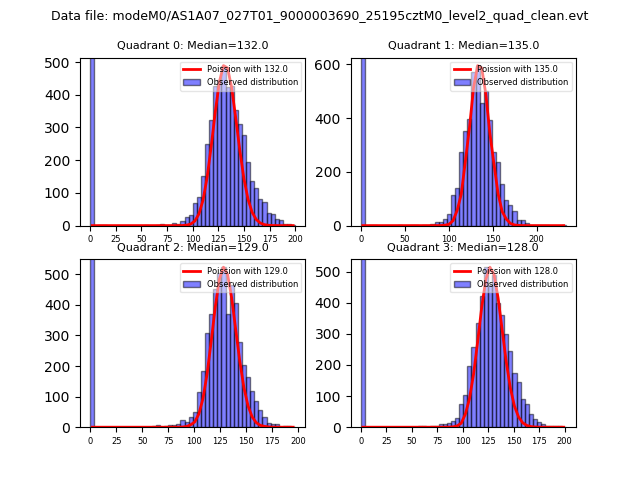 |
 |
| Quadrant-wise count rates Data is divided into 100 sec bins |
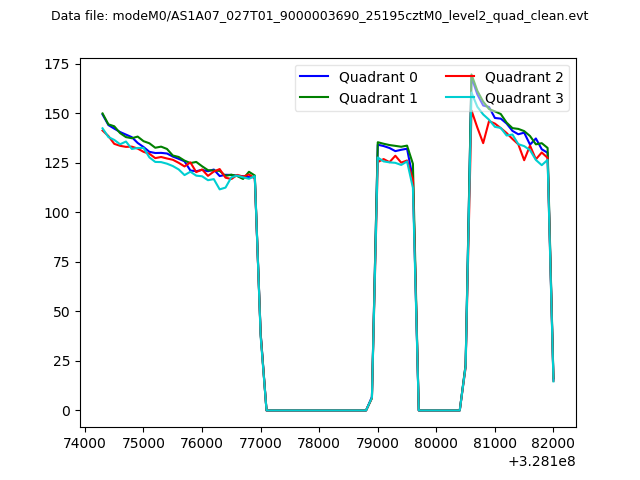 |
|
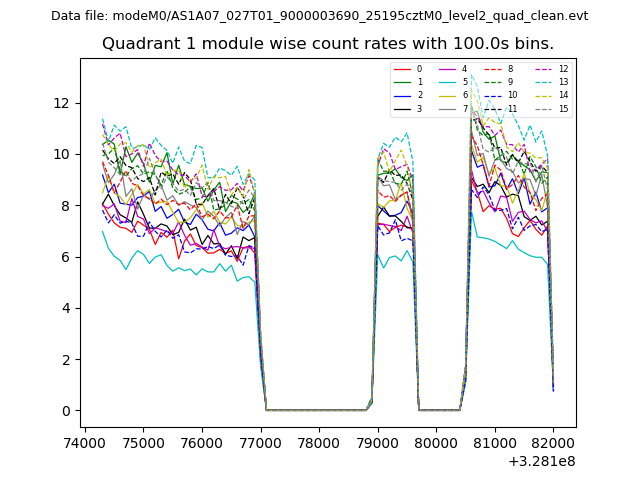
| Module-wise count rates for Quadrant A Data is divided into 100 sec bins |
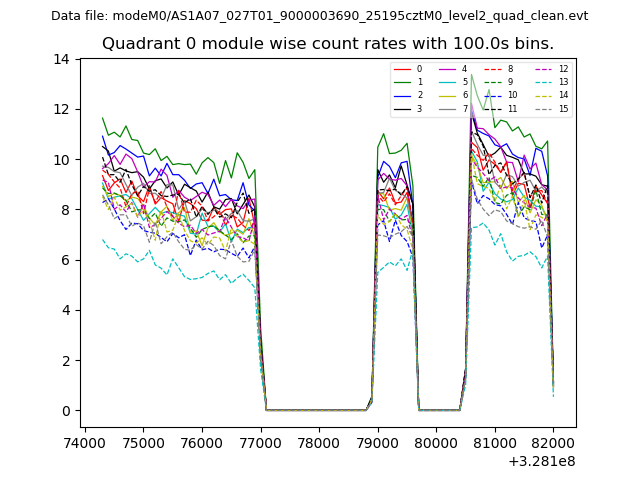 |
 |
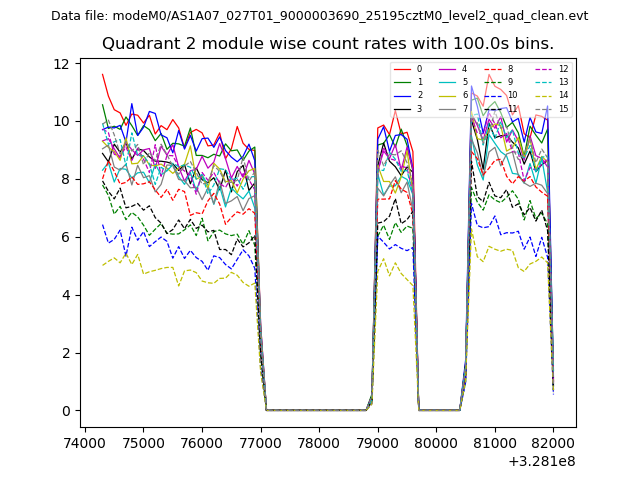
| Module-wise count rates for Quadrant B Data is divided into 100 sec bins |
 |
 |
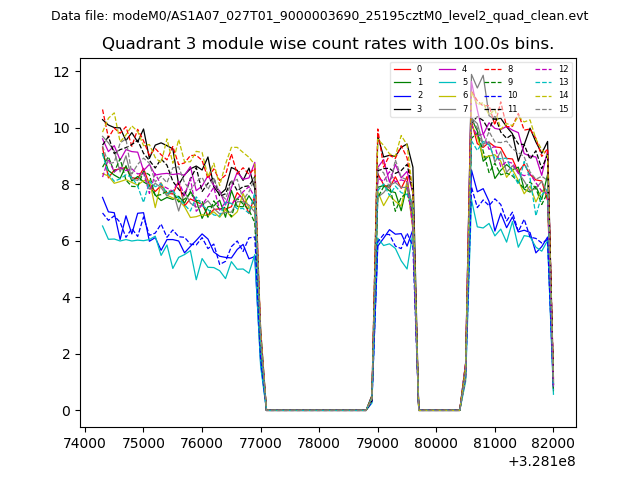
| Module-wise count rates for Quadrant C Data is divided into 100 sec bins |
 |
 |
| Module-wise count rates for Quadrant D Data is divided into 100 sec bins |
 |
 |
| Parameter | Plot |
|---|---|
| CZT HV Monitor | 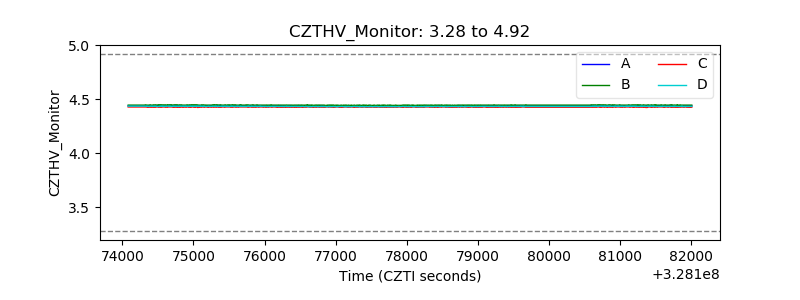 |
| D_VDD | 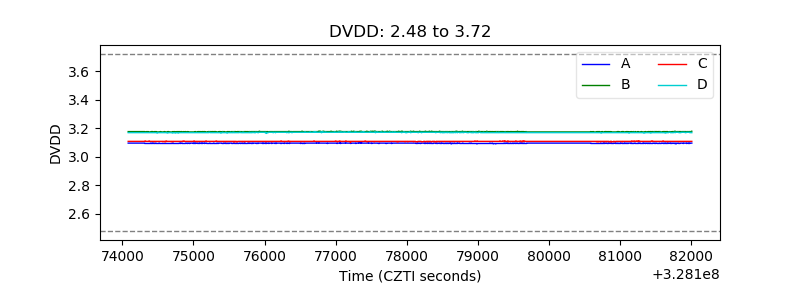 |
| Temperature 1 | 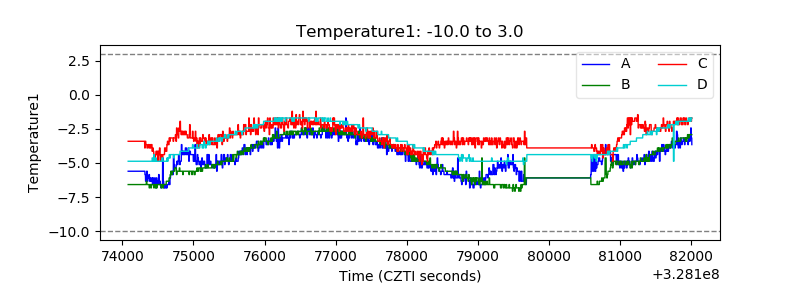 |
| Veto HV Monitor | 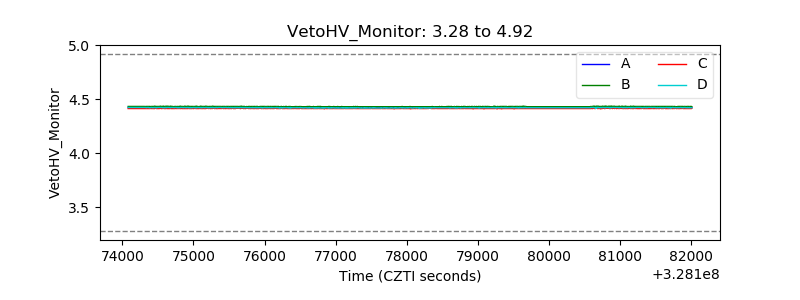 |
| Veto LLD | 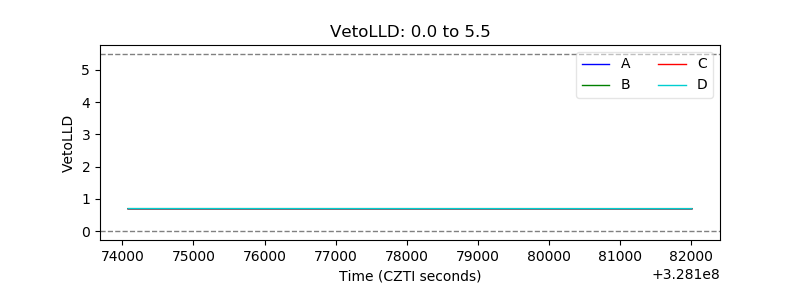 |
| Alpha Counter | 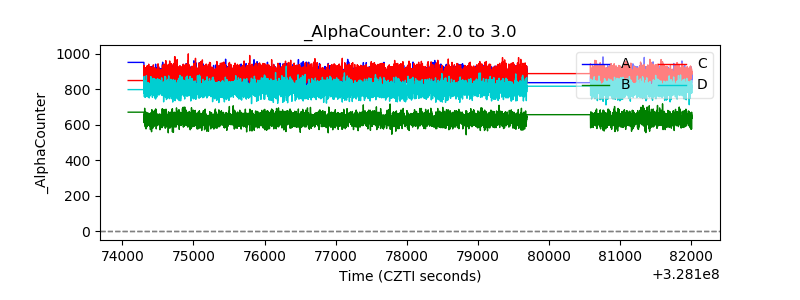 |
| _CPM_Rate | 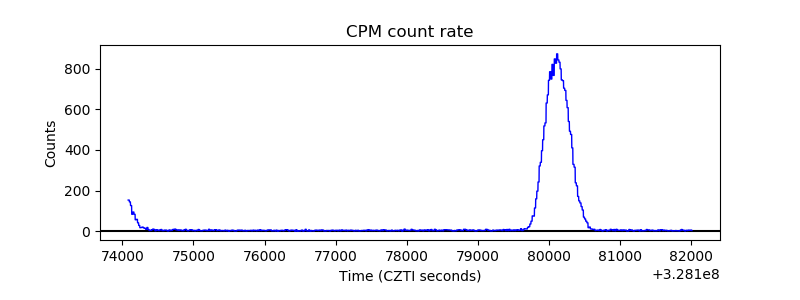 |
| CZT Counter | 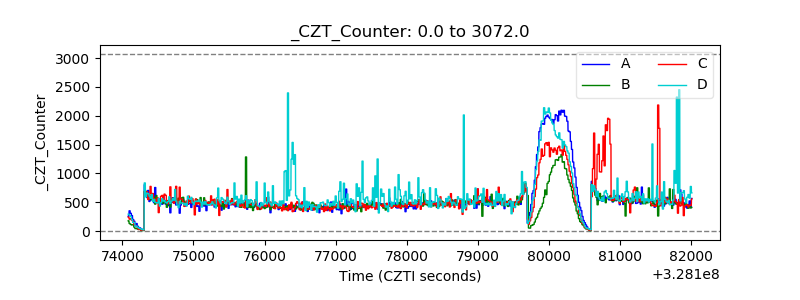 |
| +2.5 Volts monitor |  |
| +5 Volts monitor | 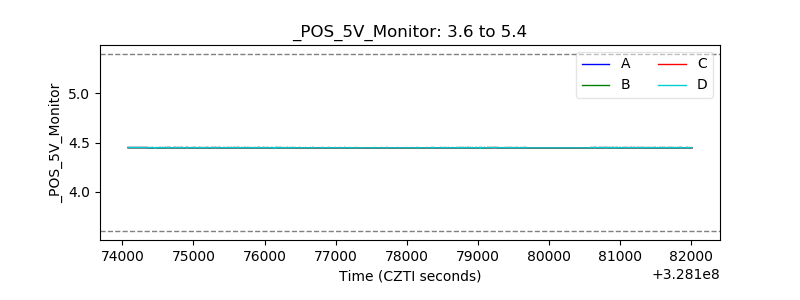 |
| _ROLL_ROT | 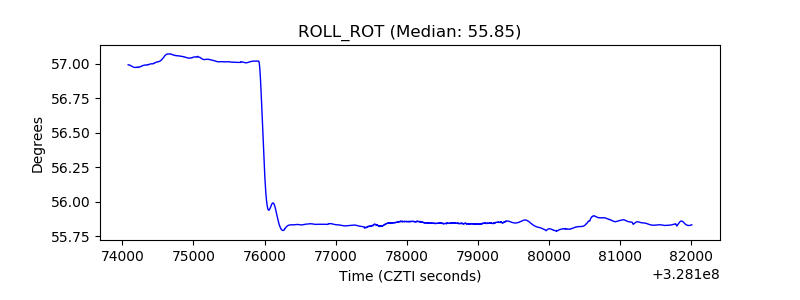 |
| _Roll_DEC | 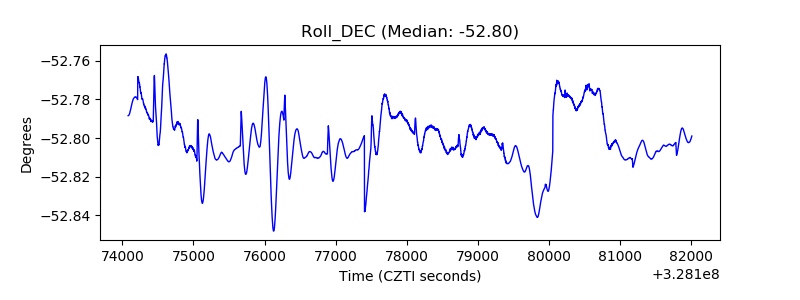 |
| _Roll_RA | 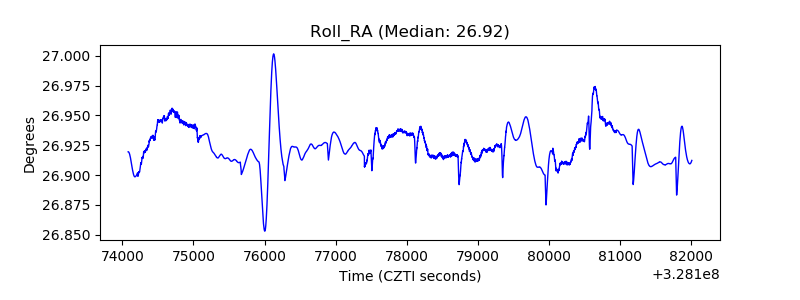 |
| Veto Counter | 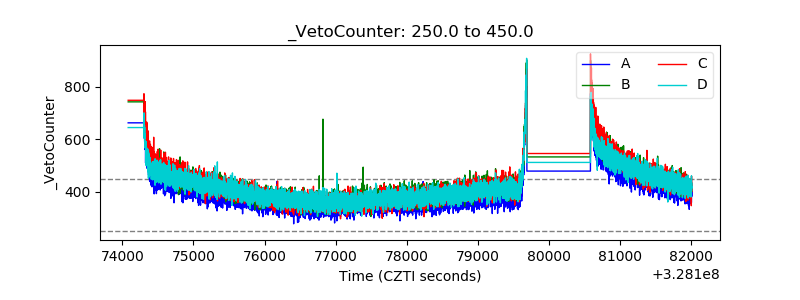 |