| Param | Original file | Final file |
|---|---|---|
| Filename | modeM0/AS1A07_027T01_9000003690_25196cztM0_level2.evt | modeM0/AS1A07_027T01_9000003690_25196cztM0_level2_quad_clean.evt |
| Size (bytes) | 462,389,760 | 95,555,520 |
| Size | 441.0 MB | 91.1 MB |
| Events in quadrant A | 3,184,045 | 625,440 |
| Events in quadrant B | 3,132,010 | 631,576 |
| Events in quadrant C | 3,193,239 | 601,081 |
| Events in quadrant D | 4,062,627 | 592,360 |
| Mode M9 | |||
|---|---|---|---|
| Quadrant | BADHDUFLAG | Total packets | Discarded packets |
| A | 0 | 11 | 0 |
| B | 0 | 11 | 0 |
| C | 0 | 11 | 0 |
| D | 0 | 11 | 0 |
| Mode M0 | |||
|---|---|---|---|
| Quadrant | BADHDUFLAG | Total packets | Discarded packets |
| A | 0 | 13298 | 0 |
| B | 0 | 13259 | 0 |
| C | 0 | 13471 | 0 |
| D | 0 | 16209 | 0 |
| Quadrant | Total seconds | Saturated seconds | Saturation percentage |
|---|---|---|---|
| A | 6358 | 39 | 0.613400% |
| B | 6359 | 45 | 0.707658% |
| C | 6359 | 88 | 1.383865% |
| D | 6359 | 127 | 1.997169% |
Noise dominated data is calculated using 1-second bins in cleaned event files. If a bin has >2000 counts, and if more than 50% of those come from <1% of pixels, then it is considered to be noise-dominated and hence unusable.
| Quadrant | # 1 sec bins | Bins with >0 counts | Bins with >2000 counts | High rate bins dominated by noise | Noise dominated (total time) | Noise dominated (detector-on time) | Marked lightcurve |
|---|---|---|---|---|---|---|---|
| A | 7423 | 6359 | 0 | 0 | 0.00% | 0.00% |  |
| B | 7424 | 6360 | 10 | 10 | 0.13% | 0.16% |  |
| C | 7424 | 6360 | 21 | 21 | 0.28% | 0.33% |  |
| D | 7424 | 6360 | 87 | 87 | 1.17% | 1.37% |  |
Top three noisy pixels from each quadrant. If the there are fewer than three noisy pixels in the level2.evt file, extra rows are filled as -1
| Pixel properties | Quadrant properties | ||||||
|---|---|---|---|---|---|---|---|
| Quadrant | DetID | PixID | Counts | Sigma | Mean | Median | Sigma |
| A | 13 | 170 | 83726 | 518.97 | 800 | 785 | 159.8 |
| A | 3 | 1 | 13735 | 81.03 | 800 | 785 | 159.8 |
| A | 13 | 254 | 10251 | 59.23 | 800 | 785 | 159.8 |
| B | 0 | 190 | 36605 | 239.83 | 784 | 765 | 149.4 |
| B | 12 | 111 | 18104 | 116.03 | 784 | 765 | 149.4 |
| B | 11 | 111 | 16504 | 105.32 | 784 | 765 | 149.4 |
| C | 14 | 238 | 121903 | 685.82 | 758 | 763 | 176.6 |
| C | 0 | 239 | 76335 | 427.84 | 758 | 763 | 176.6 |
| C | 8 | 208 | 21136 | 115.34 | 758 | 763 | 176.6 |
| D | 12 | 233 | 384921 | 2043.57 | 779 | 756 | 188.0 |
| D | 12 | 235 | 277013 | 1469.55 | 779 | 756 | 188.0 |
| D | 8 | 195 | 273734 | 1452.11 | 779 | 756 | 188.0 |
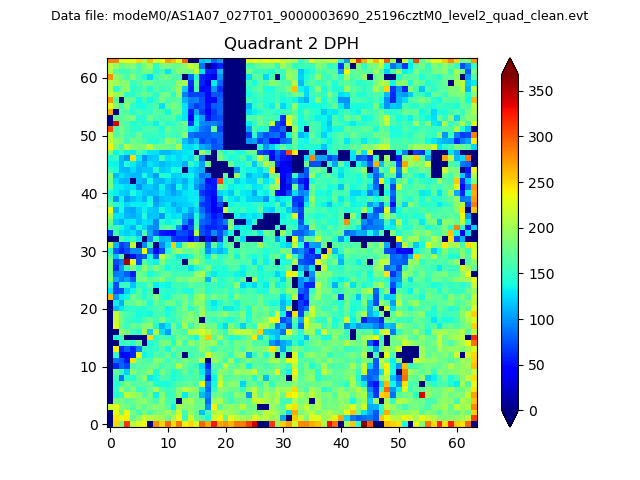
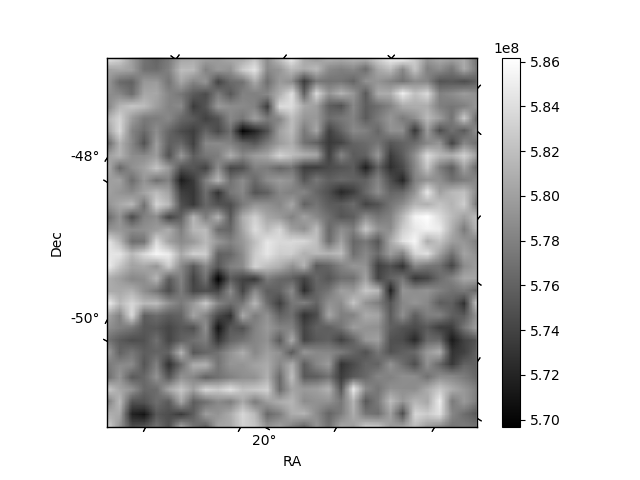
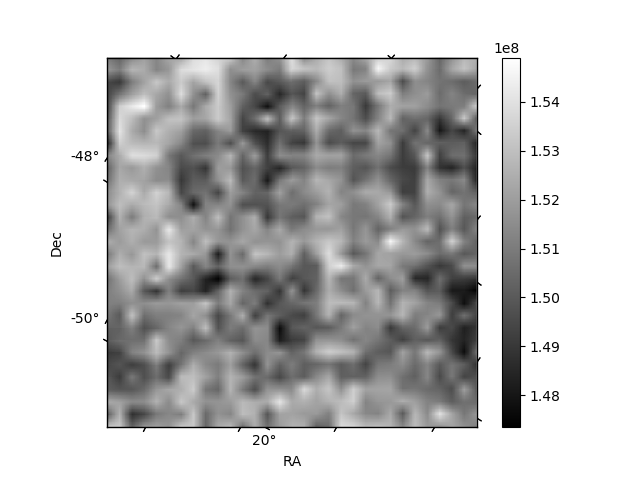
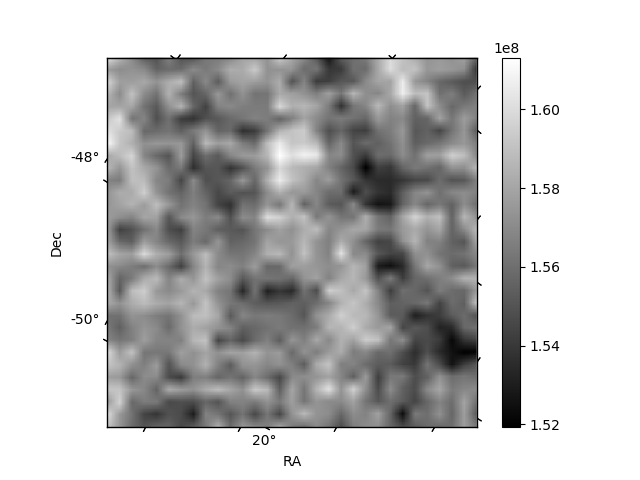
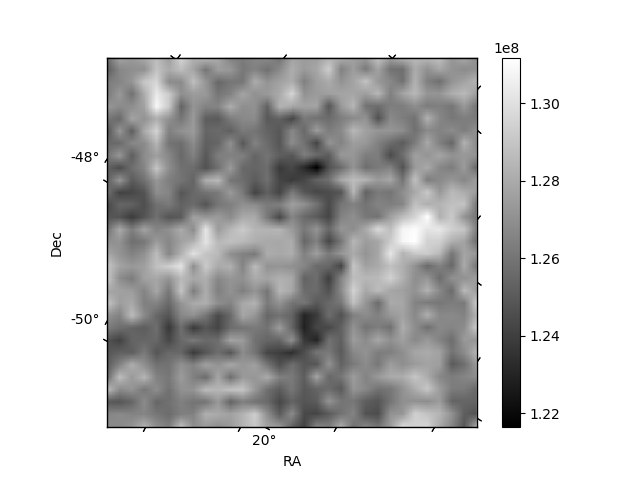
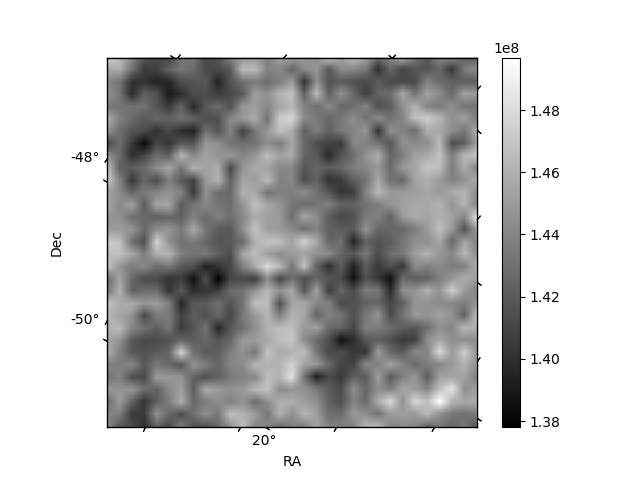
Histogram calculated using DETX and DETY for each event in the final _common_clean file
| Quadrant A | 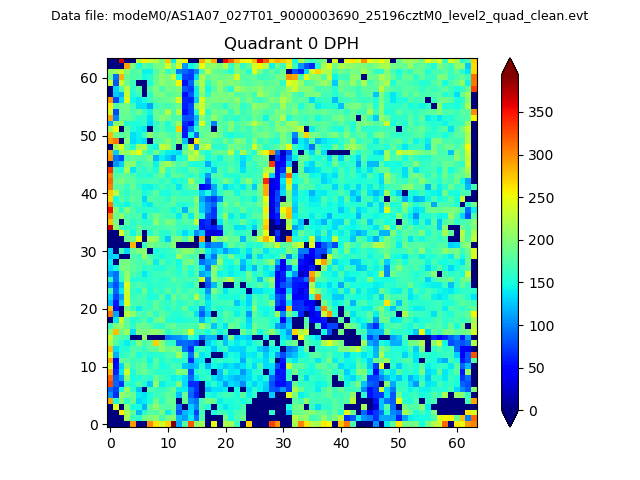 |
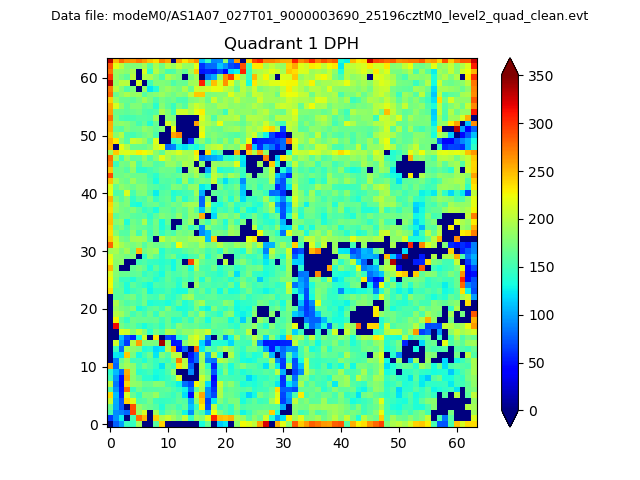 |
Quadrant B |
|---|---|---|---|
| Quadrant D | 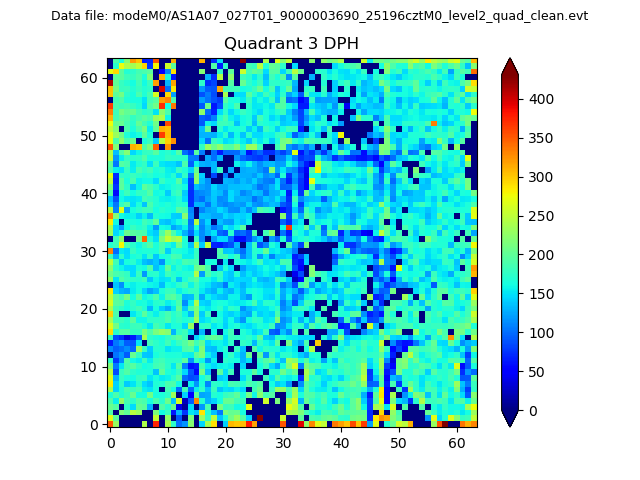 |
 |
Quadrant C |
| Plot type | Count rate plots | Images |
|---|---|---|
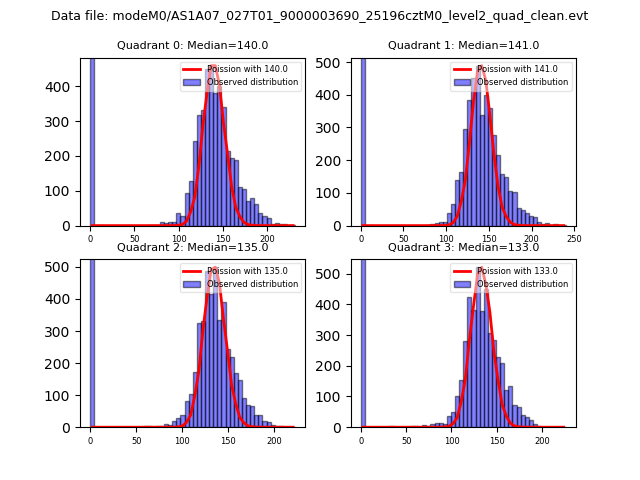
| Comparison with Poisson distribution Blue bars denote a histogram of data divided into 1 sec bins. Red curve is a Poisson curve with rate = median count rate of data. |
 |
 |
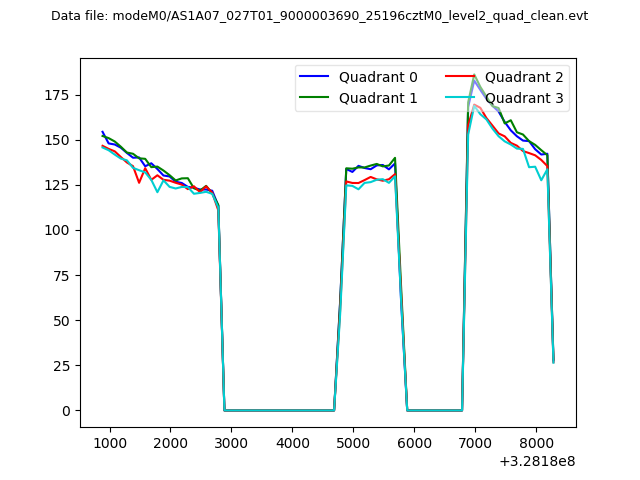
| Quadrant-wise count rates Data is divided into 100 sec bins |
 |
|
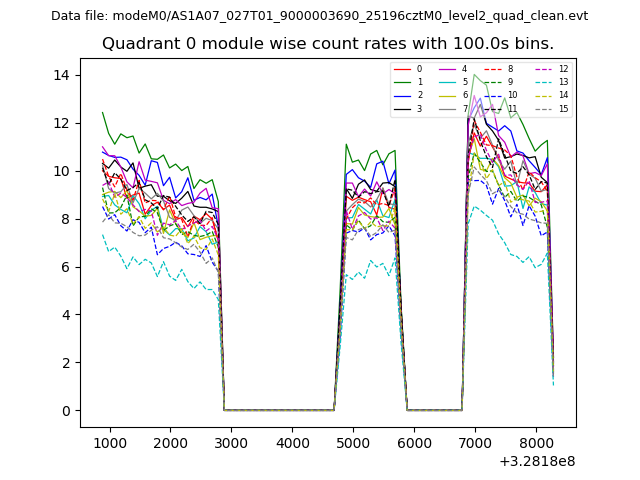
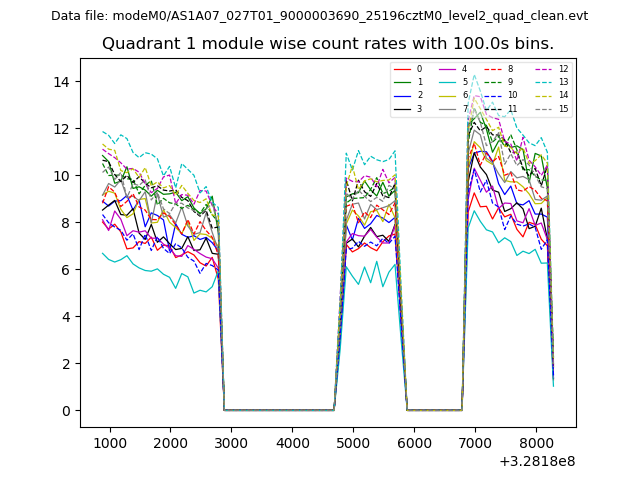
| Module-wise count rates for Quadrant A Data is divided into 100 sec bins |
 |
 |
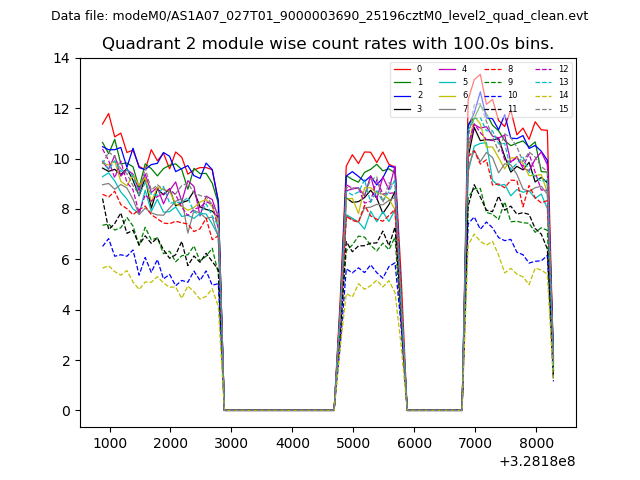
| Module-wise count rates for Quadrant B Data is divided into 100 sec bins |
 |
 |
| Module-wise count rates for Quadrant C Data is divided into 100 sec bins |
 |
 |
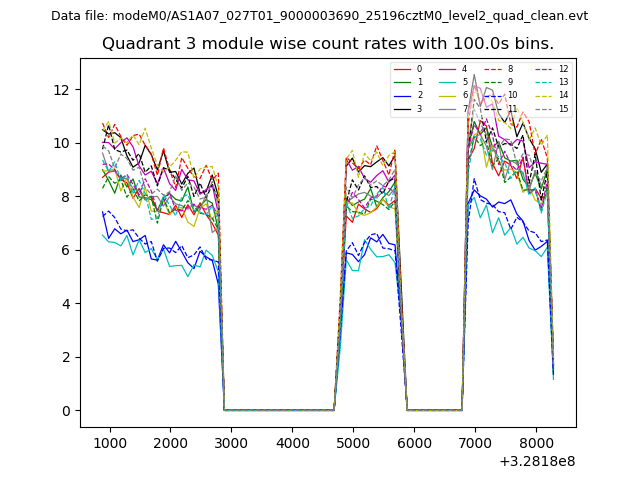
| Module-wise count rates for Quadrant D Data is divided into 100 sec bins |
 |
 |
| Parameter | Plot |
|---|---|
| CZT HV Monitor | 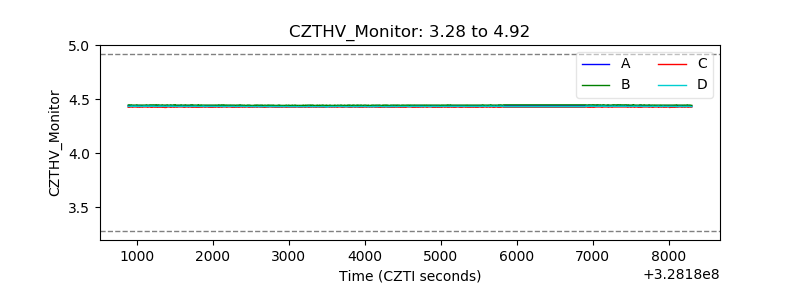 |
| D_VDD | 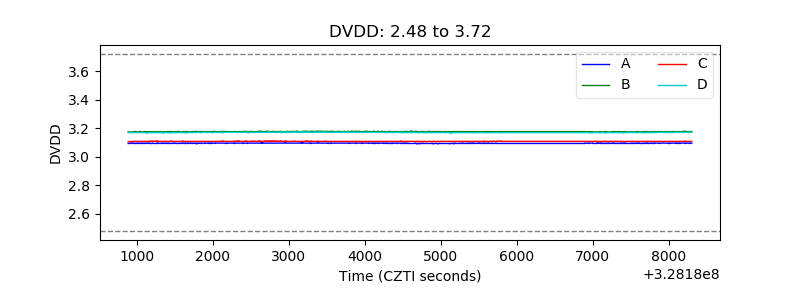 |
| Temperature 1 | 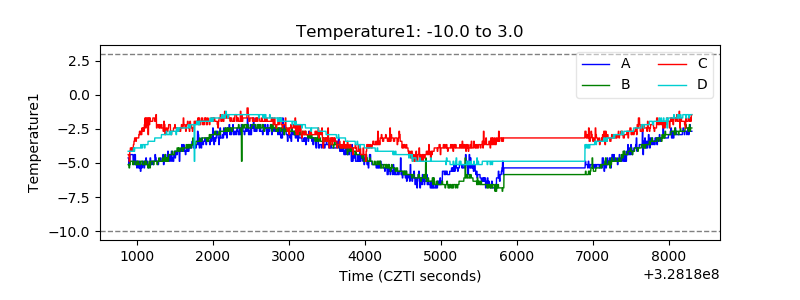 |
| Veto HV Monitor | 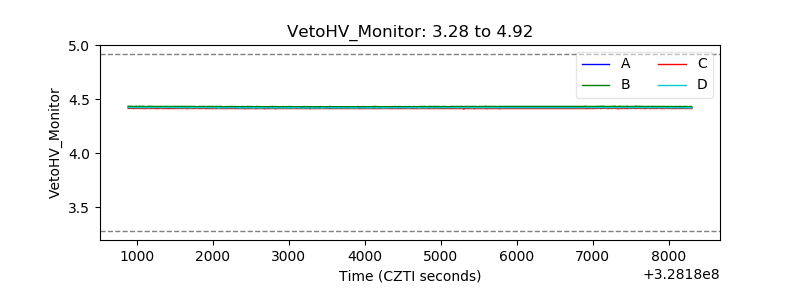 |
| Veto LLD | 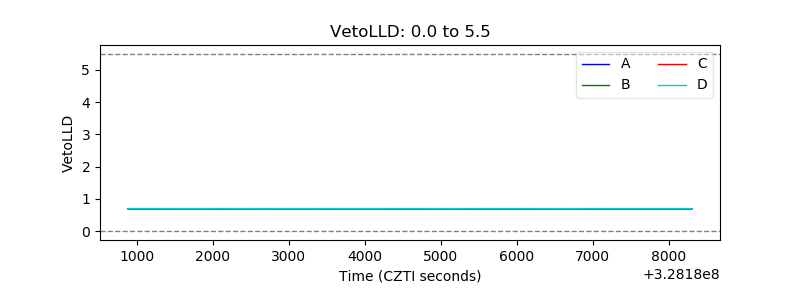 |
| Alpha Counter | 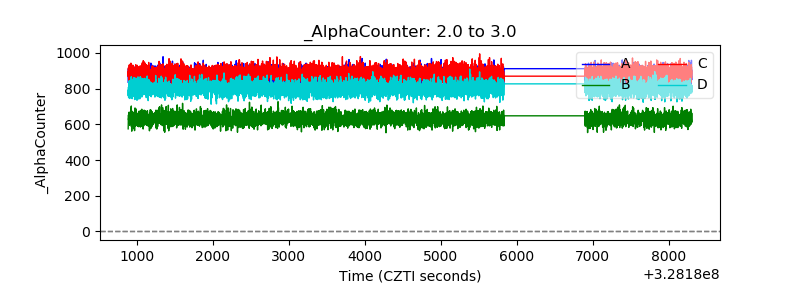 |
| _CPM_Rate | 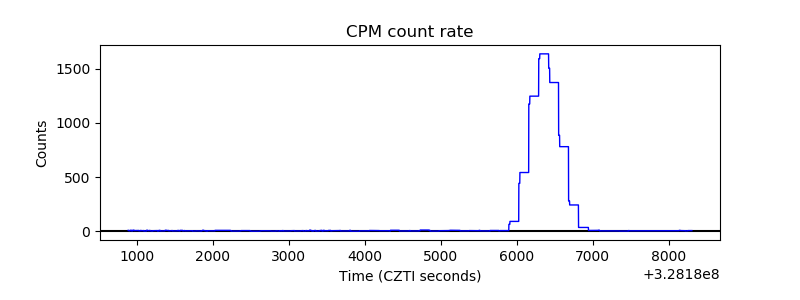 |
| CZT Counter |  |
| +2.5 Volts monitor |  |
| +5 Volts monitor |  |
| _ROLL_ROT | 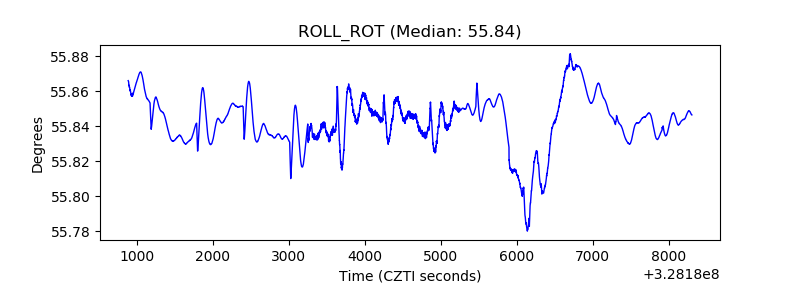 |
| _Roll_DEC | 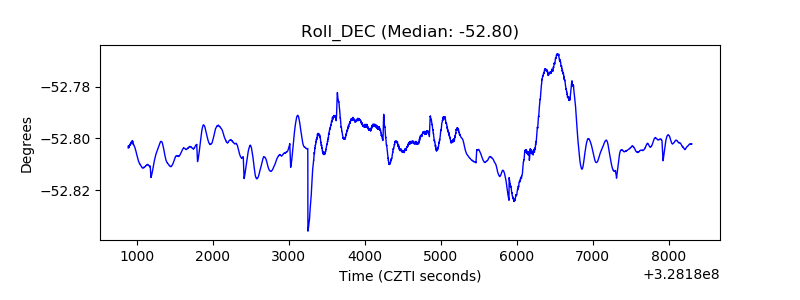 |
| _Roll_RA | 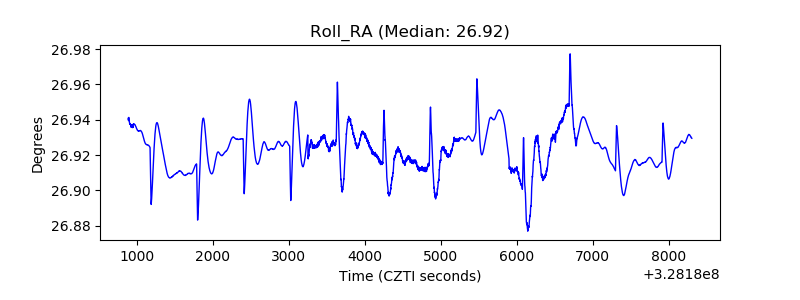 |
| Veto Counter | 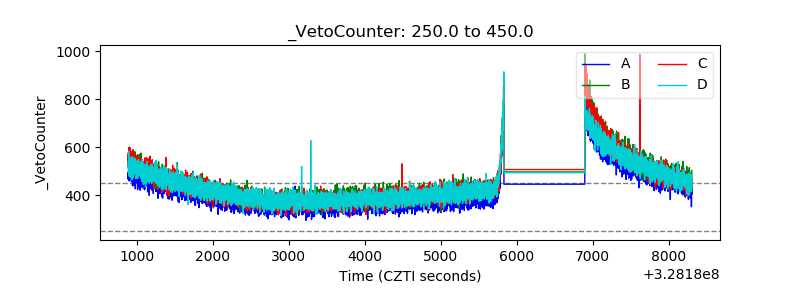 |