| Param | Original file | Final file |
|---|---|---|
| Filename | modeM0/AS1A07_027T01_9000003690_25199cztM0_level2.evt | modeM0/AS1A07_027T01_9000003690_25199cztM0_level2_quad_clean.evt |
| Size (bytes) | 833,699,520 | 152,472,960 |
| Size | 795.1 MB | 145.4 MB |
| Events in quadrant A | 5,613,844 | 1,000,780 |
| Events in quadrant B | 5,678,364 | 1,005,584 |
| Events in quadrant C | 6,287,796 | 934,789 |
| Events in quadrant D | 6,939,387 | 929,958 |
| Mode M9 | |||
|---|---|---|---|
| Quadrant | BADHDUFLAG | Total packets | Discarded packets |
| A | 0 | 24 | 0 |
| B | 0 | 24 | 0 |
| C | 0 | 24 | 0 |
| D | 0 | 24 | 0 |
| Mode M0 | |||
|---|---|---|---|
| Quadrant | BADHDUFLAG | Total packets | Discarded packets |
| A | 0 | 23249 | 0 |
| B | 0 | 23545 | 0 |
| C | 0 | 25660 | 0 |
| D | 0 | 27681 | 0 |
| Quadrant | Total seconds | Saturated seconds | Saturation percentage |
|---|---|---|---|
| A | 10783 | 101 | 0.936660% |
| B | 10784 | 96 | 0.890208% |
| C | 10784 | 253 | 2.346068% |
| D | 10784 | 236 | 2.188427% |
Noise dominated data is calculated using 1-second bins in cleaned event files. If a bin has >2000 counts, and if more than 50% of those come from <1% of pixels, then it is considered to be noise-dominated and hence unusable.
| Quadrant | # 1 sec bins | Bins with >0 counts | Bins with >2000 counts | High rate bins dominated by noise | Noise dominated (total time) | Noise dominated (detector-on time) | Marked lightcurve |
|---|---|---|---|---|---|---|---|
| A | 13198 | 10785 | 1 | 1 | 0.01% | 0.01% | 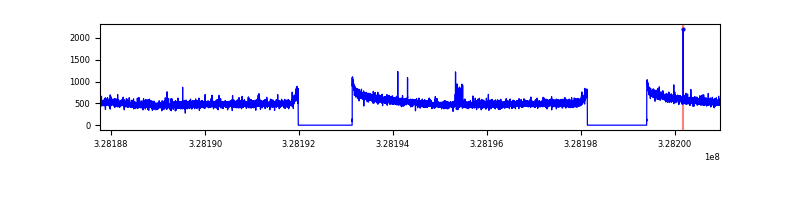 |
| B | 13199 | 10786 | 4 | 4 | 0.03% | 0.04% | 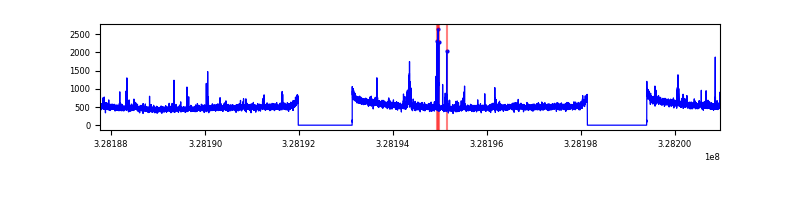 |
| C | 13199 | 10786 | 71 | 71 | 0.54% | 0.66% | 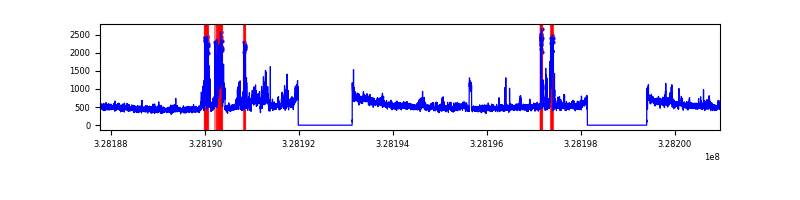 |
| D | 13199 | 10786 | 171 | 171 | 1.30% | 1.59% | 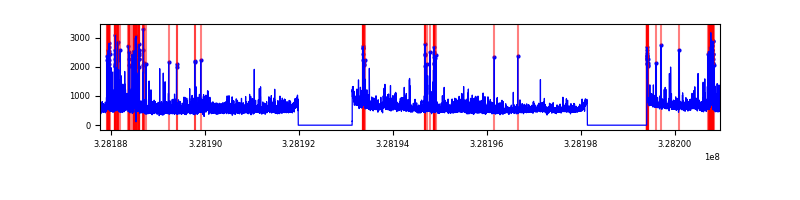 |
Top three noisy pixels from each quadrant. If the there are fewer than three noisy pixels in the level2.evt file, extra rows are filled as -1
| Pixel properties | Quadrant properties | ||||||
|---|---|---|---|---|---|---|---|
| Quadrant | DetID | PixID | Counts | Sigma | Mean | Median | Sigma |
| A | 13 | 170 | 53754 | 184.86 | 1437 | 1410 | 283.2 |
| A | 13 | 254 | 17721 | 57.6 | 1437 | 1410 | 283.2 |
| A | 6 | 16 | 16942 | 54.85 | 1437 | 1410 | 283.2 |
| B | 0 | 190 | 71109 | 266.44 | 1407 | 1376 | 261.7 |
| B | 10 | 251 | 52568 | 195.6 | 1407 | 1376 | 261.7 |
| B | 12 | 111 | 30965 | 113.06 | 1407 | 1376 | 261.7 |
| C | 7 | 247 | 796921 | 2608.57 | 1330 | 1343 | 305.0 |
| C | 14 | 238 | 219542 | 715.44 | 1330 | 1343 | 305.0 |
| C | 0 | 239 | 56766 | 181.72 | 1330 | 1343 | 305.0 |
| D | 12 | 233 | 741200 | 2254.04 | 1373 | 1336 | 328.2 |
| D | 8 | 195 | 604361 | 1837.15 | 1373 | 1336 | 328.2 |
| D | 1 | 52 | 151784 | 458.35 | 1373 | 1336 | 328.2 |
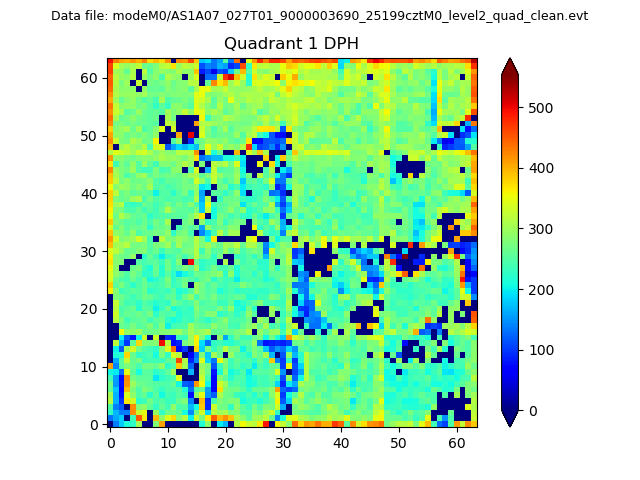
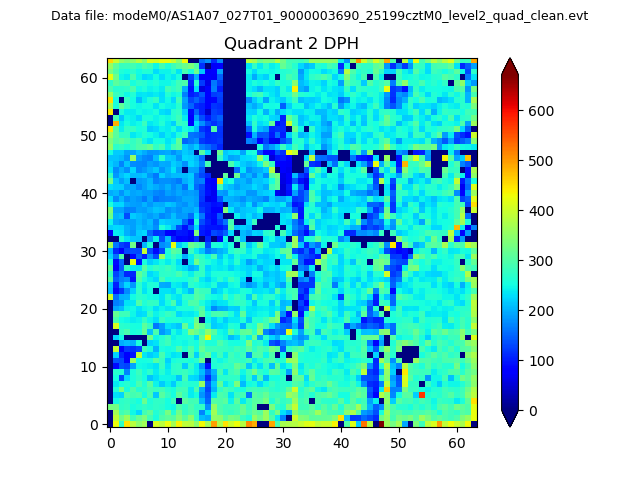
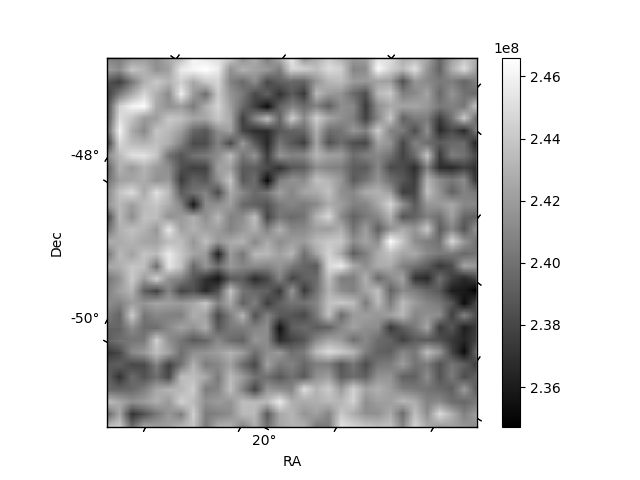
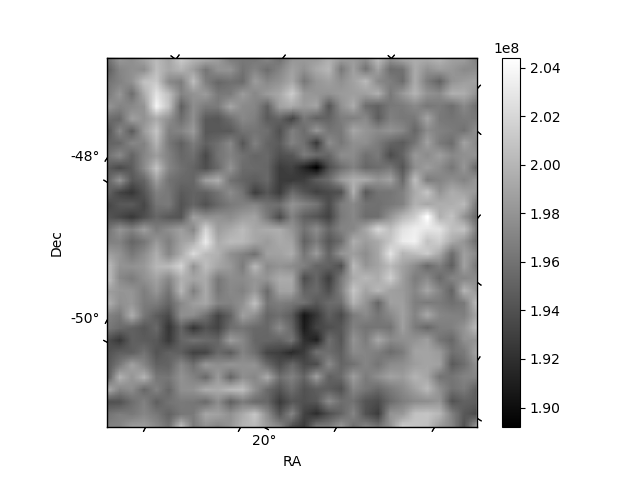
Histogram calculated using DETX and DETY for each event in the final _common_clean file
| Quadrant A |  |
 |
Quadrant B |
|---|---|---|---|
| Quadrant D |  |
 |
Quadrant C |
| Plot type | Count rate plots | Images |
|---|---|---|
| Comparison with Poisson distribution Blue bars denote a histogram of data divided into 1 sec bins. Red curve is a Poisson curve with rate = median count rate of data. |
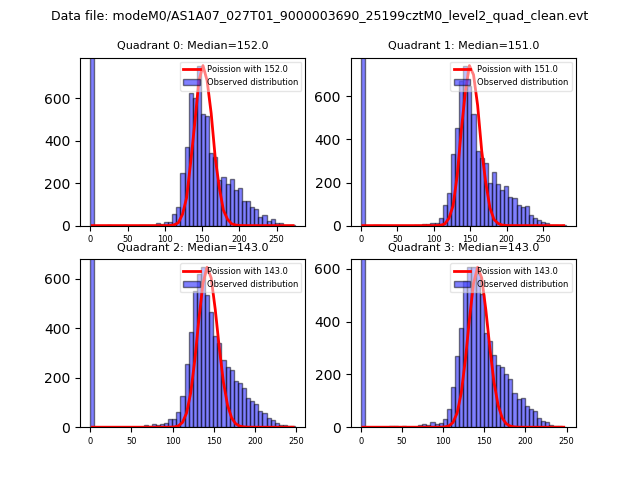 |
 |
| Quadrant-wise count rates Data is divided into 100 sec bins |
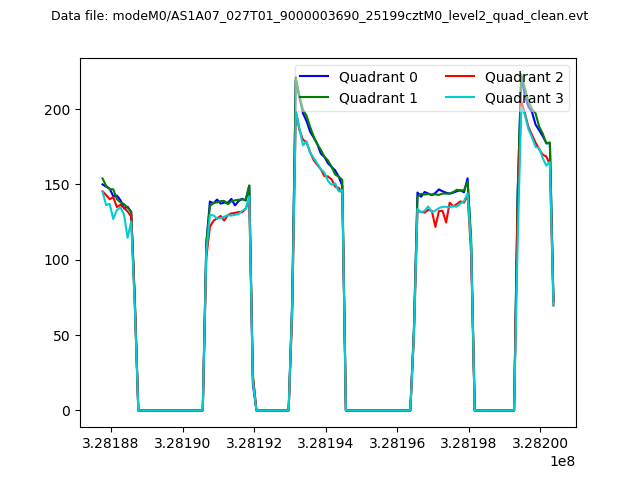 |
|
| Module-wise count rates for Quadrant A Data is divided into 100 sec bins |
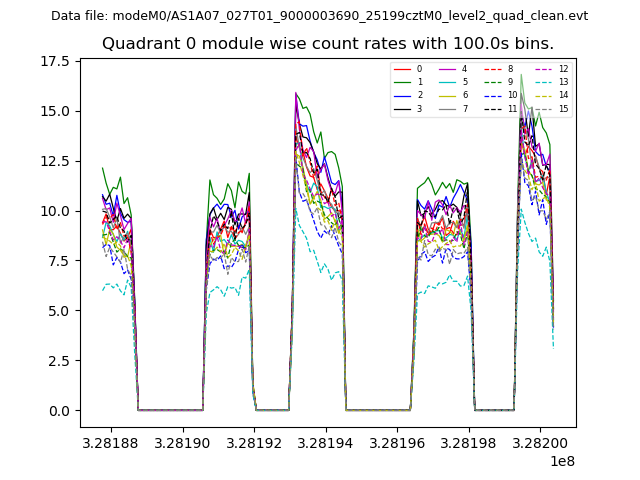 |
 |
| Module-wise count rates for Quadrant B Data is divided into 100 sec bins |
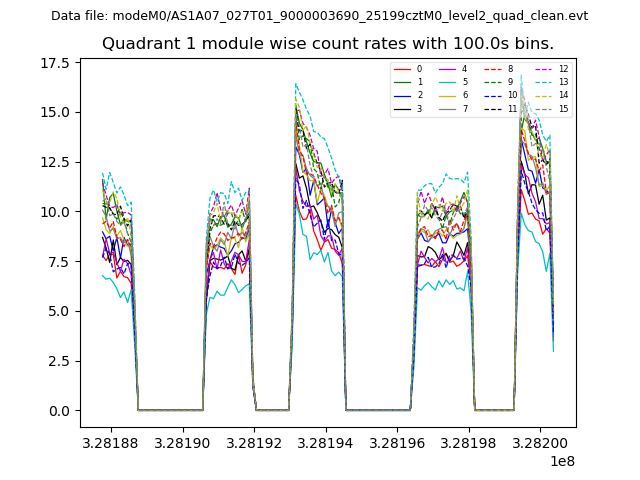 |
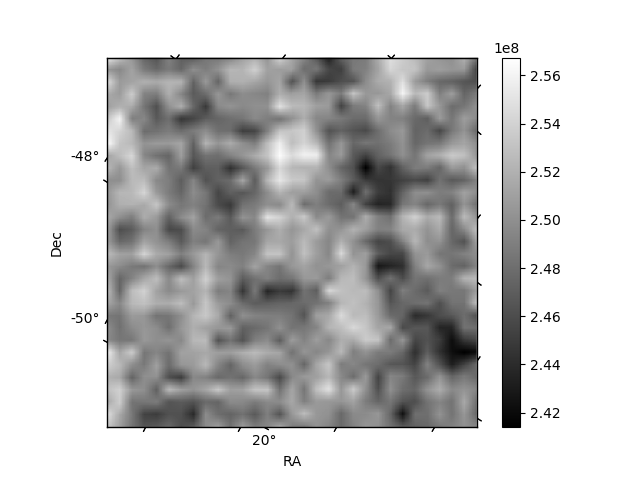 |
| Module-wise count rates for Quadrant C Data is divided into 100 sec bins |
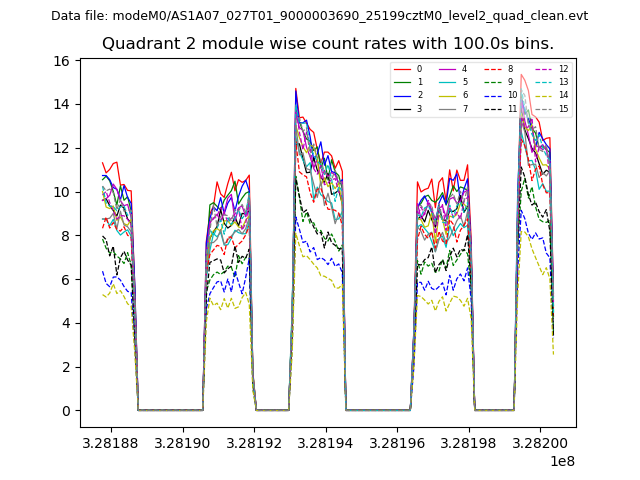 |
 |
| Module-wise count rates for Quadrant D Data is divided into 100 sec bins |
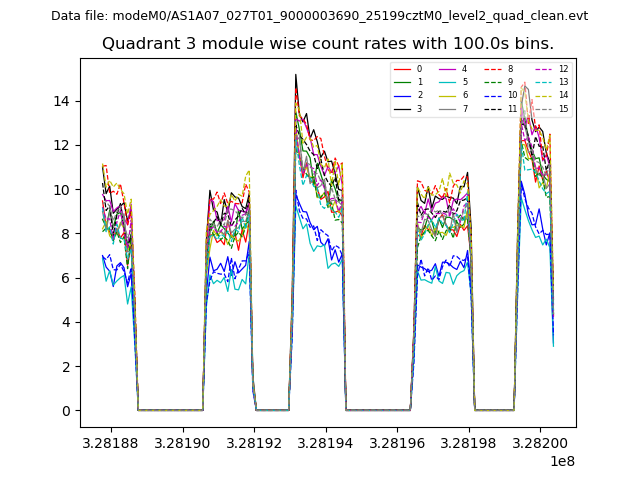 |
 |
| Parameter | Plot |
|---|---|
| CZT HV Monitor |  |
| D_VDD | 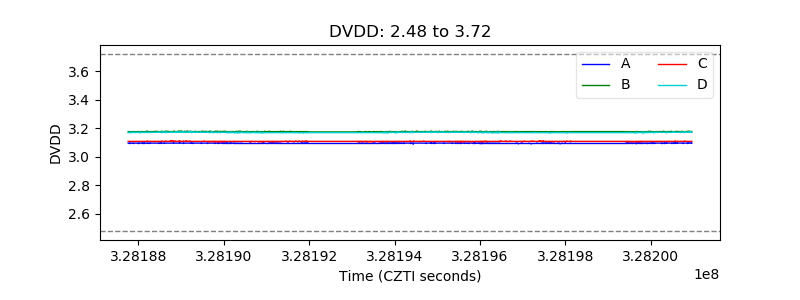 |
| Temperature 1 | 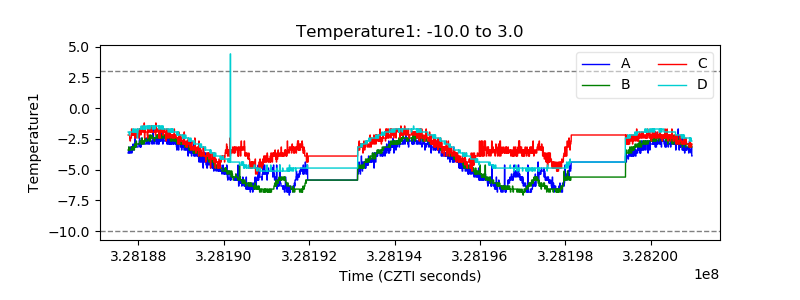 |
| Veto HV Monitor | 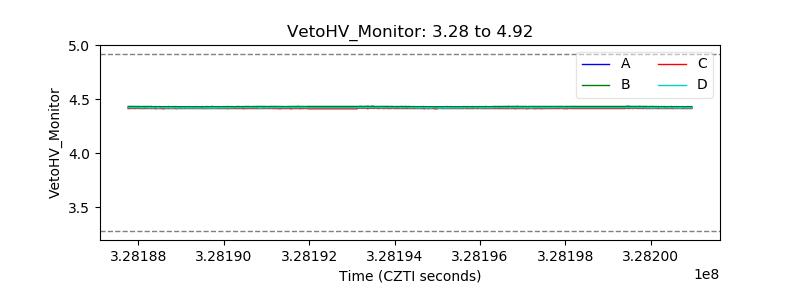 |
| Veto LLD | 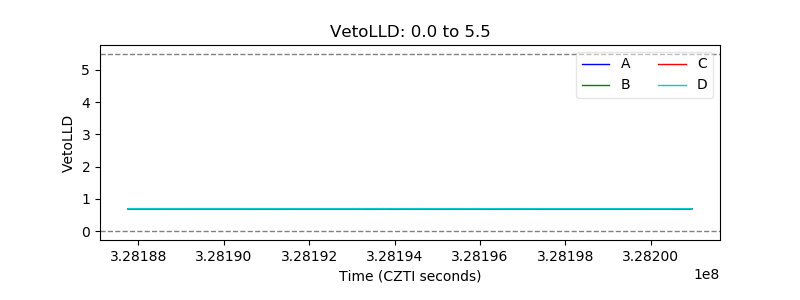 |
| Alpha Counter | 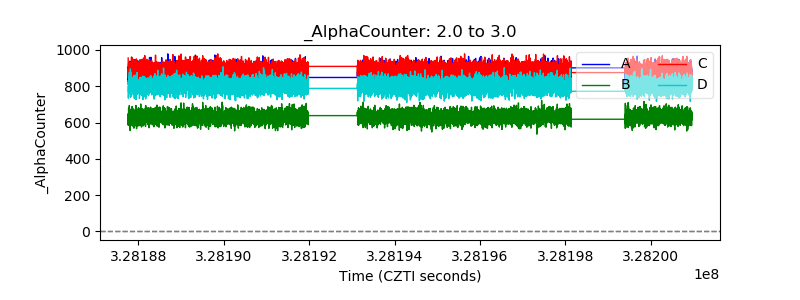 |
| _CPM_Rate | 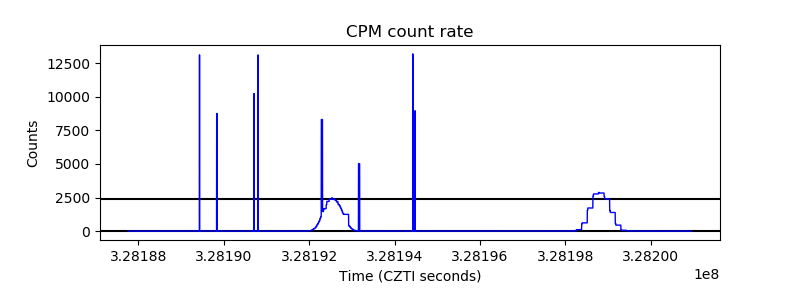 |
| CZT Counter | 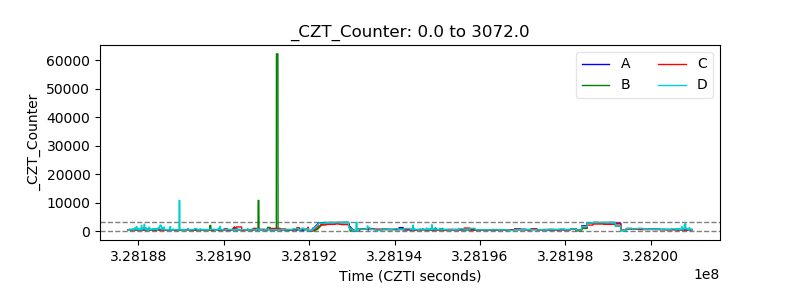 |
| +2.5 Volts monitor |  |
| +5 Volts monitor | 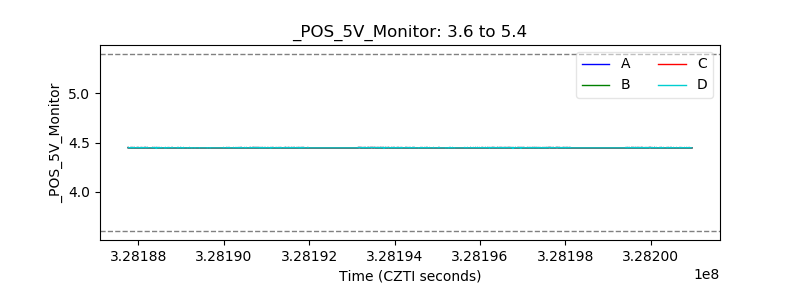 |
| _ROLL_ROT | 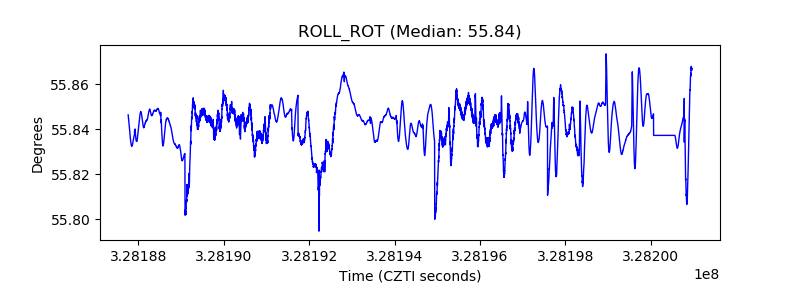 |
| _Roll_DEC | 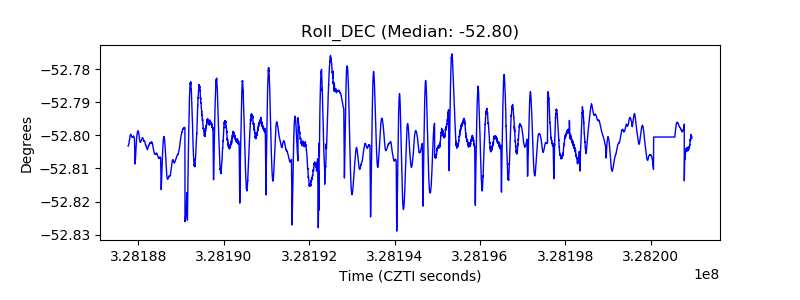 |
| _Roll_RA | 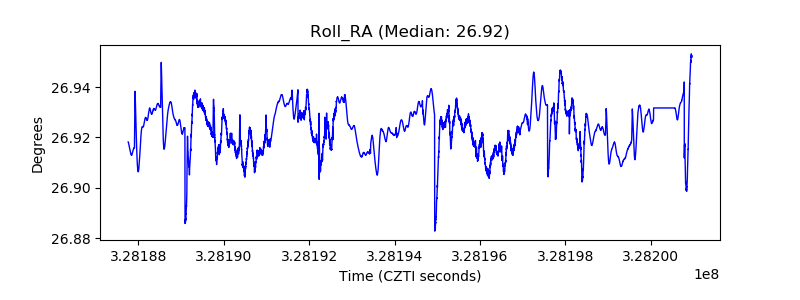 |
| Veto Counter | 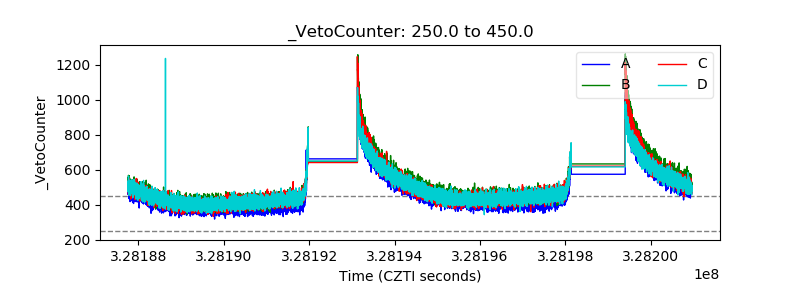 |