| Param | Original file | Final file |
|---|---|---|
| Filename | modeM0/AS1A07_027T01_9000003690_25200cztM0_level2.evt | modeM0/AS1A07_027T01_9000003690_25200cztM0_level2_quad_clean.evt |
| Size (bytes) | 470,099,520 | 86,019,840 |
| Size | 448.3 MB | 82.0 MB |
| Events in quadrant A | 3,295,089 | 561,641 |
| Events in quadrant B | 3,394,612 | 568,378 |
| Events in quadrant C | 3,300,136 | 526,884 |
| Events in quadrant D | 3,835,090 | 523,918 |
| Mode M9 | |||
|---|---|---|---|
| Quadrant | BADHDUFLAG | Total packets | Discarded packets |
| A | 0 | 13 | 0 |
| B | 0 | 13 | 0 |
| C | 0 | 13 | 0 |
| D | 0 | 13 | 0 |
| Mode M0 | |||
|---|---|---|---|
| Quadrant | BADHDUFLAG | Total packets | Discarded packets |
| A | 0 | 13456 | 0 |
| B | 0 | 13727 | 0 |
| C | 0 | 13453 | 0 |
| D | 0 | 15429 | 0 |
| Quadrant | Total seconds | Saturated seconds | Saturation percentage |
|---|---|---|---|
| A | 6071 | 69 | 1.136551% |
| B | 6071 | 82 | 1.350684% |
| C | 6072 | 102 | 1.679842% |
| D | 6072 | 116 | 1.910408% |
Noise dominated data is calculated using 1-second bins in cleaned event files. If a bin has >2000 counts, and if more than 50% of those come from <1% of pixels, then it is considered to be noise-dominated and hence unusable.
| Quadrant | # 1 sec bins | Bins with >0 counts | Bins with >2000 counts | High rate bins dominated by noise | Noise dominated (total time) | Noise dominated (detector-on time) | Marked lightcurve |
|---|---|---|---|---|---|---|---|
| A | 7381 | 6072 | 1 | 1 | 0.01% | 0.02% | 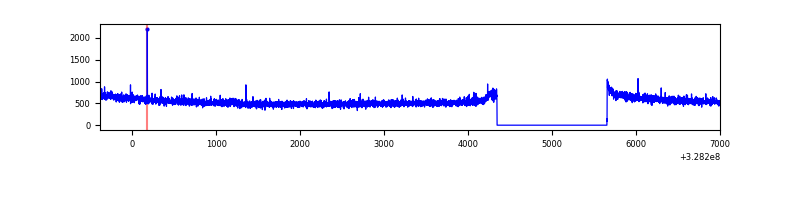 |
| B | 7381 | 6072 | 4 | 4 | 0.05% | 0.07% | 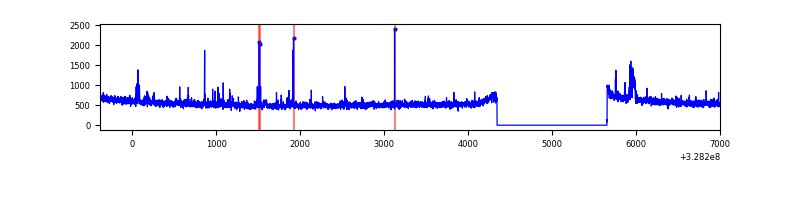 |
| C | 7382 | 6073 | 0 | 0 | 0.00% | 0.00% | 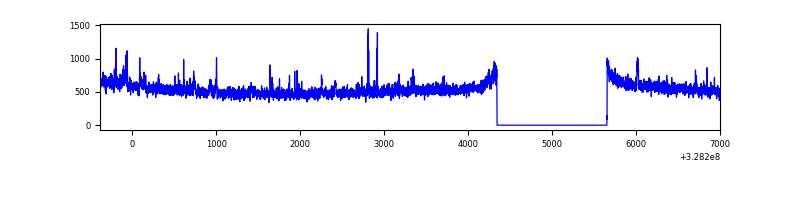 |
| D | 7382 | 6073 | 64 | 64 | 0.87% | 1.05% | 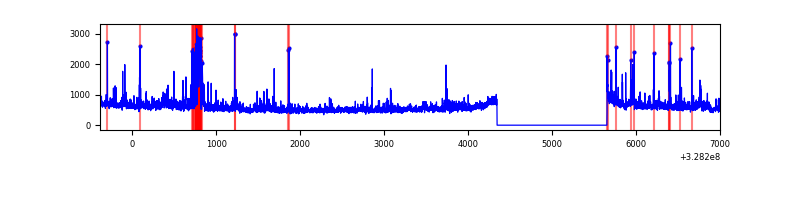 |
Top three noisy pixels from each quadrant. If the there are fewer than three noisy pixels in the level2.evt file, extra rows are filled as -1
| Pixel properties | Quadrant properties | ||||||
|---|---|---|---|---|---|---|---|
| Quadrant | DetID | PixID | Counts | Sigma | Mean | Median | Sigma |
| A | 13 | 254 | 9304 | 50.45 | 852 | 839 | 167.8 |
| A | 0 | 226 | 7618 | 40.4 | 852 | 839 | 167.8 |
| A | 3 | 137 | 7120 | 37.43 | 852 | 839 | 167.8 |
| B | 0 | 190 | 65363 | 419.73 | 838 | 823 | 153.8 |
| B | 3 | 64 | 30974 | 196.08 | 838 | 823 | 153.8 |
| B | 12 | 111 | 17860 | 110.8 | 838 | 823 | 153.8 |
| C | 14 | 238 | 133215 | 736.13 | 789 | 796 | 179.9 |
| C | 7 | 247 | 79719 | 438.74 | 789 | 796 | 179.9 |
| C | 2 | 16 | 9164 | 46.52 | 789 | 796 | 179.9 |
| D | 12 | 233 | 297295 | 1526.56 | 810 | 788 | 194.2 |
| D | 8 | 195 | 207146 | 1062.43 | 810 | 788 | 194.2 |
| D | 1 | 52 | 106136 | 542.38 | 810 | 788 | 194.2 |
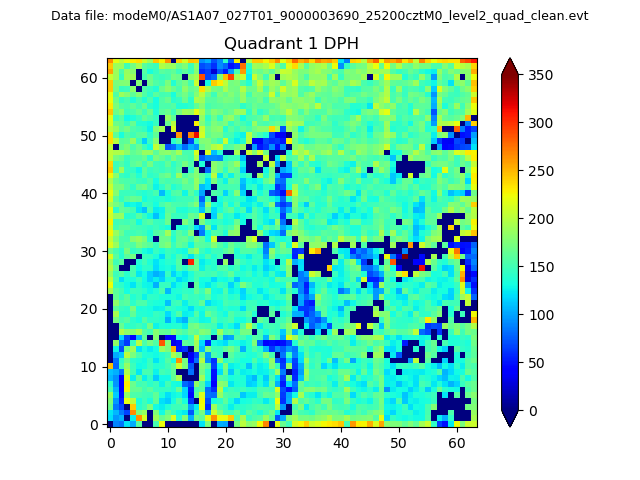
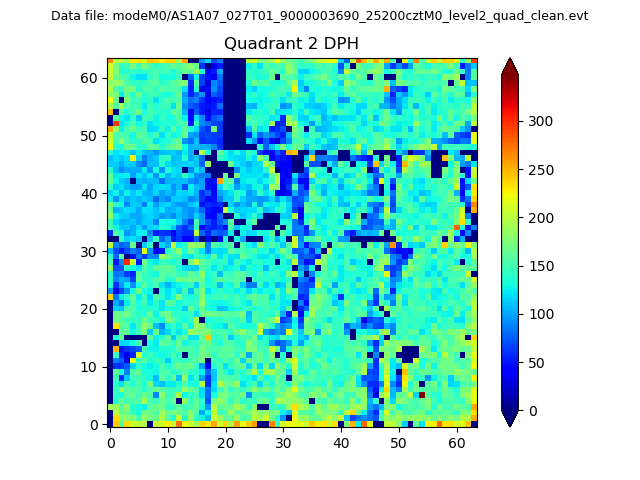
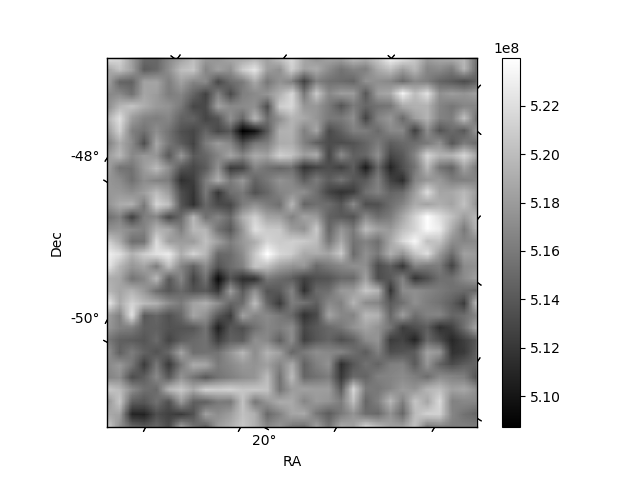
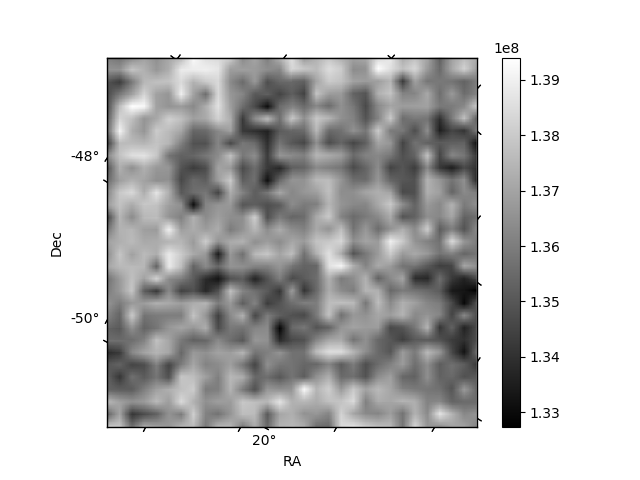
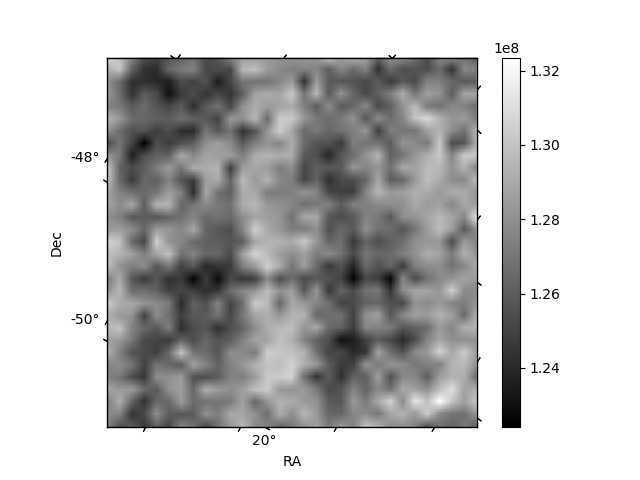
Histogram calculated using DETX and DETY for each event in the final _common_clean file
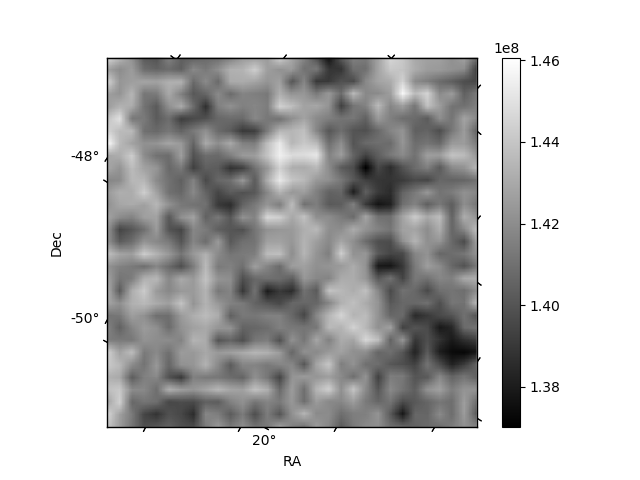
| Quadrant A |  |
 |
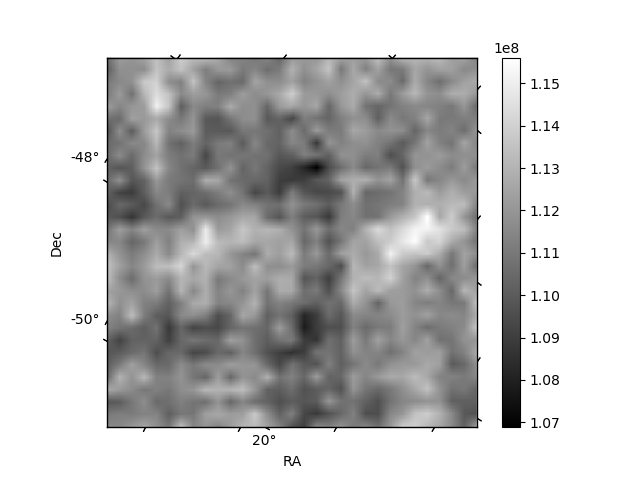
Quadrant B |
|---|---|---|---|
| Quadrant D | 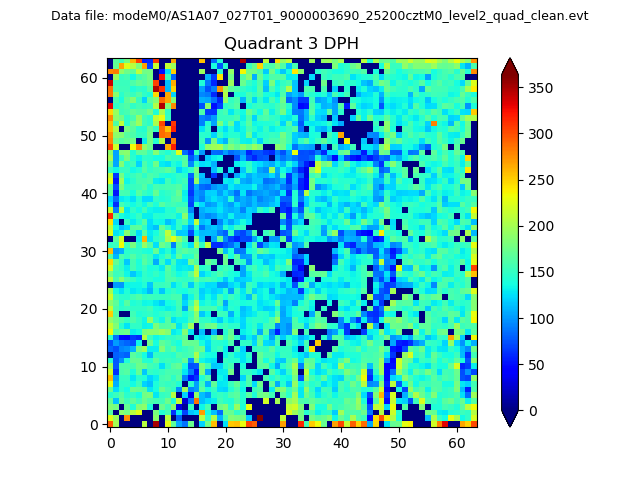 |
 |
Quadrant C |
| Plot type | Count rate plots | Images |
|---|---|---|
| Comparison with Poisson distribution Blue bars denote a histogram of data divided into 1 sec bins. Red curve is a Poisson curve with rate = median count rate of data. |
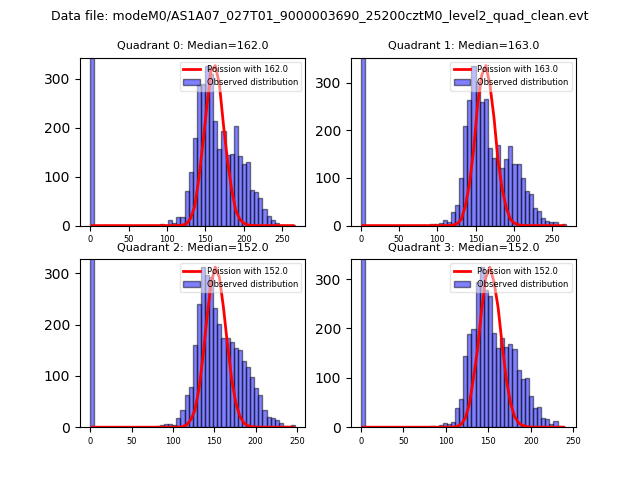 |
 |
| Quadrant-wise count rates Data is divided into 100 sec bins |
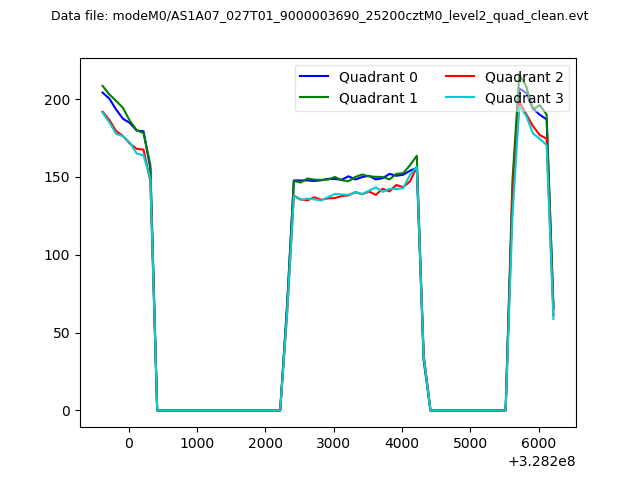 |
|
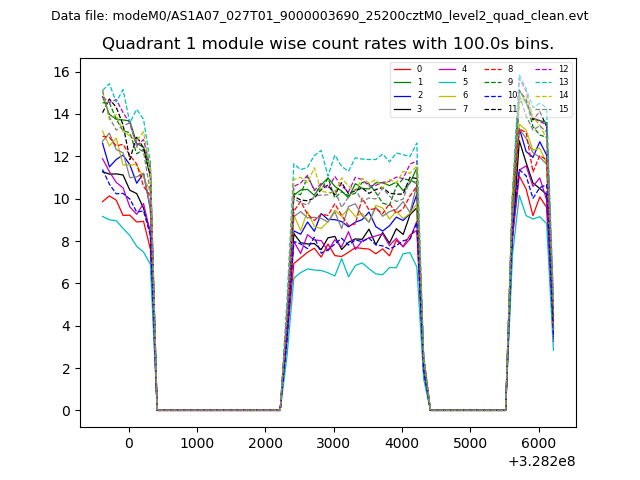
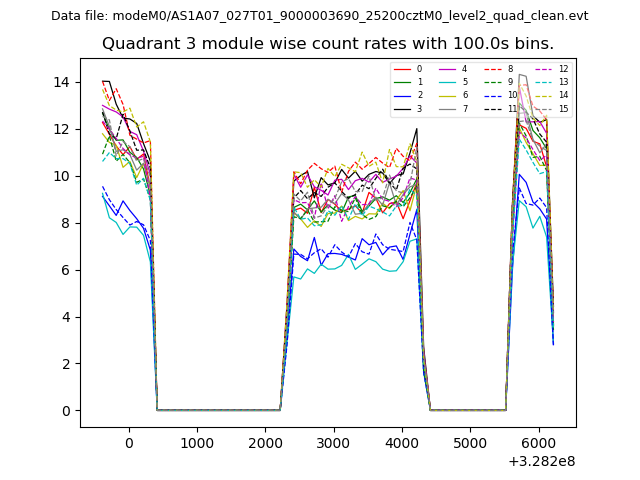
| Module-wise count rates for Quadrant A Data is divided into 100 sec bins |
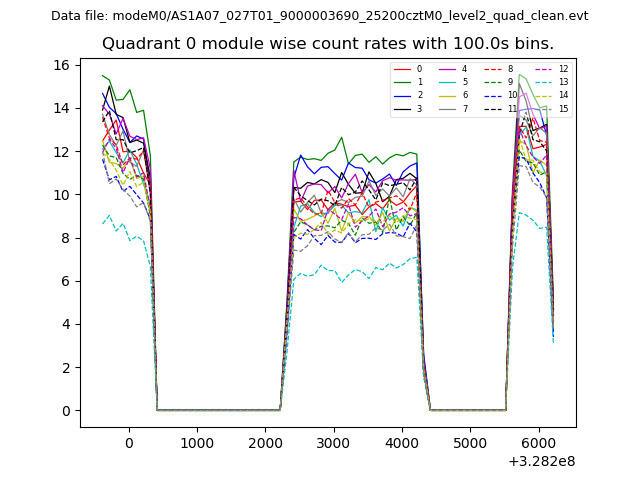 |
 |
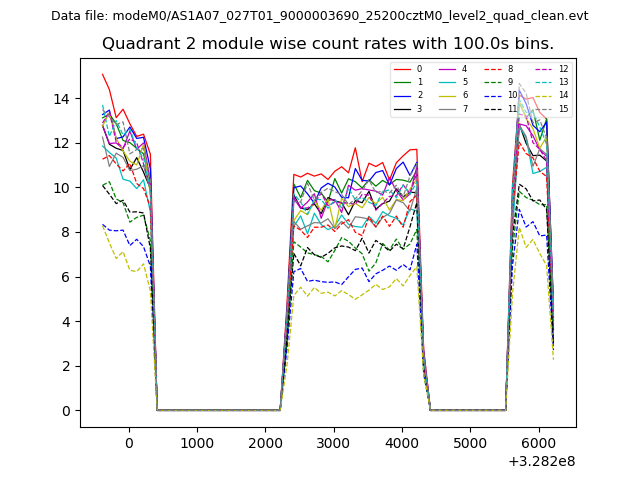
| Module-wise count rates for Quadrant B Data is divided into 100 sec bins |
 |
 |
| Module-wise count rates for Quadrant C Data is divided into 100 sec bins |
 |
 |
| Module-wise count rates for Quadrant D Data is divided into 100 sec bins |
 |
 |
| Parameter | Plot |
|---|---|
| CZT HV Monitor | 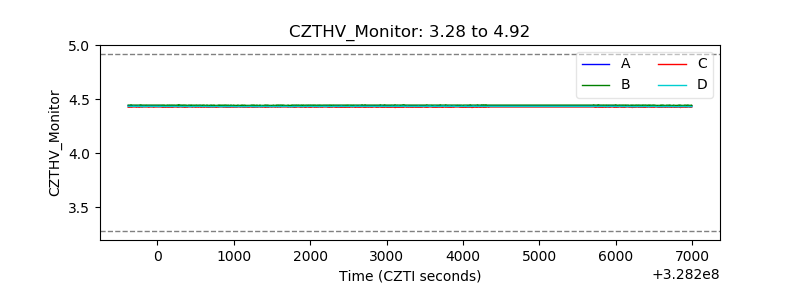 |
| D_VDD | 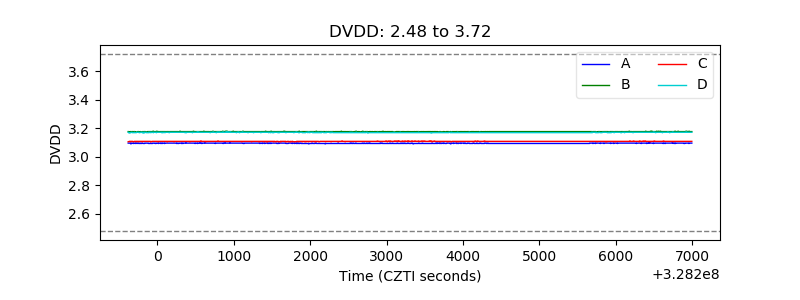 |
| Temperature 1 | 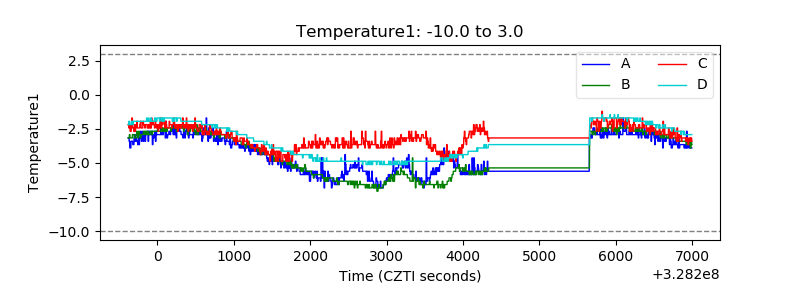 |
| Veto HV Monitor | 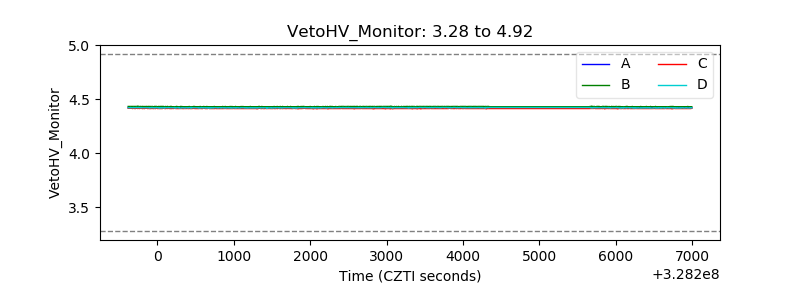 |
| Veto LLD | 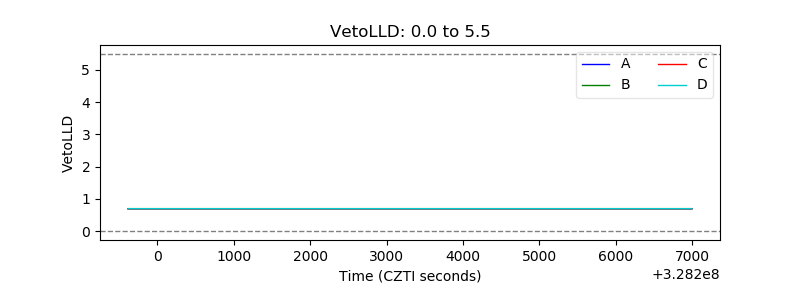 |
| Alpha Counter | 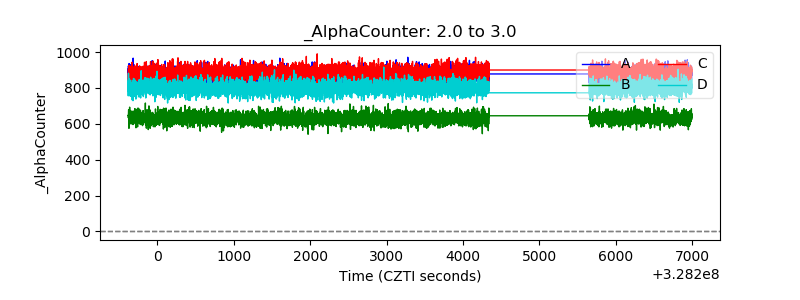 |
| _CPM_Rate | 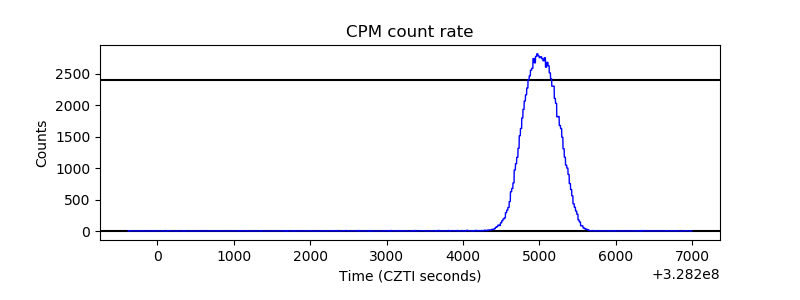 |
| CZT Counter | 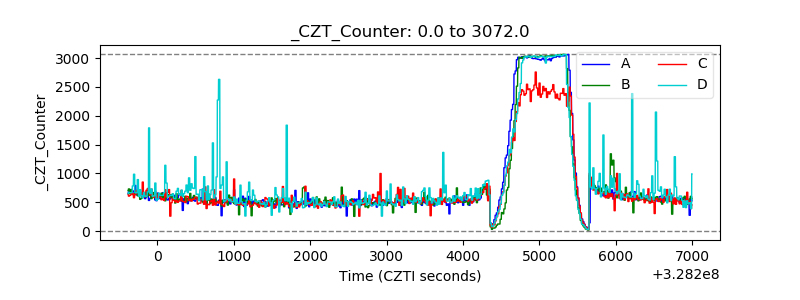 |
| +2.5 Volts monitor |  |
| +5 Volts monitor | 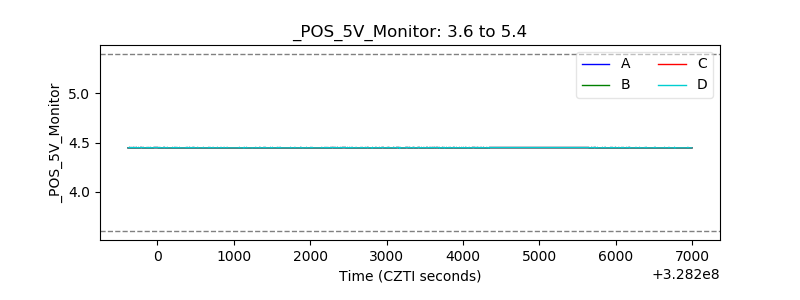 |
| _ROLL_ROT | 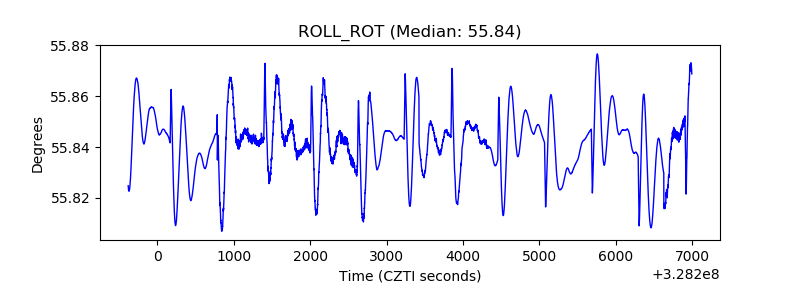 |
| _Roll_DEC | 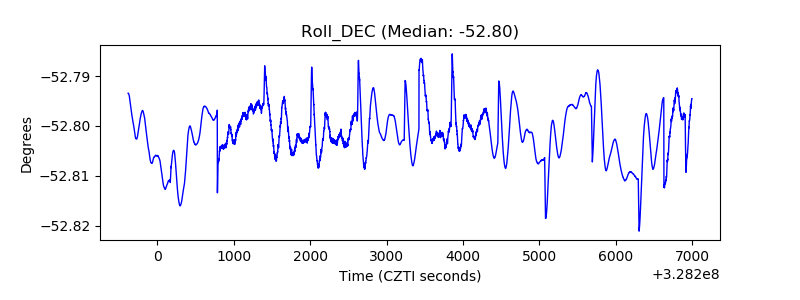 |
| _Roll_RA | 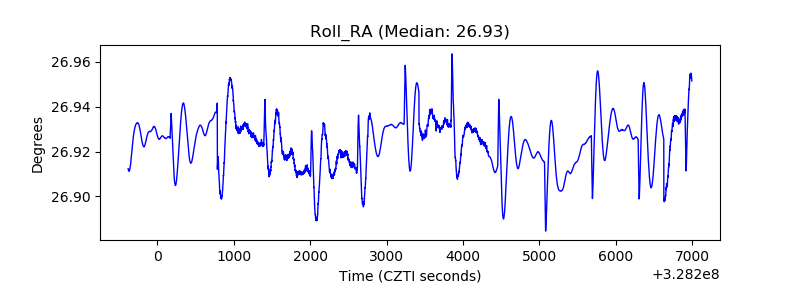 |
| Veto Counter | 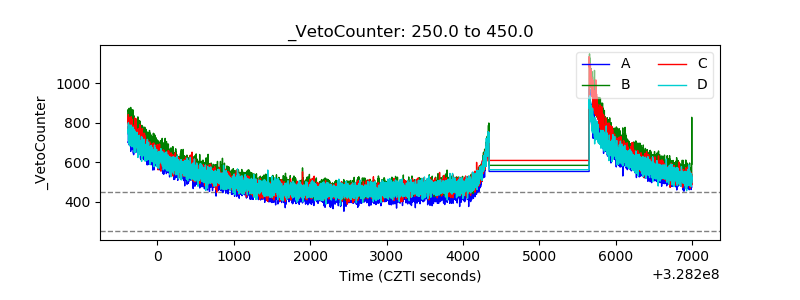 |