| Param | Original file | Final file |
|---|---|---|
| Filename | modeM0/AS1A07_027T01_9000003690_25203cztM0_level2.evt | modeM0/AS1A07_027T01_9000003690_25203cztM0_level2_quad_clean.evt |
| Size (bytes) | 465,923,520 | 78,480,000 |
| Size | 444.3 MB | 74.8 MB |
| Events in quadrant A | 3,109,580 | 493,995 |
| Events in quadrant B | 3,482,630 | 496,323 |
| Events in quadrant C | 3,201,449 | 472,498 |
| Events in quadrant D | 3,880,286 | 465,026 |
| Mode M9 | |||
|---|---|---|---|
| Quadrant | BADHDUFLAG | Total packets | Discarded packets |
| A | 0 | 10 | 0 |
| B | 0 | 10 | 0 |
| C | 0 | 10 | 0 |
| D | 0 | 10 | 0 |
| Mode M0 | |||
|---|---|---|---|
| Quadrant | BADHDUFLAG | Total packets | Discarded packets |
| A | 0 | 13178 | 0 |
| B | 0 | 14253 | 0 |
| C | 0 | 13391 | 0 |
| D | 0 | 15742 | 0 |
| Quadrant | Total seconds | Saturated seconds | Saturation percentage |
|---|---|---|---|
| A | 6437 | 53 | 0.823365% |
| B | 6438 | 95 | 1.475614% |
| C | 6438 | 74 | 1.149425% |
| D | 6438 | 106 | 1.646474% |
Noise dominated data is calculated using 1-second bins in cleaned event files. If a bin has >2000 counts, and if more than 50% of those come from <1% of pixels, then it is considered to be noise-dominated and hence unusable.
| Quadrant | # 1 sec bins | Bins with >0 counts | Bins with >2000 counts | High rate bins dominated by noise | Noise dominated (total time) | Noise dominated (detector-on time) | Marked lightcurve |
|---|---|---|---|---|---|---|---|
| A | 7347 | 6438 | 0 | 0 | 0.00% | 0.00% | 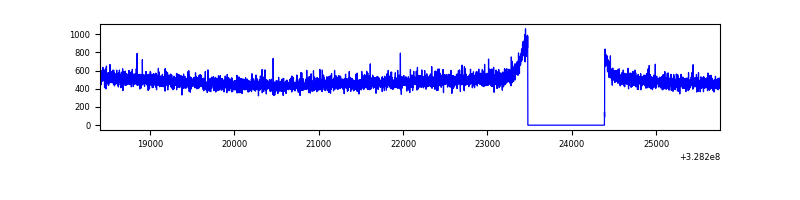 |
| B | 7348 | 6439 | 14 | 14 | 0.19% | 0.22% | 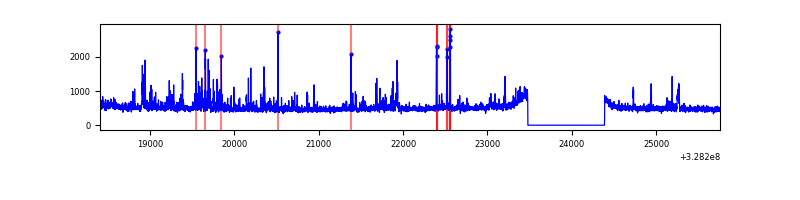 |
| C | 7348 | 6439 | 3 | 3 | 0.04% | 0.05% | 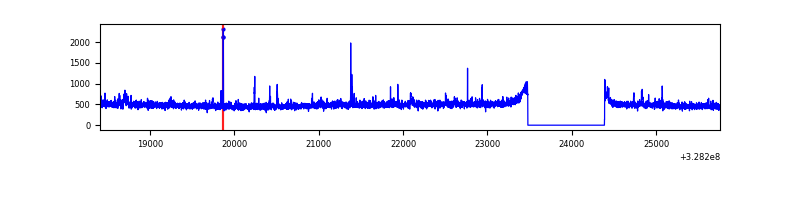 |
| D | 7348 | 6439 | 36 | 36 | 0.49% | 0.56% | 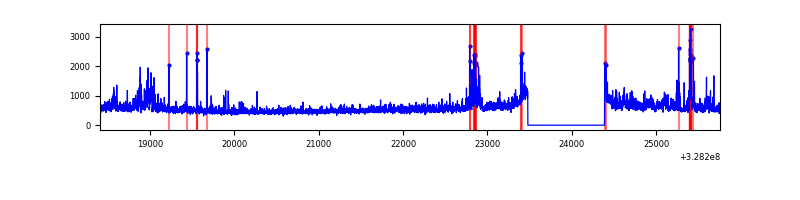 |
Top three noisy pixels from each quadrant. If the there are fewer than three noisy pixels in the level2.evt file, extra rows are filled as -1
| Pixel properties | Quadrant properties | ||||||
|---|---|---|---|---|---|---|---|
| Quadrant | DetID | PixID | Counts | Sigma | Mean | Median | Sigma |
| A | 13 | 254 | 10282 | 58.85 | 806 | 788 | 161.3 |
| A | 3 | 137 | 7473 | 41.44 | 806 | 788 | 161.3 |
| A | 0 | 226 | 6779 | 37.14 | 806 | 788 | 161.3 |
| B | 5 | 235 | 290107 | 1903.88 | 797 | 777 | 152.0 |
| B | 3 | 64 | 26157 | 167.01 | 797 | 777 | 152.0 |
| B | 12 | 111 | 18603 | 117.3 | 797 | 777 | 152.0 |
| C | 14 | 238 | 121779 | 676.62 | 765 | 771 | 178.8 |
| C | 7 | 247 | 55199 | 304.34 | 765 | 771 | 178.8 |
| C | 3 | 233 | 15968 | 84.97 | 765 | 771 | 178.8 |
| D | 8 | 195 | 450517 | 2404.15 | 776 | 754 | 187.1 |
| D | 1 | 52 | 134452 | 714.67 | 776 | 754 | 187.1 |
| D | 12 | 235 | 127724 | 678.7 | 776 | 754 | 187.1 |
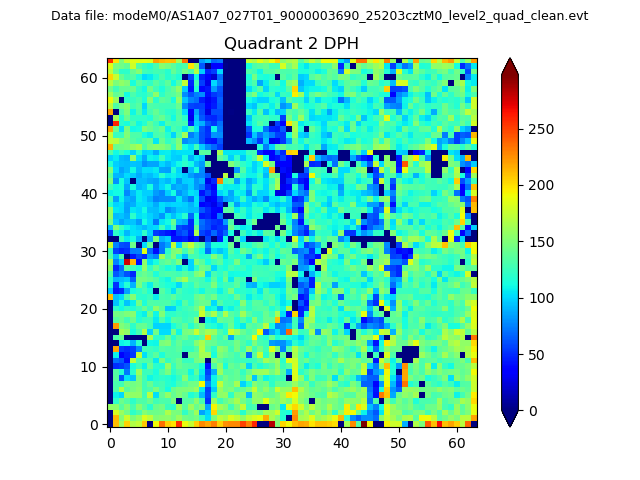
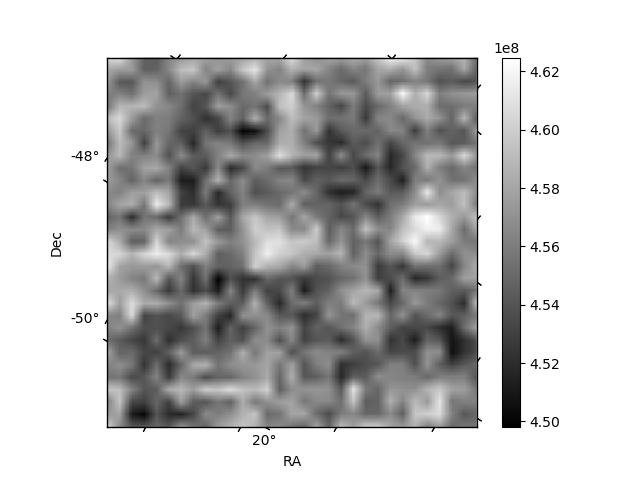
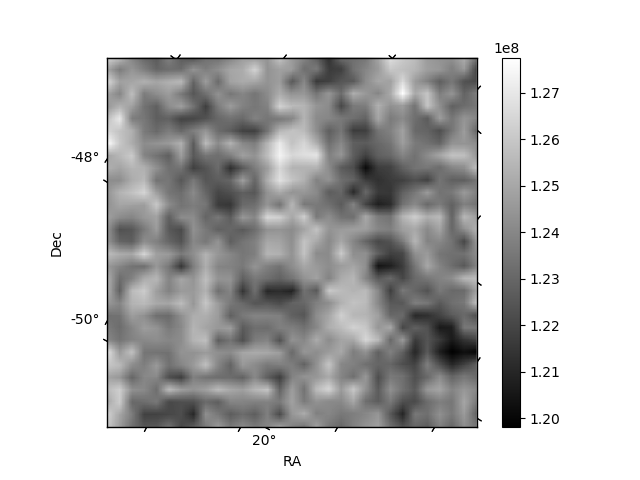
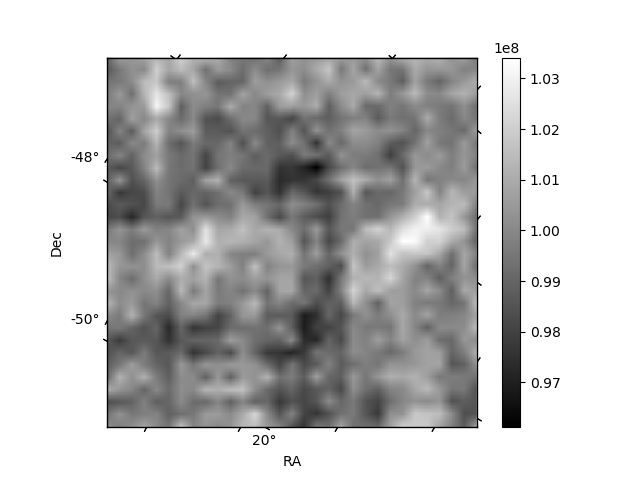
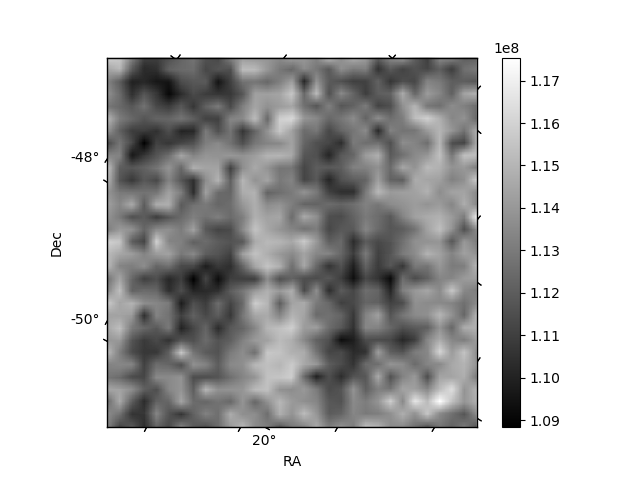
Histogram calculated using DETX and DETY for each event in the final _common_clean file
| Quadrant A | 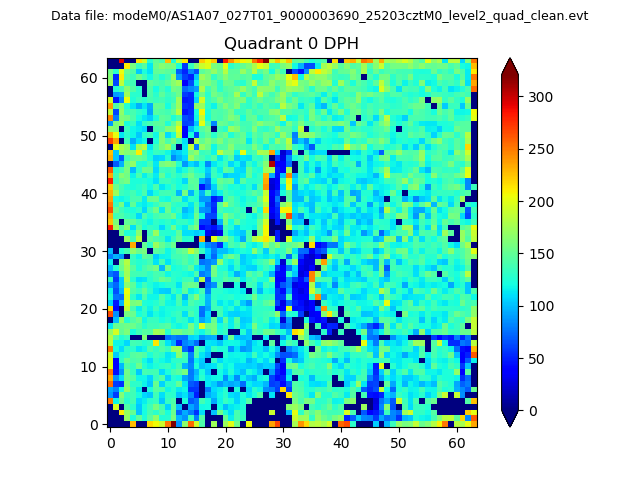 |
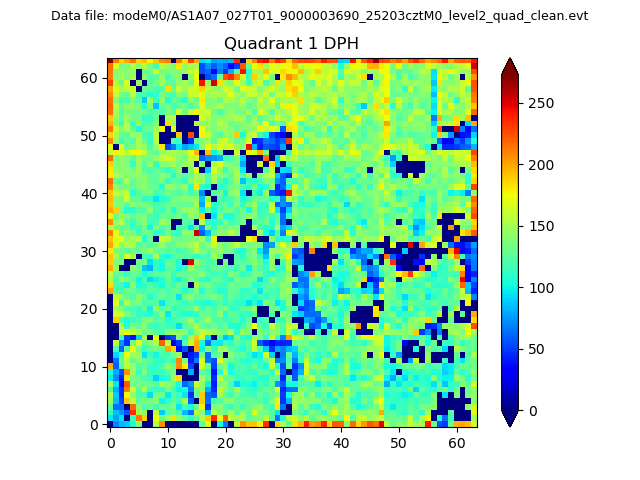 |
Quadrant B |
|---|---|---|---|
| Quadrant D | 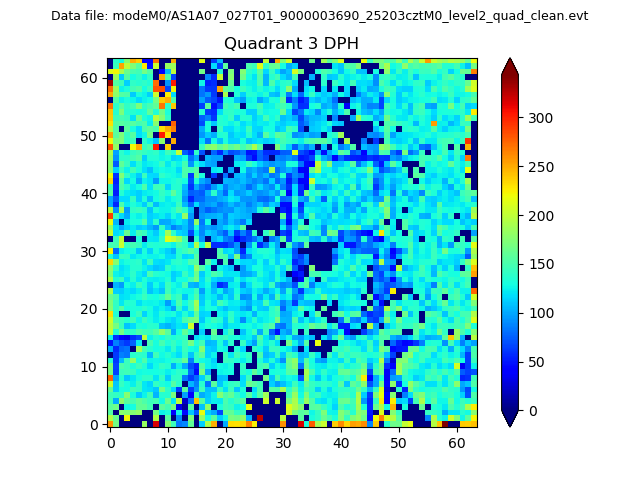 |
 |
Quadrant C |
| Plot type | Count rate plots | Images |
|---|---|---|
| Comparison with Poisson distribution Blue bars denote a histogram of data divided into 1 sec bins. Red curve is a Poisson curve with rate = median count rate of data. |
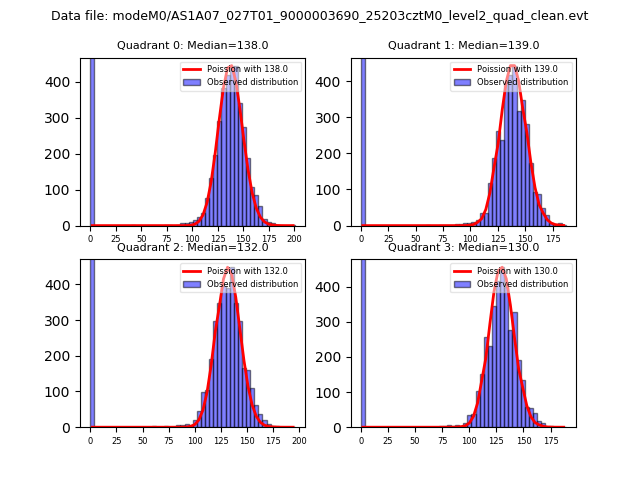 |
 |
| Quadrant-wise count rates Data is divided into 100 sec bins |
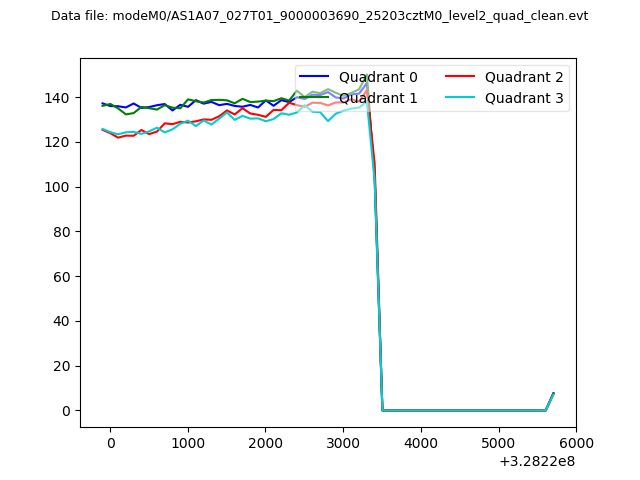 |
|
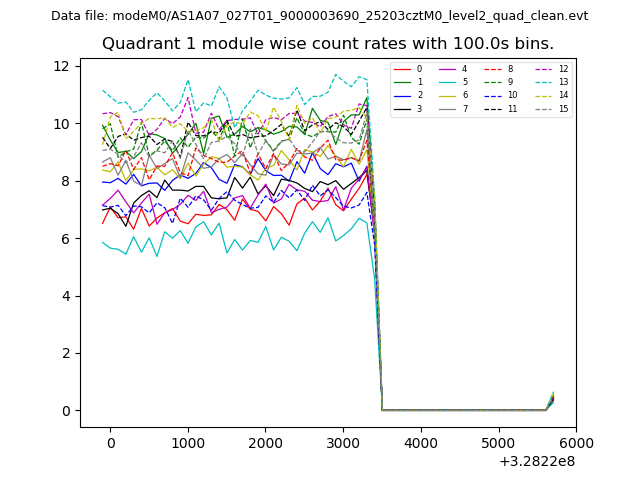
| Module-wise count rates for Quadrant A Data is divided into 100 sec bins |
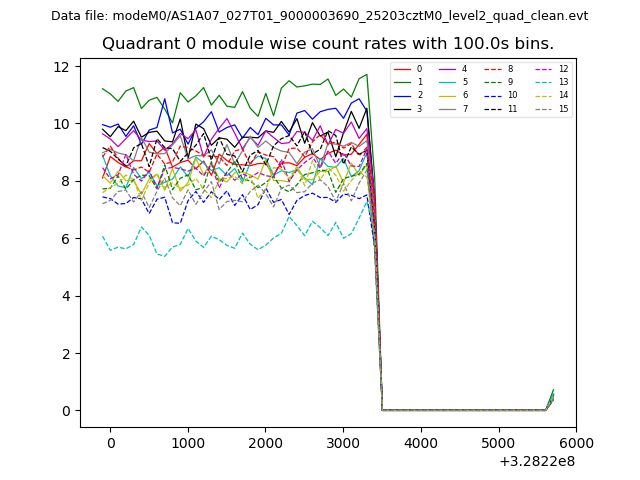 |
 |
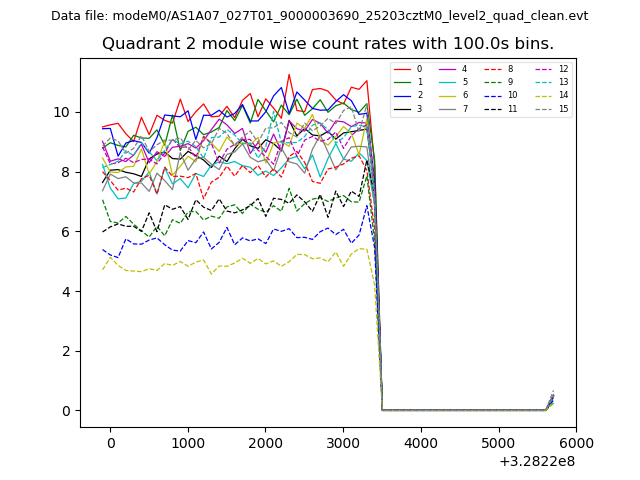
| Module-wise count rates for Quadrant B Data is divided into 100 sec bins |
 |
 |
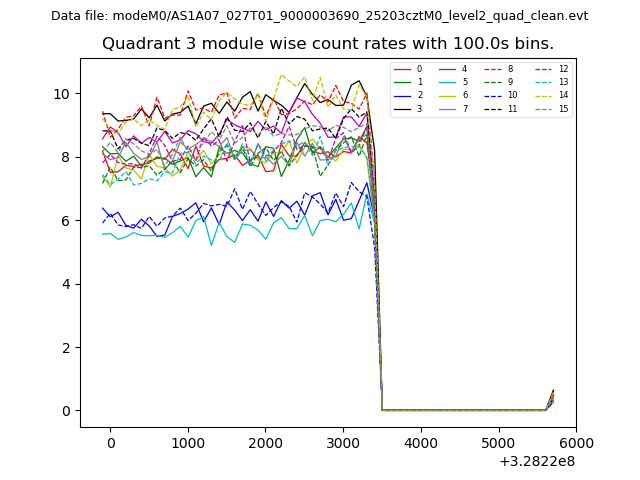
| Module-wise count rates for Quadrant C Data is divided into 100 sec bins |
 |
 |
| Module-wise count rates for Quadrant D Data is divided into 100 sec bins |
 |
 |
| Parameter | Plot |
|---|---|
| CZT HV Monitor | 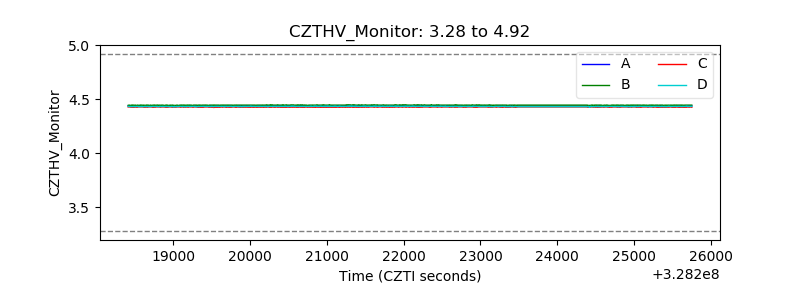 |
| D_VDD | 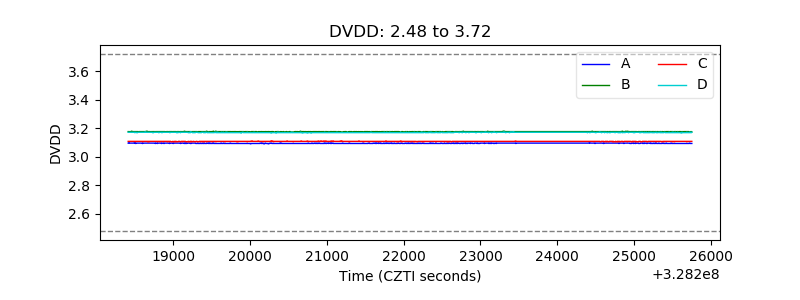 |
| Temperature 1 | 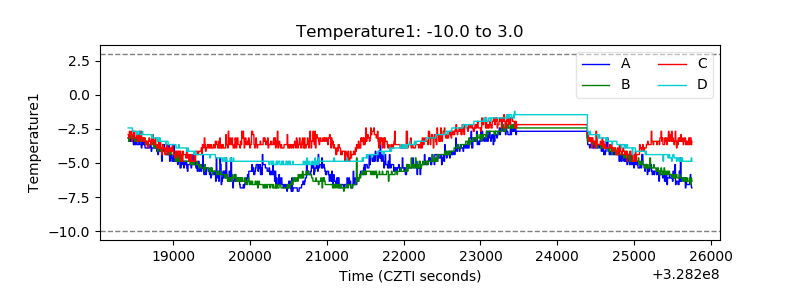 |
| Veto HV Monitor | 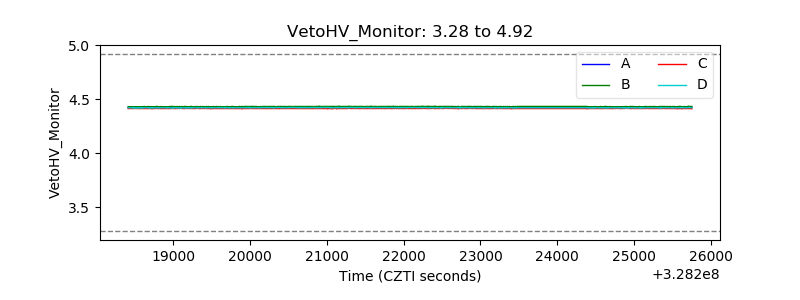 |
| Veto LLD | 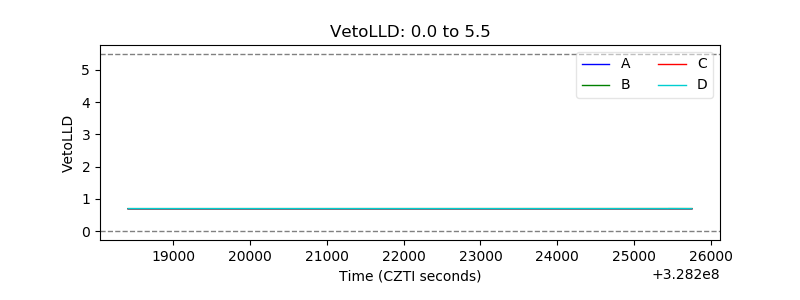 |
| Alpha Counter | 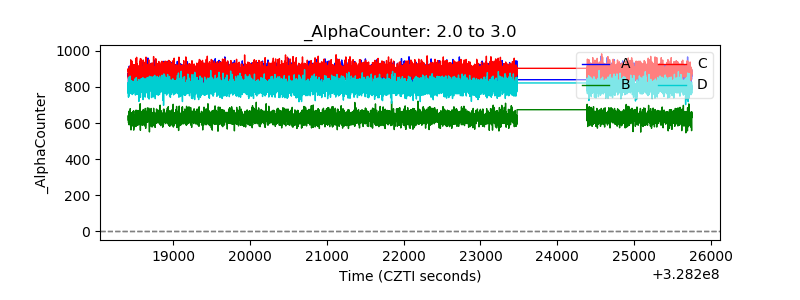 |
| _CPM_Rate | 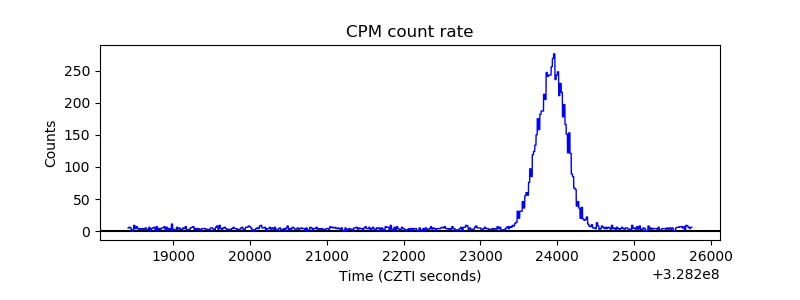 |
| CZT Counter |  |
| +2.5 Volts monitor |  |
| +5 Volts monitor |  |
| _ROLL_ROT | 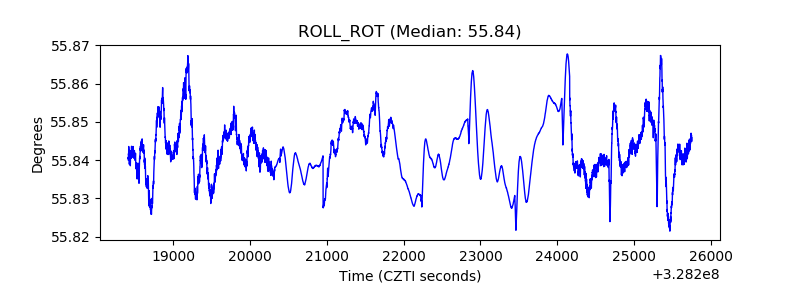 |
| _Roll_DEC | 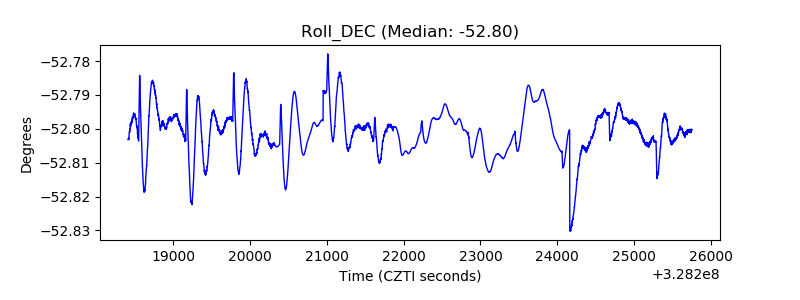 |
| _Roll_RA | 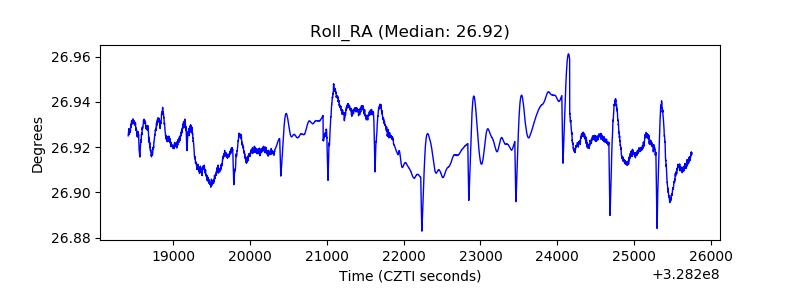 |
| Veto Counter | 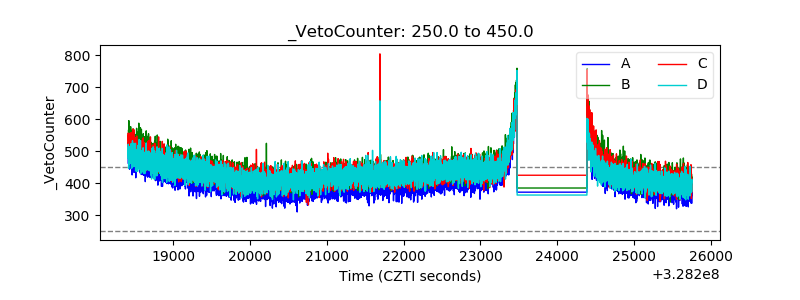 |