| Param | Original file | Final file |
|---|---|---|
| Filename | modeM0/AS1A07_027T01_9000003690_25204cztM0_level2.evt | modeM0/AS1A07_027T01_9000003690_25204cztM0_level2_quad_clean.evt |
| Size (bytes) | 541,825,920 | 89,470,080 |
| Size | 516.7 MB | 85.3 MB |
| Events in quadrant A | 3,374,906 | 569,077 |
| Events in quadrant B | 4,084,322 | 567,757 |
| Events in quadrant C | 3,463,385 | 544,336 |
| Events in quadrant D | 5,003,785 | 532,330 |
| Mode M9 | |||
|---|---|---|---|
| Quadrant | BADHDUFLAG | Total packets | Discarded packets |
| A | 0 | 6 | 0 |
| B | 0 | 7 | 0 |
| C | 0 | 7 | 0 |
| D | 0 | 7 | 0 |
| Mode M0 | |||
|---|---|---|---|
| Quadrant | BADHDUFLAG | Total packets | Discarded packets |
| A | 0 | 14567 | 0 |
| B | 0 | 16760 | 0 |
| C | 0 | 14751 | 0 |
| D | 0 | 19801 | 0 |
| Quadrant | Total seconds | Saturated seconds | Saturation percentage |
|---|---|---|---|
| A | 7130 | 57 | 0.799439% |
| B | 7130 | 126 | 1.767181% |
| C | 7130 | 94 | 1.318373% |
| D | 7130 | 140 | 1.963534% |
Noise dominated data is calculated using 1-second bins in cleaned event files. If a bin has >2000 counts, and if more than 50% of those come from <1% of pixels, then it is considered to be noise-dominated and hence unusable.
| Quadrant | # 1 sec bins | Bins with >0 counts | Bins with >2000 counts | High rate bins dominated by noise | Noise dominated (total time) | Noise dominated (detector-on time) | Marked lightcurve |
|---|---|---|---|---|---|---|---|
| A | 7660 | 7131 | 0 | 0 | 0.00% | 0.00% |  |
| B | 7660 | 7131 | 20 | 20 | 0.26% | 0.28% |  |
| C | 7660 | 7131 | 0 | 0 | 0.00% | 0.00% |  |
| D | 7660 | 7131 | 72 | 72 | 0.94% | 1.01% |  |
Top three noisy pixels from each quadrant. If the there are fewer than three noisy pixels in the level2.evt file, extra rows are filled as -1
| Pixel properties | Quadrant properties | ||||||
|---|---|---|---|---|---|---|---|
| Quadrant | DetID | PixID | Counts | Sigma | Mean | Median | Sigma |
| A | 13 | 254 | 11931 | 62.75 | 875 | 855 | 176.5 |
| A | 3 | 137 | 8325 | 42.32 | 875 | 855 | 176.5 |
| A | 0 | 226 | 7402 | 37.09 | 875 | 855 | 176.5 |
| B | 5 | 235 | 640973 | 3936.85 | 862 | 842 | 162.6 |
| B | 3 | 64 | 21628 | 127.84 | 862 | 842 | 162.6 |
| B | 12 | 111 | 20441 | 120.54 | 862 | 842 | 162.6 |
| C | 14 | 238 | 133018 | 674.88 | 832 | 835 | 195.9 |
| C | 7 | 247 | 61203 | 308.22 | 832 | 835 | 195.9 |
| C | 3 | 233 | 14754 | 71.07 | 832 | 835 | 195.9 |
| D | 8 | 195 | 1182406 | 5792.67 | 841 | 818 | 204.0 |
| D | 2 | 244 | 218667 | 1067.99 | 841 | 818 | 204.0 |
| D | 12 | 235 | 186090 | 908.29 | 841 | 818 | 204.0 |
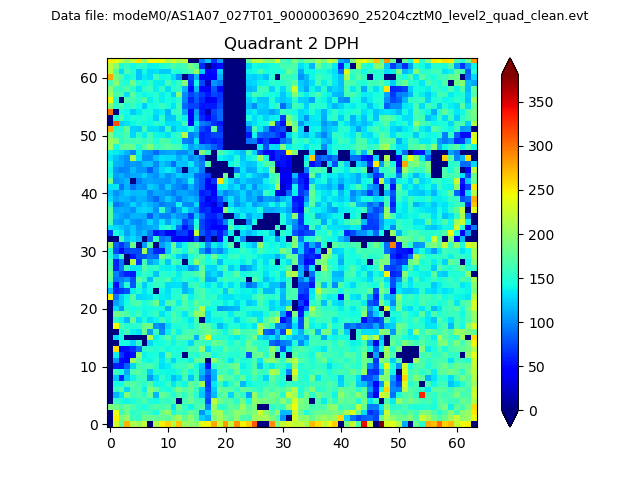
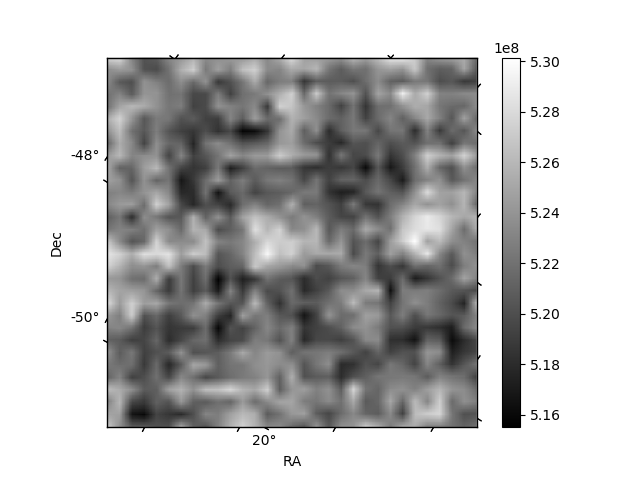
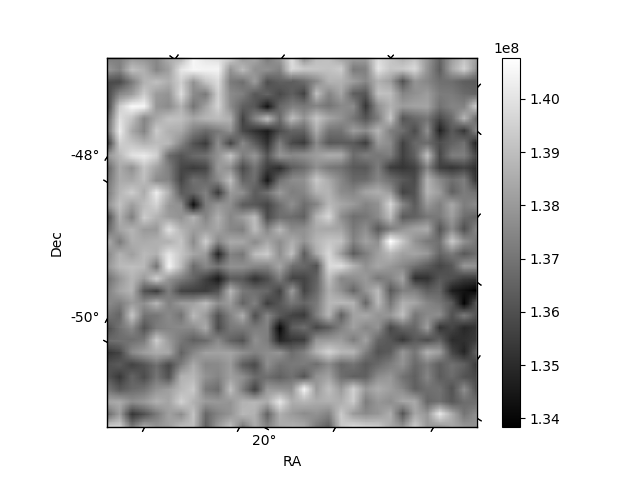
Histogram calculated using DETX and DETY for each event in the final _common_clean file
| Quadrant A | 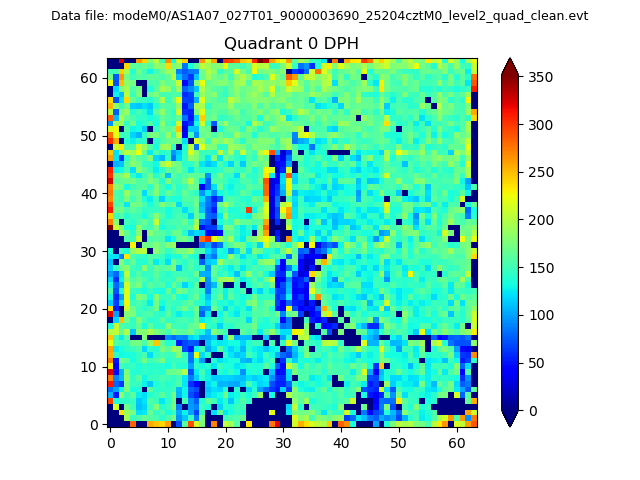 |
 |
Quadrant B |
|---|---|---|---|
| Quadrant D | 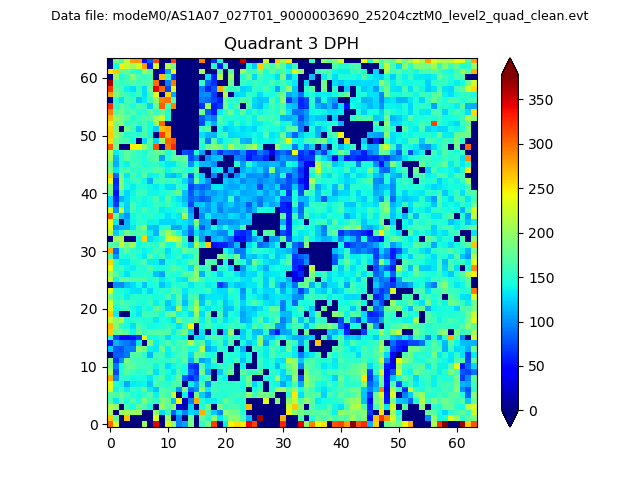 |
 |
Quadrant C |
| Plot type | Count rate plots | Images |
|---|---|---|
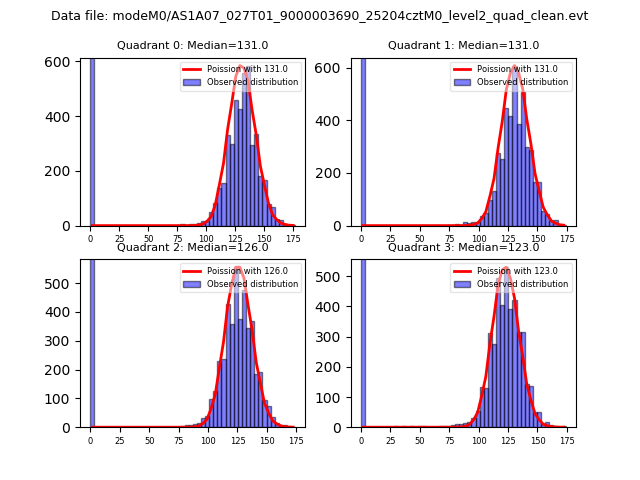
| Comparison with Poisson distribution Blue bars denote a histogram of data divided into 1 sec bins. Red curve is a Poisson curve with rate = median count rate of data. |
 |
 |
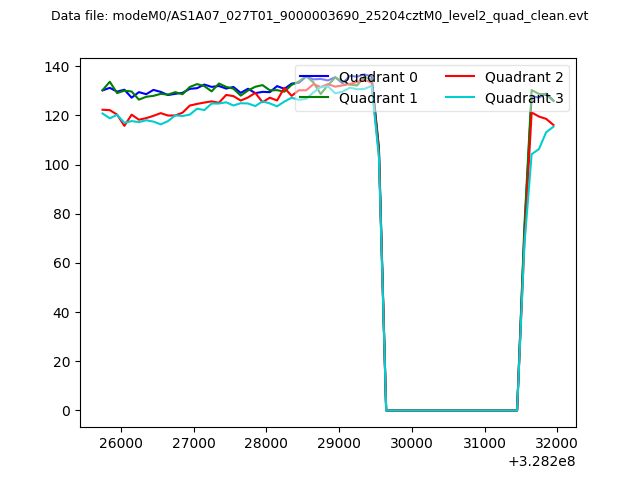
| Quadrant-wise count rates Data is divided into 100 sec bins |
 |
|
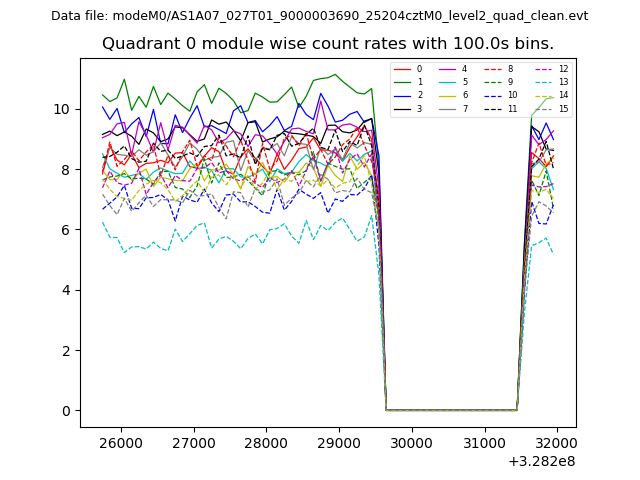
| Module-wise count rates for Quadrant A Data is divided into 100 sec bins |
 |
 |
| Module-wise count rates for Quadrant B Data is divided into 100 sec bins |
 |
 |
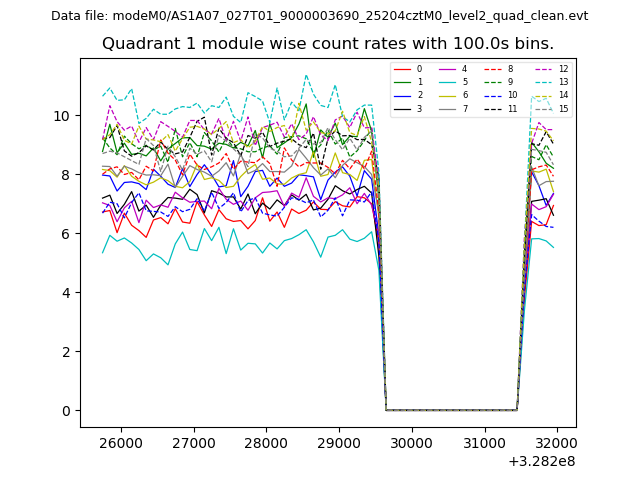
| Module-wise count rates for Quadrant C Data is divided into 100 sec bins |
 |
 |
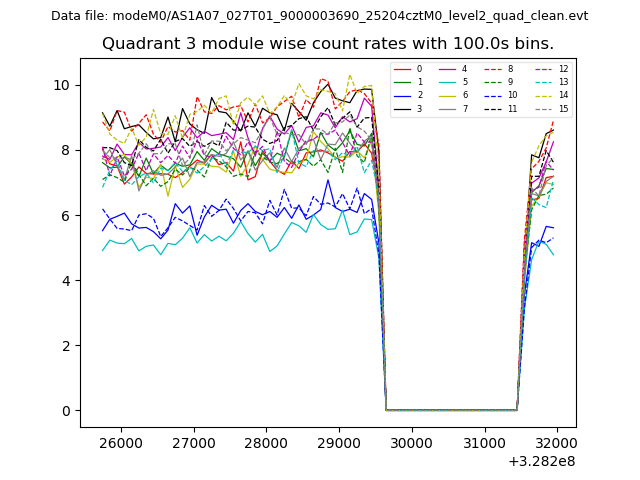
| Module-wise count rates for Quadrant D Data is divided into 100 sec bins |
 |
 |
| Parameter | Plot |
|---|---|
| CZT HV Monitor | 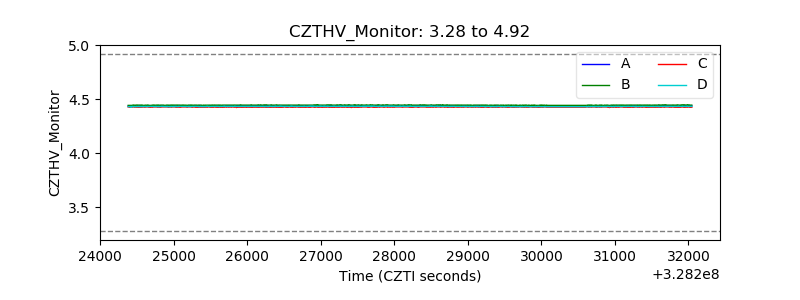 |
| D_VDD | 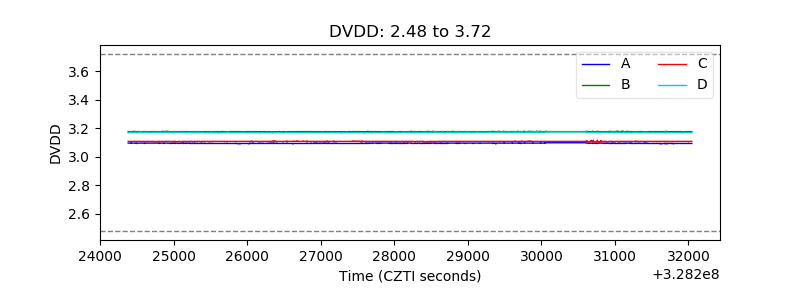 |
| Temperature 1 | 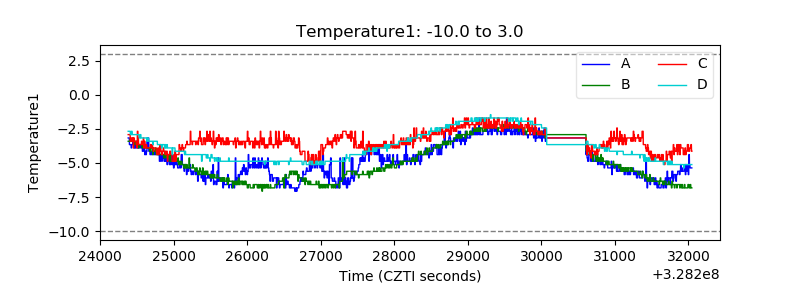 |
| Veto HV Monitor | 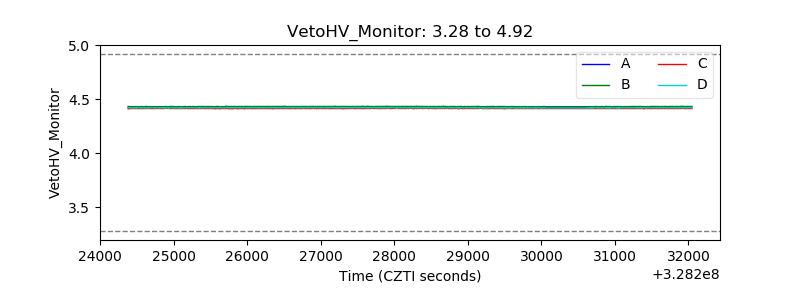 |
| Veto LLD | 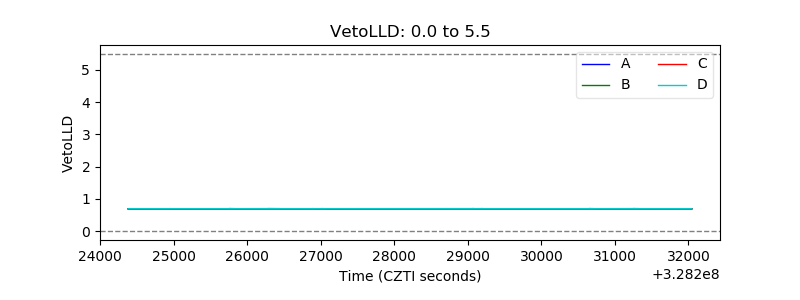 |
| Alpha Counter | 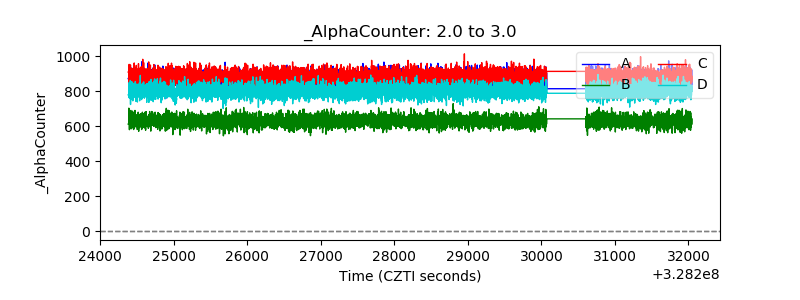 |
| _CPM_Rate | 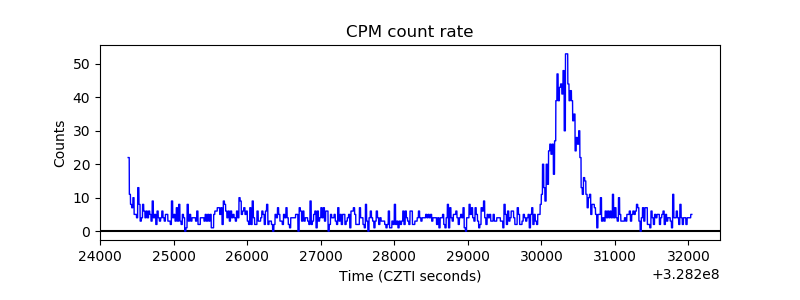 |
| CZT Counter | 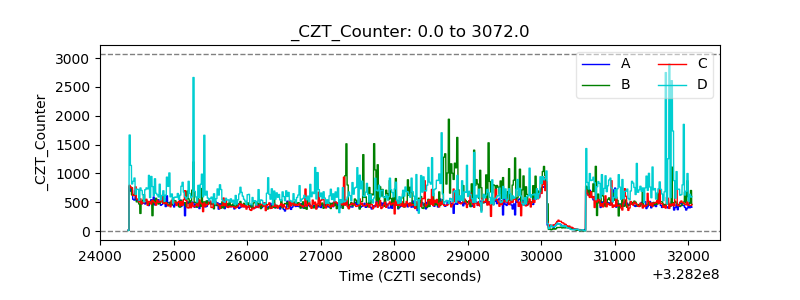 |
| +2.5 Volts monitor | 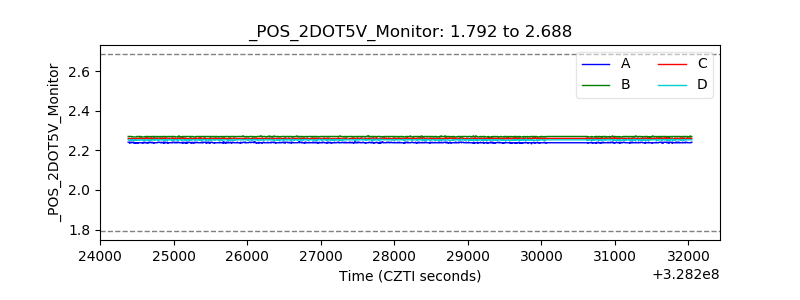 |
| +5 Volts monitor | 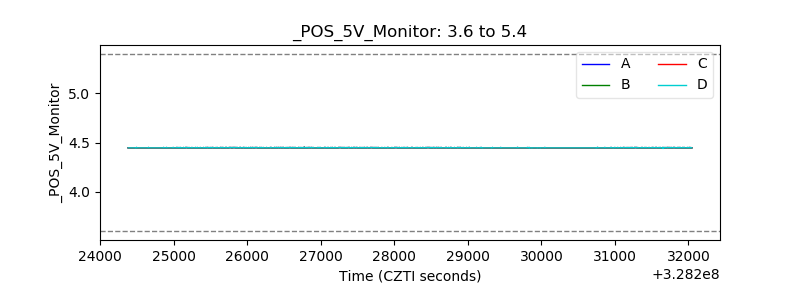 |
| _ROLL_ROT | 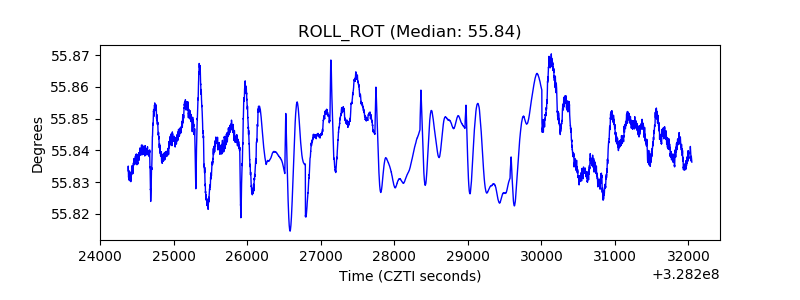 |
| _Roll_DEC | 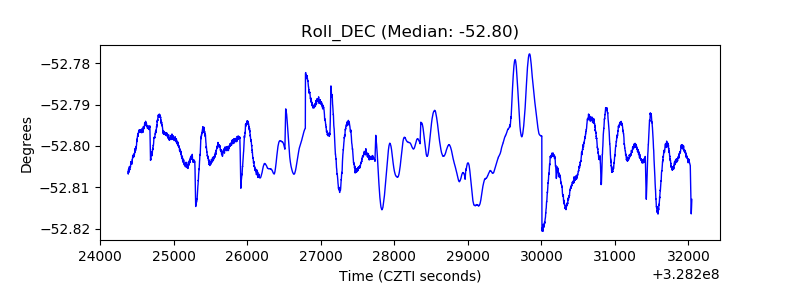 |
| _Roll_RA | 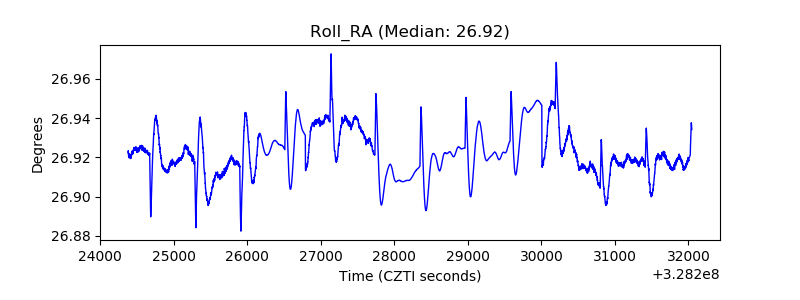 |
| Veto Counter |  |