| Param | Original file | Final file |
|---|---|---|
| Filename | modeM0/AS1A07_027T01_9000003690_25205cztM0_level2.evt | modeM0/AS1A07_027T01_9000003690_25205cztM0_level2_quad_clean.evt |
| Size (bytes) | 517,158,720 | 94,887,360 |
| Size | 493.2 MB | 90.5 MB |
| Events in quadrant A | 3,268,691 | 614,195 |
| Events in quadrant B | 3,588,890 | 615,311 |
| Events in quadrant C | 3,417,994 | 586,957 |
| Events in quadrant D | 4,909,744 | 567,487 |
| Mode M9 | |||
|---|---|---|---|
| Quadrant | BADHDUFLAG | Total packets | Discarded packets |
| A | 0 | 3 | 0 |
| B | 0 | 3 | 0 |
| C | 0 | 3 | 0 |
| D | 0 | 3 | 0 |
| Mode M0 | |||
|---|---|---|---|
| Quadrant | BADHDUFLAG | Total packets | Discarded packets |
| A | 0 | 14287 | 0 |
| B | 0 | 15142 | 0 |
| C | 0 | 14615 | 0 |
| D | 0 | 19269 | 0 |
| Quadrant | Total seconds | Saturated seconds | Saturation percentage |
|---|---|---|---|
| A | 7030 | 30 | 0.426743% |
| B | 7031 | 84 | 1.194709% |
| C | 7031 | 94 | 1.336936% |
| D | 7030 | 283 | 4.025605% |
Noise dominated data is calculated using 1-second bins in cleaned event files. If a bin has >2000 counts, and if more than 50% of those come from <1% of pixels, then it is considered to be noise-dominated and hence unusable.
| Quadrant | # 1 sec bins | Bins with >0 counts | Bins with >2000 counts | High rate bins dominated by noise | Noise dominated (total time) | Noise dominated (detector-on time) | Marked lightcurve |
|---|---|---|---|---|---|---|---|
| A | 7350 | 7031 | 0 | 0 | 0.00% | 0.00% | 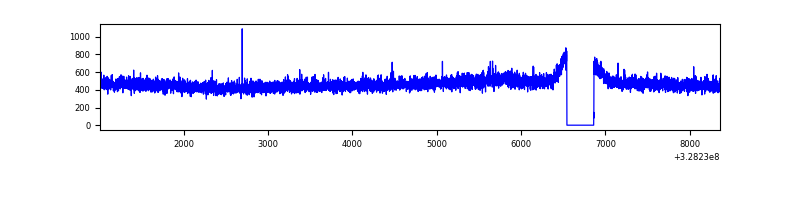 |
| B | 7351 | 7032 | 15 | 15 | 0.20% | 0.21% | 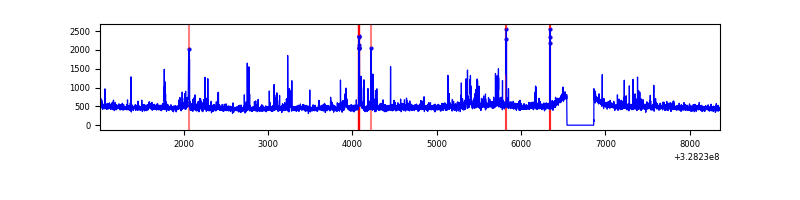 |
| C | 7351 | 7032 | 0 | 0 | 0.00% | 0.00% | 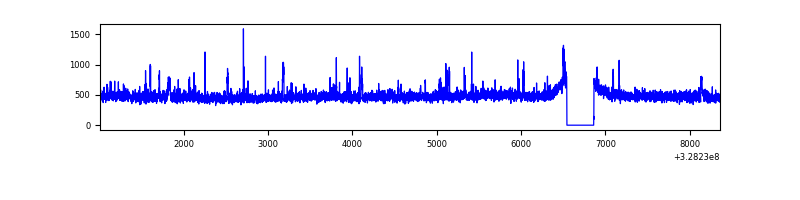 |
| D | 7350 | 7031 | 258 | 258 | 3.51% | 3.67% | 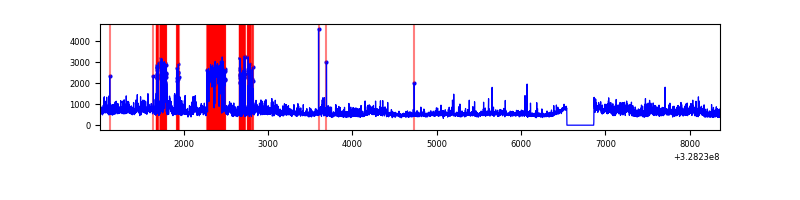 |
Top three noisy pixels from each quadrant. If the there are fewer than three noisy pixels in the level2.evt file, extra rows are filled as -1
| Pixel properties | Quadrant properties | ||||||
|---|---|---|---|---|---|---|---|
| Quadrant | DetID | PixID | Counts | Sigma | Mean | Median | Sigma |
| A | 13 | 254 | 11362 | 62.1 | 846 | 825 | 169.7 |
| A | 3 | 137 | 7957 | 42.03 | 846 | 825 | 169.7 |
| A | 0 | 226 | 7189 | 37.5 | 846 | 825 | 169.7 |
| B | 5 | 235 | 267609 | 1655.31 | 839 | 817 | 161.2 |
| B | 12 | 111 | 19934 | 118.61 | 839 | 817 | 161.2 |
| B | 11 | 111 | 18335 | 108.69 | 839 | 817 | 161.2 |
| C | 14 | 238 | 129898 | 679.43 | 807 | 814 | 190.0 |
| C | 7 | 247 | 105459 | 550.8 | 807 | 814 | 190.0 |
| C | 3 | 233 | 29125 | 149.01 | 807 | 814 | 190.0 |
| D | 8 | 195 | 964471 | 4848.18 | 813 | 788 | 198.8 |
| D | 2 | 244 | 678005 | 3407.0 | 813 | 788 | 198.8 |
| D | 12 | 235 | 105443 | 526.51 | 813 | 788 | 198.8 |
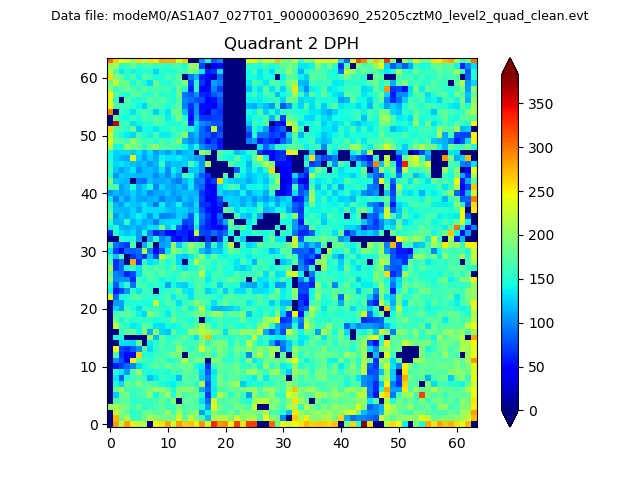
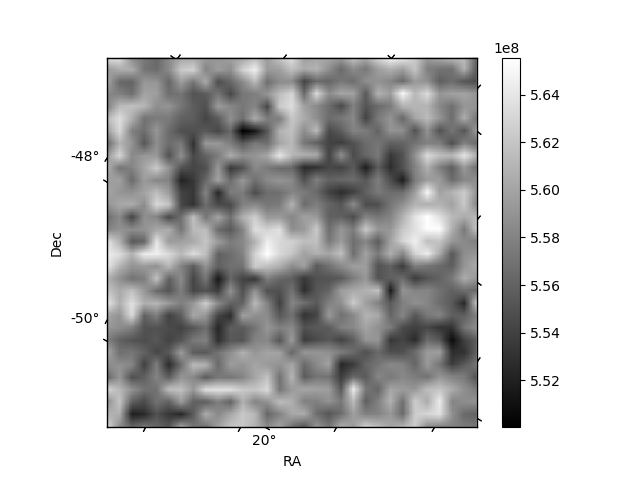
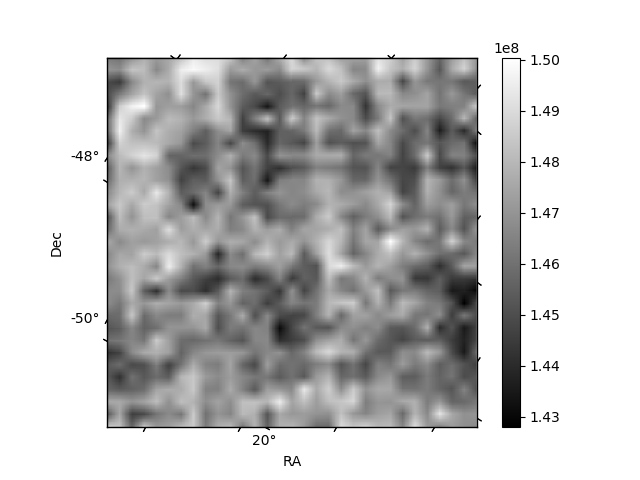
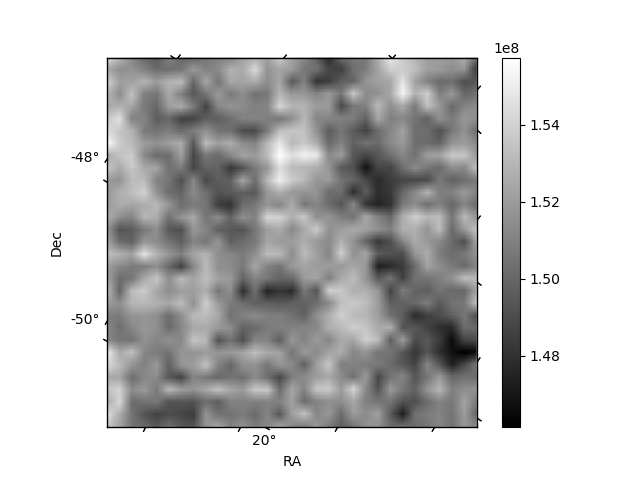
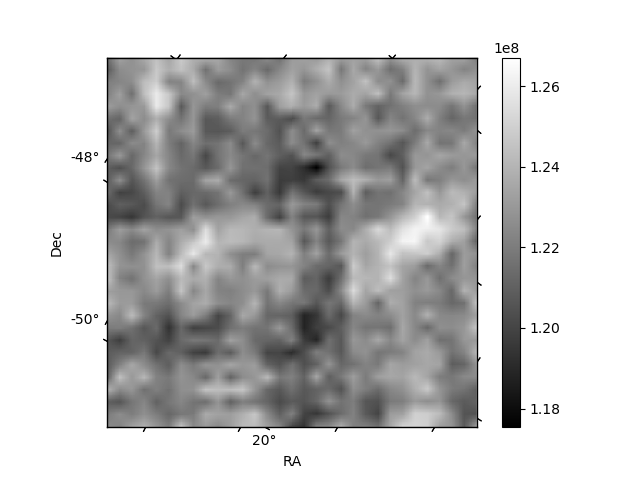
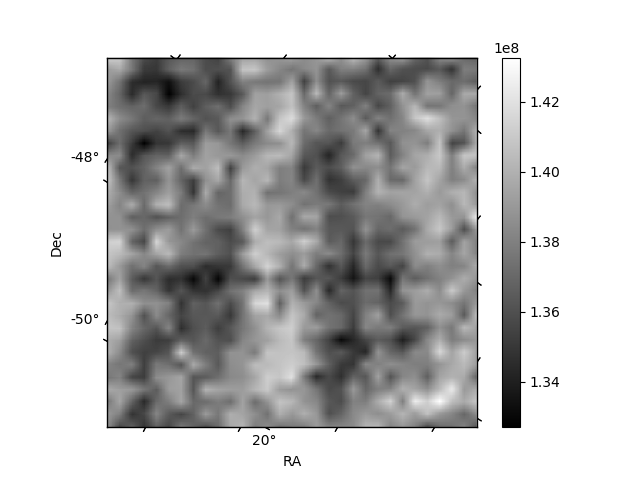
Histogram calculated using DETX and DETY for each event in the final _common_clean file
| Quadrant A | 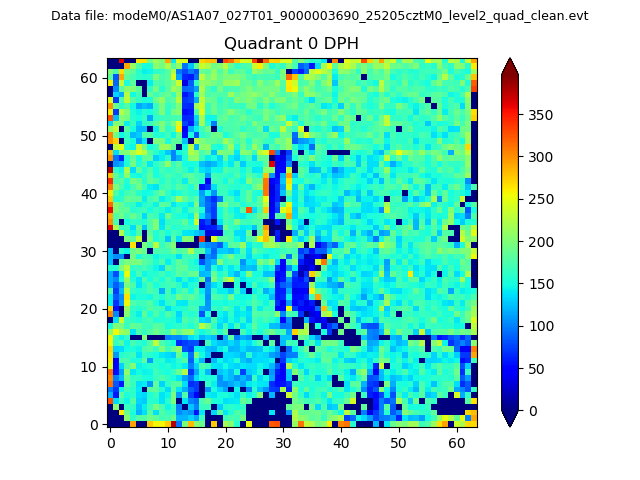 |
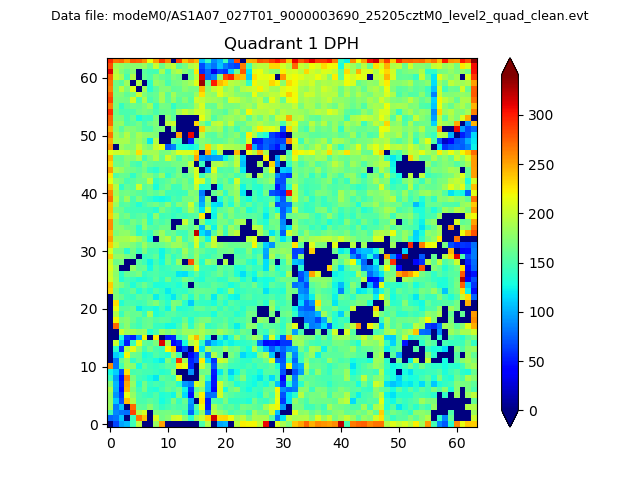 |
Quadrant B |
|---|---|---|---|
| Quadrant D | 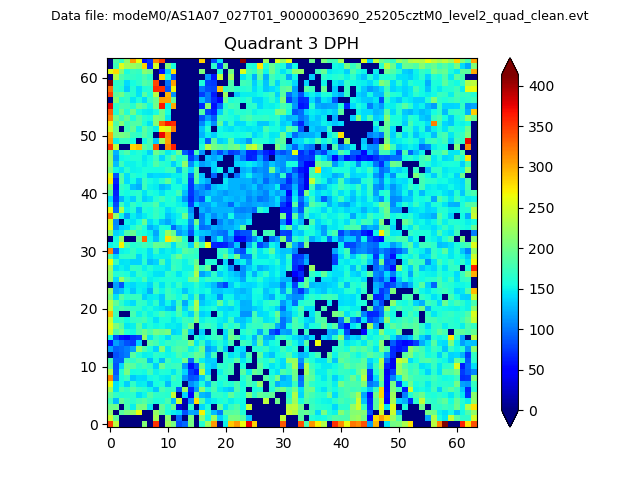 |
 |
Quadrant C |
| Plot type | Count rate plots | Images |
|---|---|---|
| Comparison with Poisson distribution Blue bars denote a histogram of data divided into 1 sec bins. Red curve is a Poisson curve with rate = median count rate of data. |
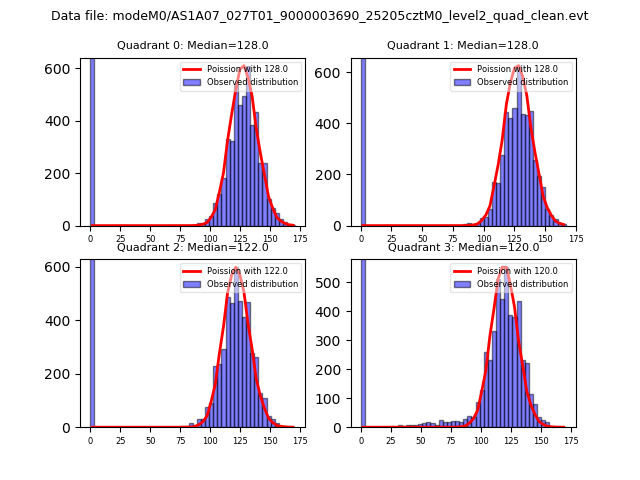 |
 |
| Quadrant-wise count rates Data is divided into 100 sec bins |
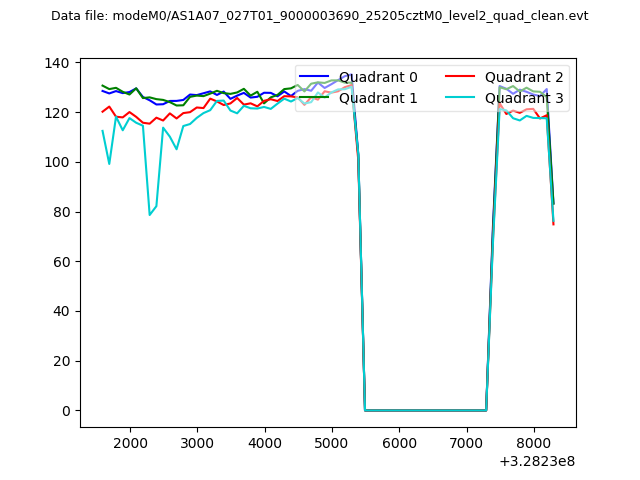 |
|
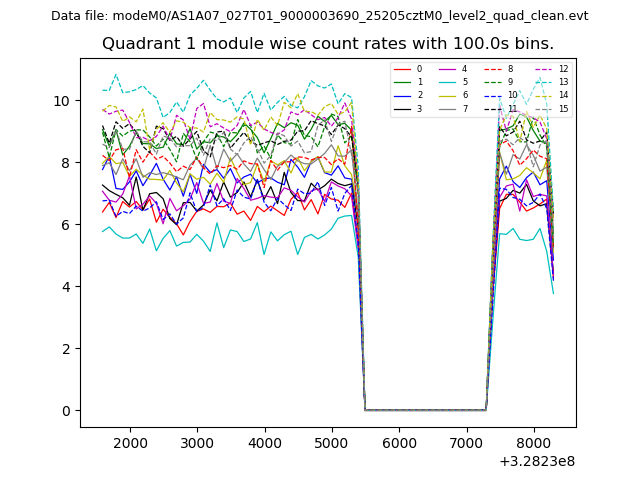
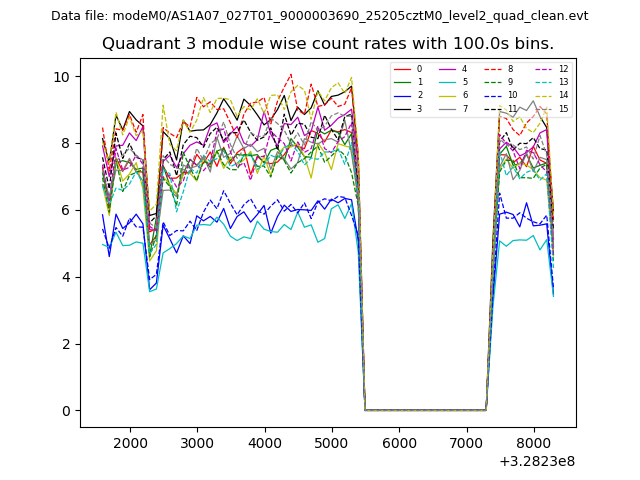
| Module-wise count rates for Quadrant A Data is divided into 100 sec bins |
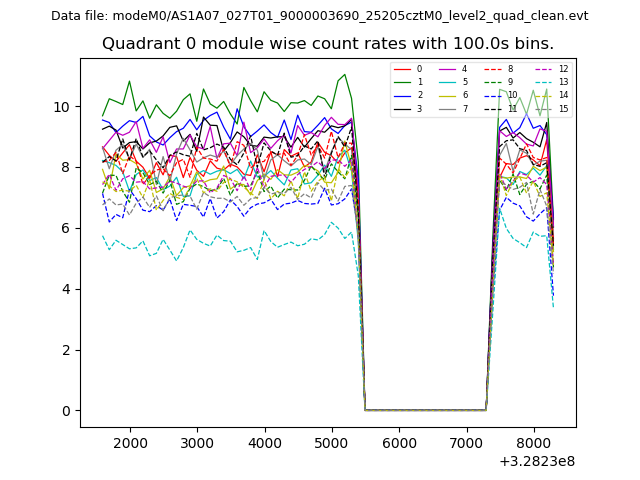 |
 |
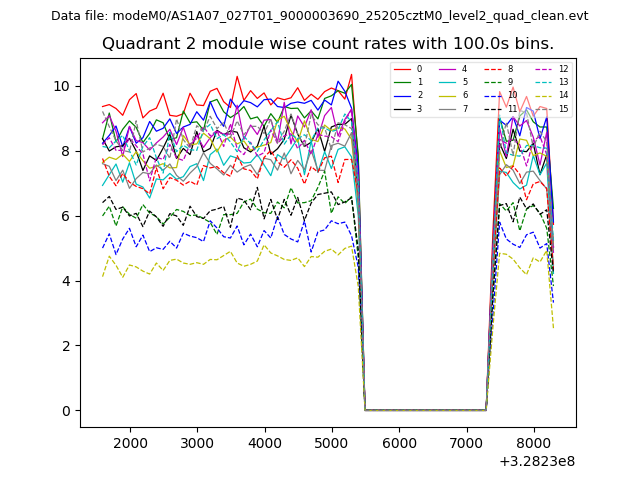
| Module-wise count rates for Quadrant B Data is divided into 100 sec bins |
 |
 |
| Module-wise count rates for Quadrant C Data is divided into 100 sec bins |
 |
 |
| Module-wise count rates for Quadrant D Data is divided into 100 sec bins |
 |
 |
| Parameter | Plot |
|---|---|
| CZT HV Monitor | 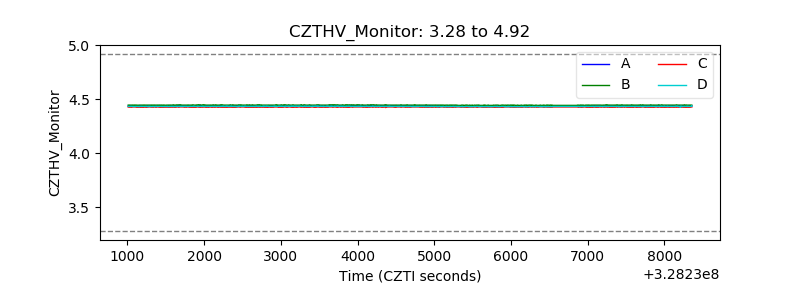 |
| D_VDD | 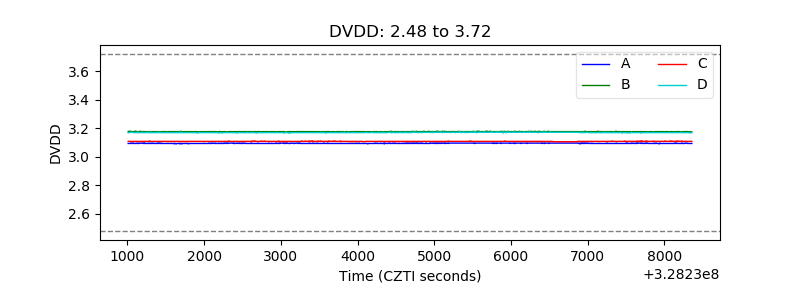 |
| Temperature 1 | 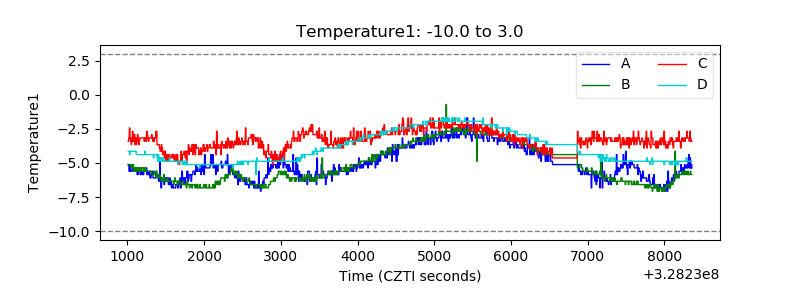 |
| Veto HV Monitor | 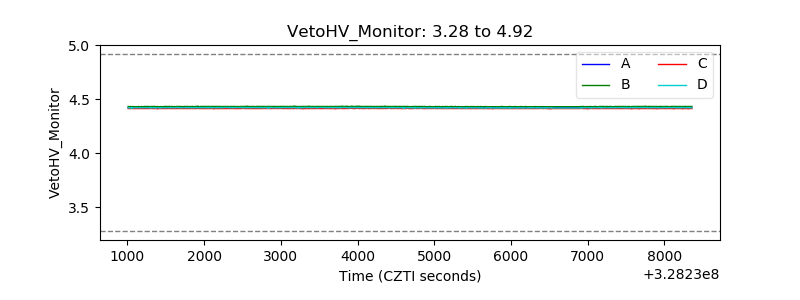 |
| Veto LLD | 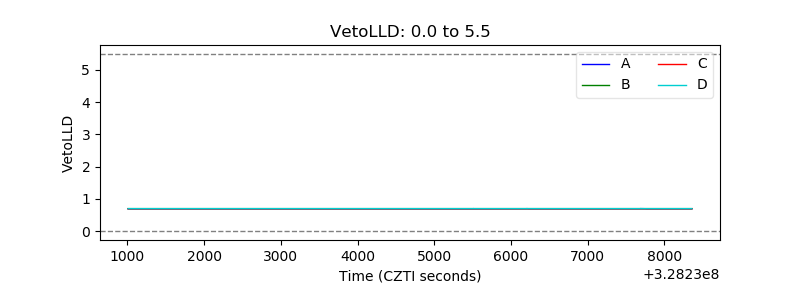 |
| Alpha Counter | 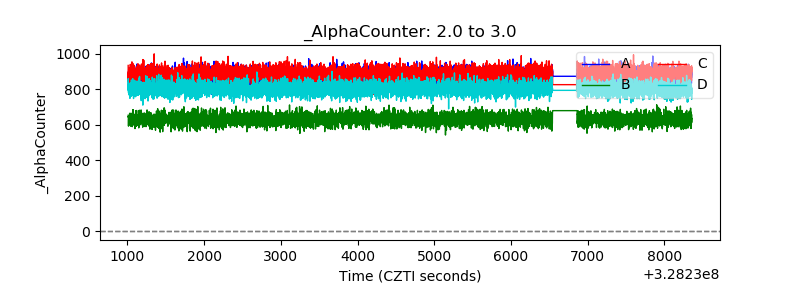 |
| _CPM_Rate | 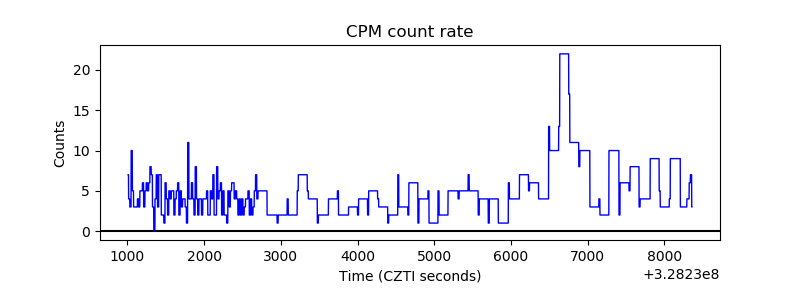 |
| CZT Counter | 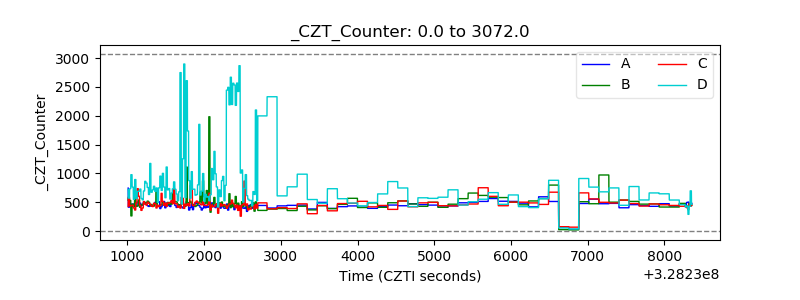 |
| +2.5 Volts monitor | 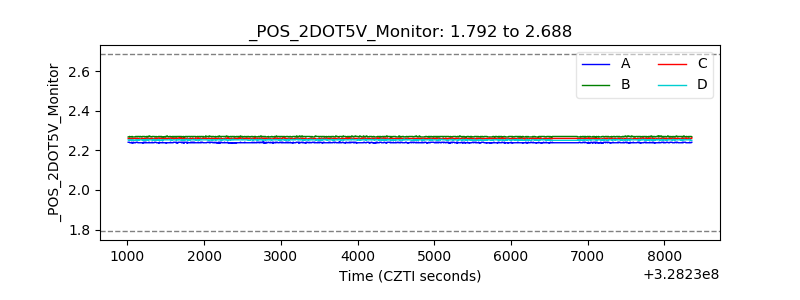 |
| +5 Volts monitor | 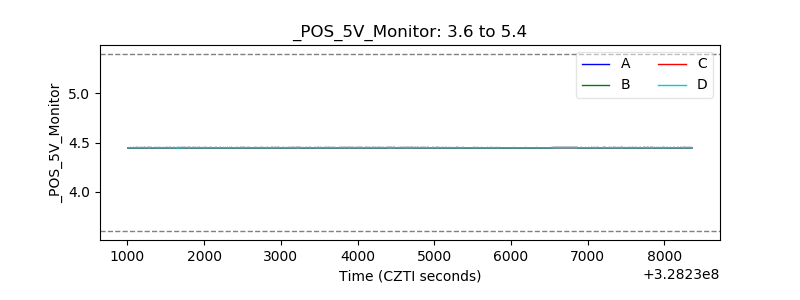 |
| _ROLL_ROT | 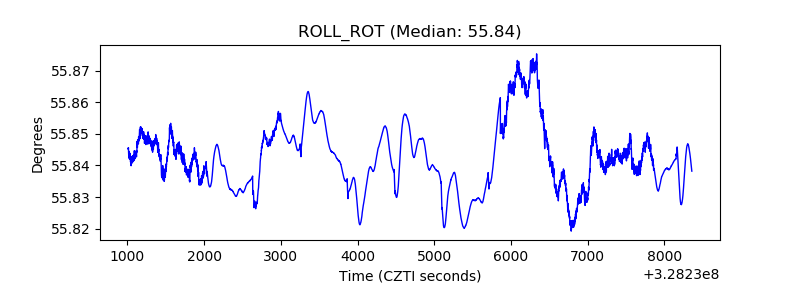 |
| _Roll_DEC | 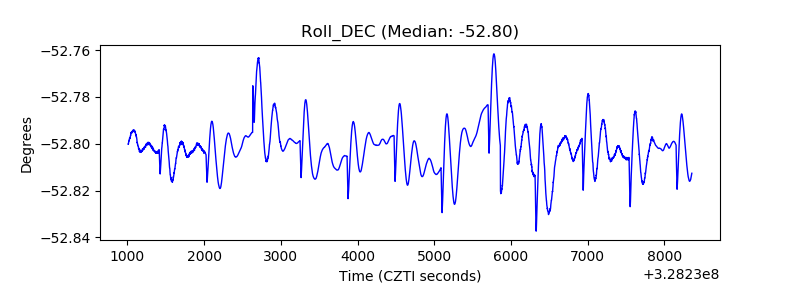 |
| _Roll_RA | 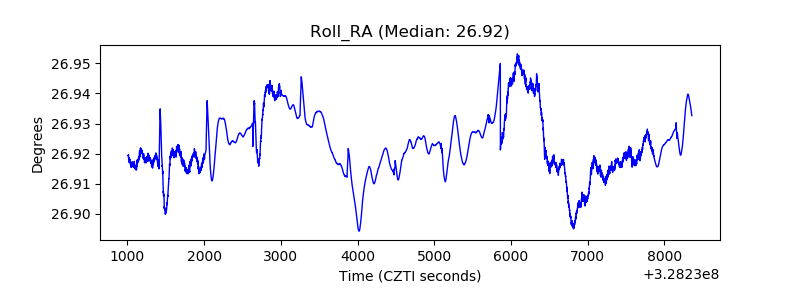 |
| Veto Counter | 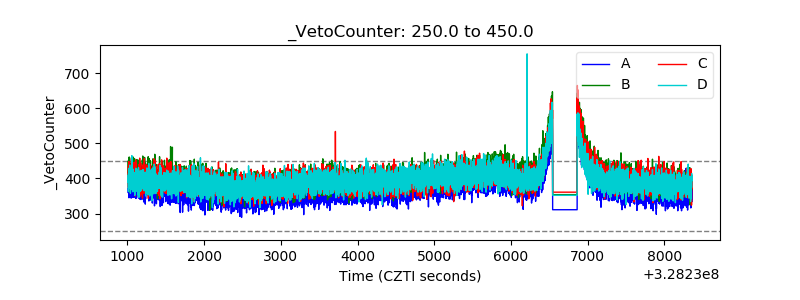 |