| Param | Original file | Final file |
|---|---|---|
| Filename | modeM0/AS1A07_027T01_9000003690_25206cztM0_level2.evt | modeM0/AS1A07_027T01_9000003690_25206cztM0_level2_quad_clean.evt |
| Size (bytes) | 308,845,440 | 71,271,360 |
| Size | 294.5 MB | 68.0 MB |
| Events in quadrant A | 2,001,637 | 472,633 |
| Events in quadrant B | 2,043,463 | 475,431 |
| Events in quadrant C | 2,099,444 | 456,563 |
| Events in quadrant D | 2,907,792 | 443,183 |
| Mode M9 | |||
|---|---|---|---|
| Quadrant | BADHDUFLAG | Total packets | Discarded packets |
| A | 0 | 3 | 0 |
| B | 0 | 3 | 0 |
| C | 0 | 3 | 0 |
| D | 0 | 3 | 0 |
| Mode M0 | |||
|---|---|---|---|
| Quadrant | BADHDUFLAG | Total packets | Discarded packets |
| A | 0 | 8967 | 0 |
| B | 0 | 9069 | 0 |
| C | 0 | 9114 | 0 |
| D | 0 | 11544 | 0 |
| Quadrant | Total seconds | Saturated seconds | Saturation percentage |
|---|---|---|---|
| A | 4404 | 25 | 0.567666% |
| B | 4405 | 53 | 1.203178% |
| C | 4405 | 74 | 1.679909% |
| D | 4405 | 122 | 2.769580% |
Noise dominated data is calculated using 1-second bins in cleaned event files. If a bin has >2000 counts, and if more than 50% of those come from <1% of pixels, then it is considered to be noise-dominated and hence unusable.
| Quadrant | # 1 sec bins | Bins with >0 counts | Bins with >2000 counts | High rate bins dominated by noise | Noise dominated (total time) | Noise dominated (detector-on time) | Marked lightcurve |
|---|---|---|---|---|---|---|---|
| A | 4724 | 4405 | 0 | 0 | 0.00% | 0.00% | 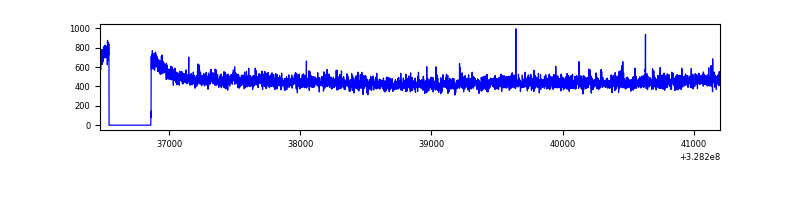 |
| B | 4725 | 4406 | 0 | 0 | 0.00% | 0.00% | 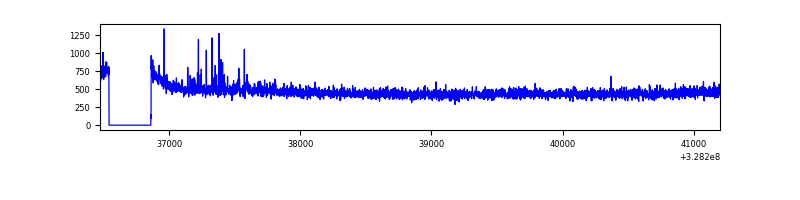 |
| C | 4725 | 4406 | 0 | 0 | 0.00% | 0.00% | 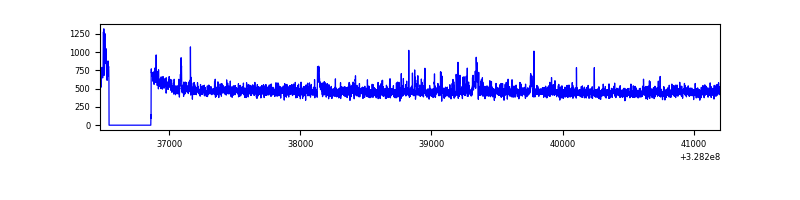 |
| D | 4725 | 4406 | 112 | 112 | 2.37% | 2.54% | 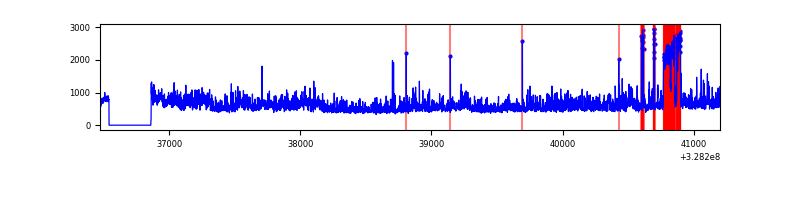 |
Top three noisy pixels from each quadrant. If the there are fewer than three noisy pixels in the level2.evt file, extra rows are filled as -1
| Pixel properties | Quadrant properties | ||||||
|---|---|---|---|---|---|---|---|
| Quadrant | DetID | PixID | Counts | Sigma | Mean | Median | Sigma |
| A | 13 | 254 | 6770 | 59.87 | 517 | 507 | 104.6 |
| A | 5 | 203 | 5113 | 44.03 | 517 | 507 | 104.6 |
| A | 3 | 137 | 4840 | 41.42 | 517 | 507 | 104.6 |
| B | 5 | 235 | 32604 | 322.93 | 512 | 497 | 99.4 |
| B | 12 | 111 | 12353 | 119.25 | 512 | 497 | 99.4 |
| B | 11 | 111 | 11090 | 106.54 | 512 | 497 | 99.4 |
| C | 14 | 238 | 80188 | 673.28 | 500 | 502 | 118.4 |
| C | 7 | 247 | 54681 | 457.77 | 500 | 502 | 118.4 |
| C | 3 | 233 | 11046 | 89.09 | 500 | 502 | 118.4 |
| D | 8 | 195 | 587507 | 4769.29 | 504 | 488 | 123.1 |
| D | 1 | 239 | 255696 | 2073.46 | 504 | 488 | 123.1 |
| D | 7 | 238 | 46918 | 377.23 | 504 | 488 | 123.1 |
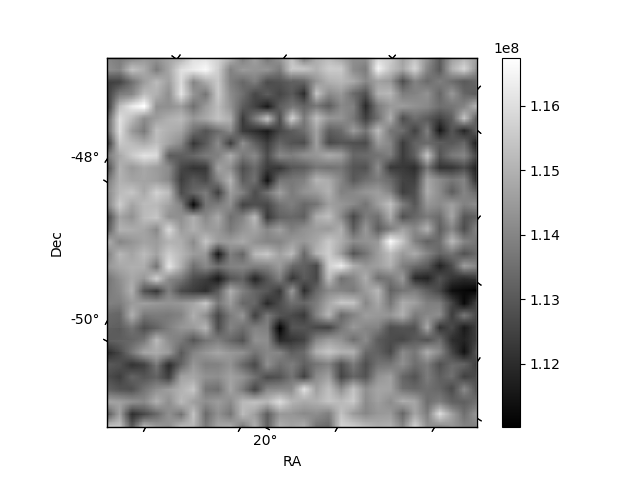
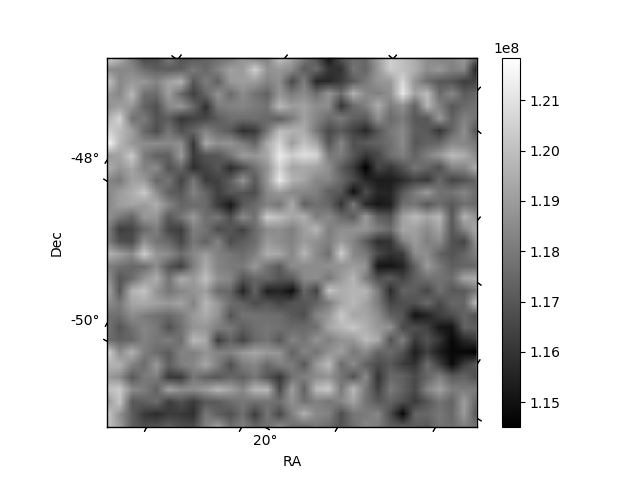
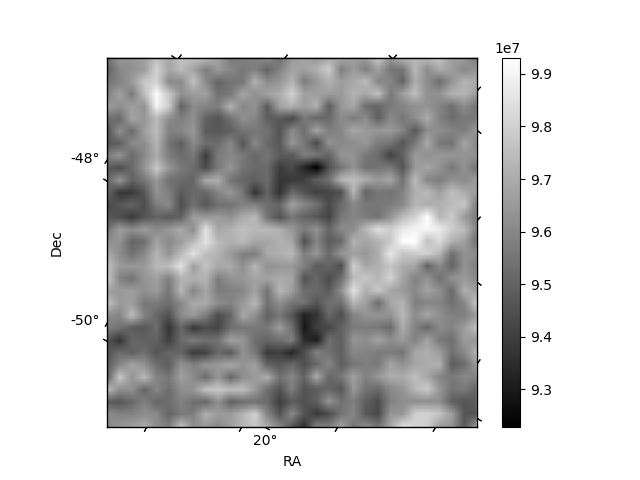
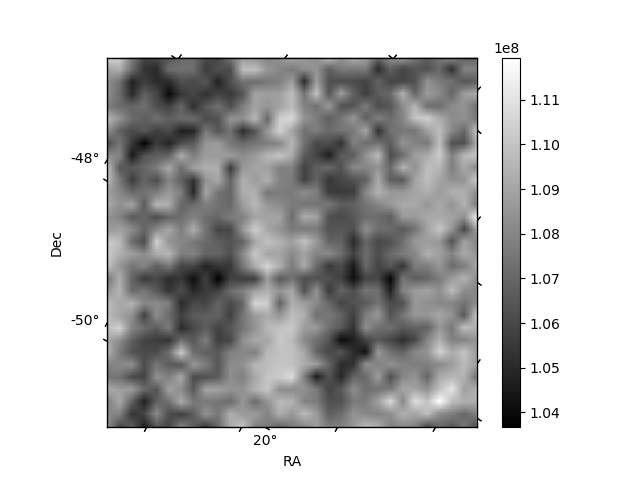
Histogram calculated using DETX and DETY for each event in the final _common_clean file
| Quadrant A | 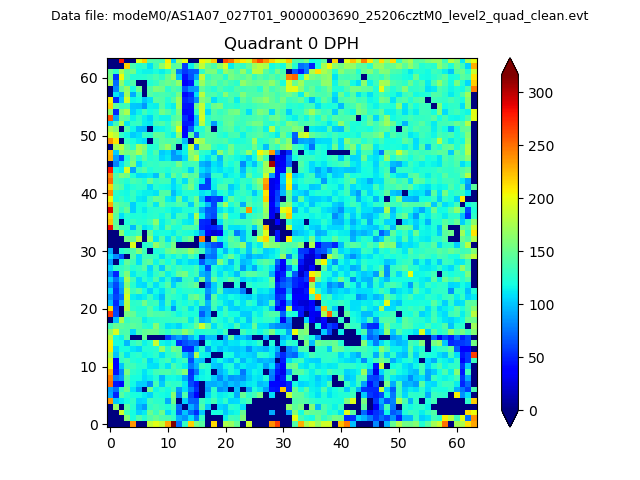 |
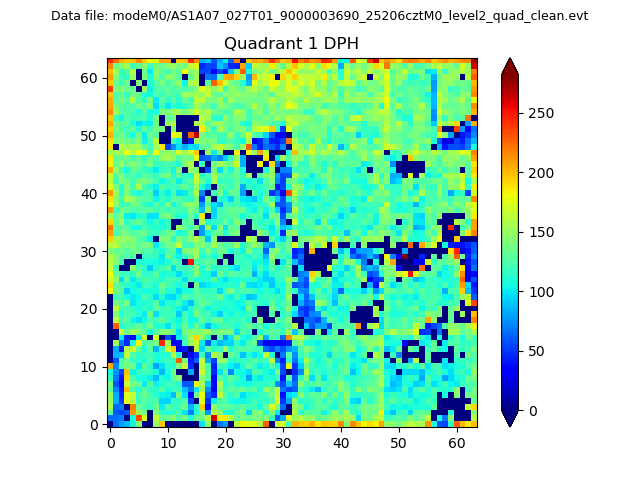 |
Quadrant B |
|---|---|---|---|
| Quadrant D | 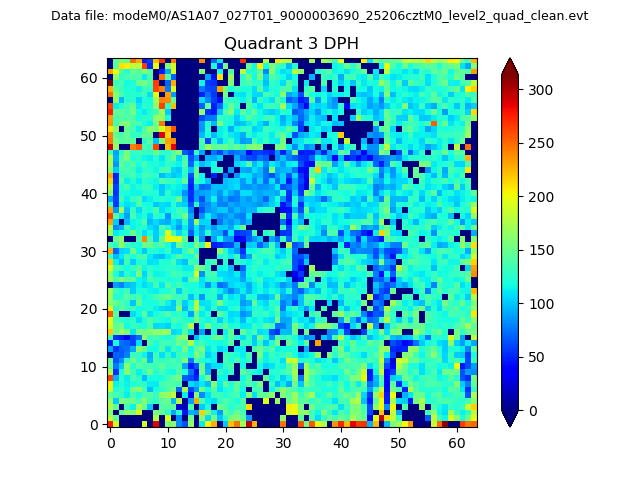 |
 |
Quadrant C |
| Plot type | Count rate plots | Images |
|---|---|---|
| Comparison with Poisson distribution Blue bars denote a histogram of data divided into 1 sec bins. Red curve is a Poisson curve with rate = median count rate of data. |
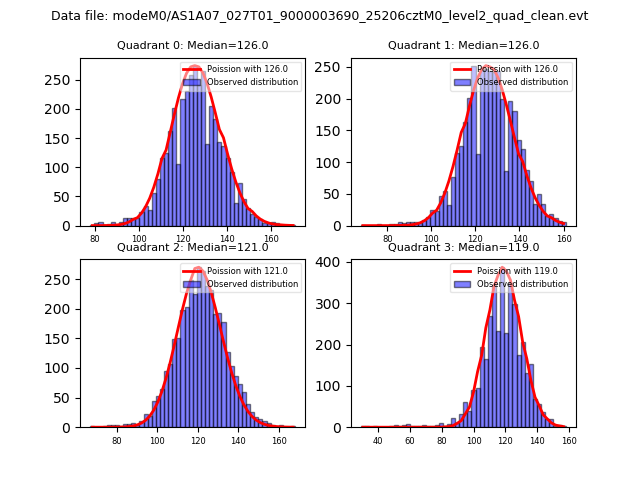 |
 |
| Quadrant-wise count rates Data is divided into 100 sec bins |
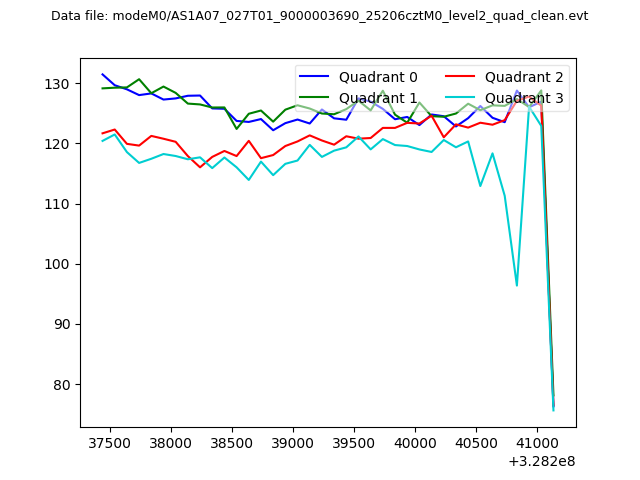 |
|
| Module-wise count rates for Quadrant A Data is divided into 100 sec bins |
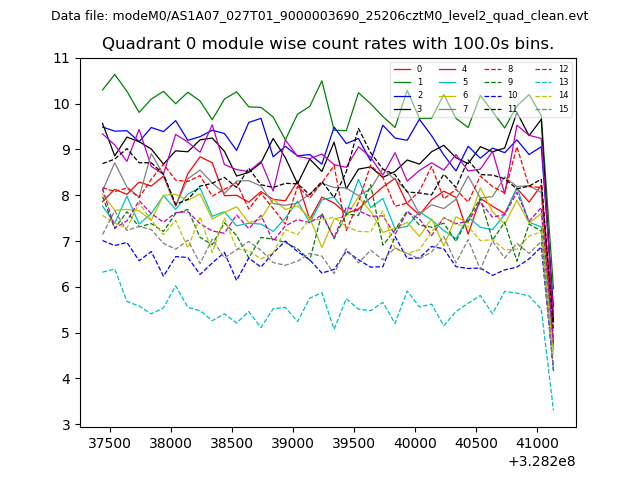 |
 |
| Module-wise count rates for Quadrant B Data is divided into 100 sec bins |
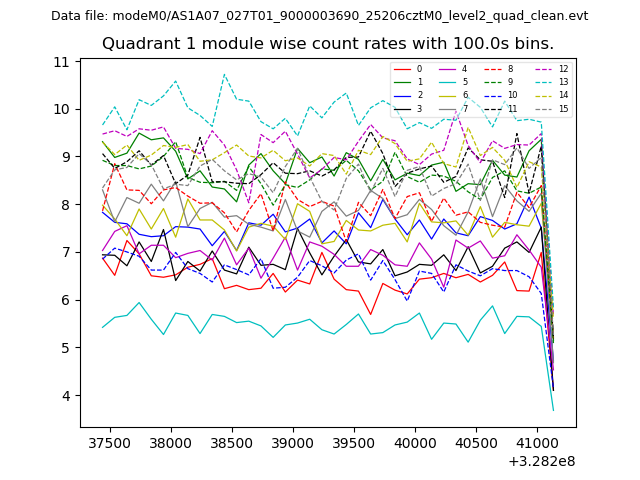 |
 |
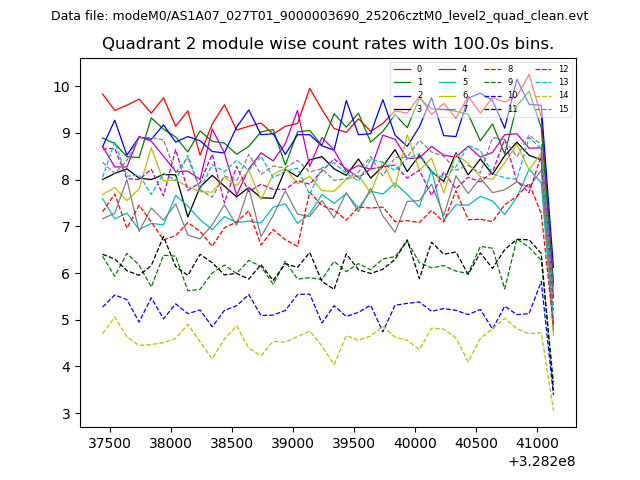
| Module-wise count rates for Quadrant C Data is divided into 100 sec bins |
 |
 |
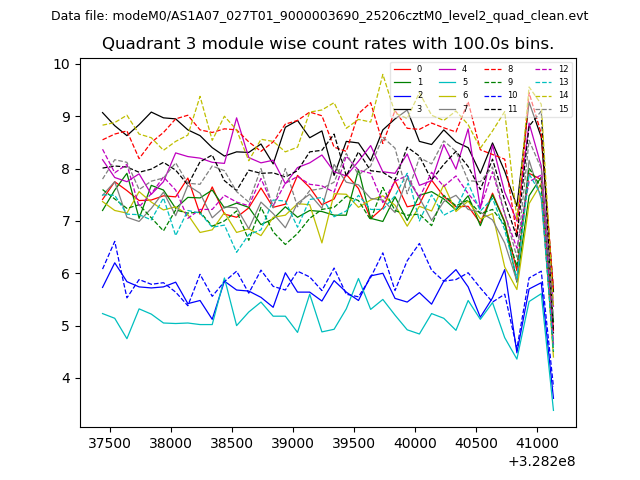
| Module-wise count rates for Quadrant D Data is divided into 100 sec bins |
 |
 |
| Parameter | Plot |
|---|---|
| CZT HV Monitor | 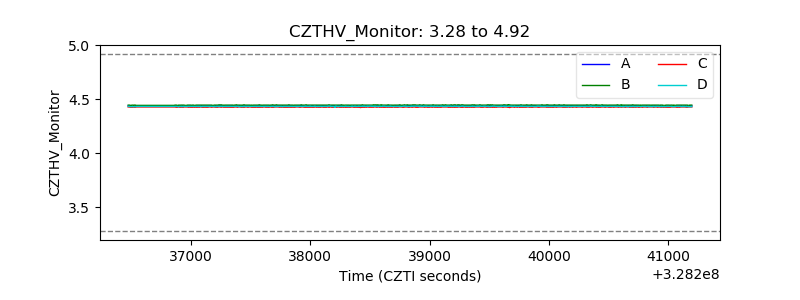 |
| D_VDD | 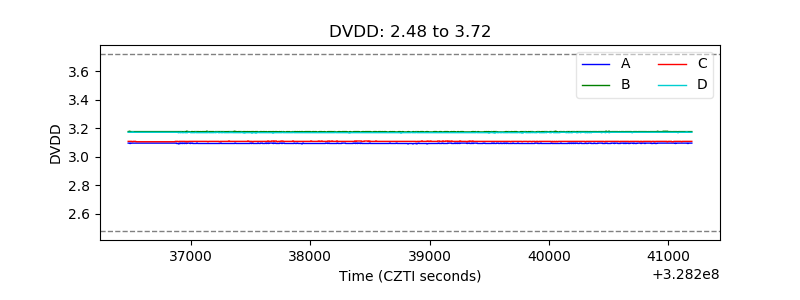 |
| Temperature 1 | 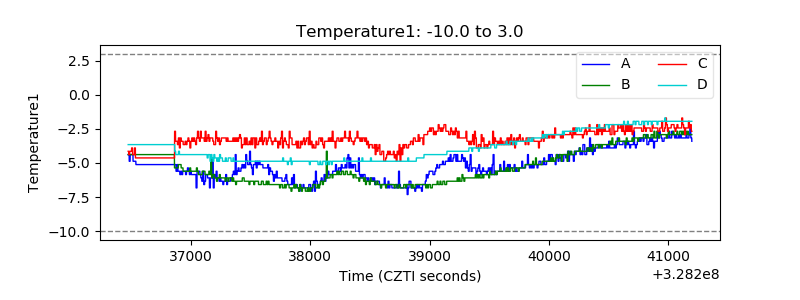 |
| Veto HV Monitor | 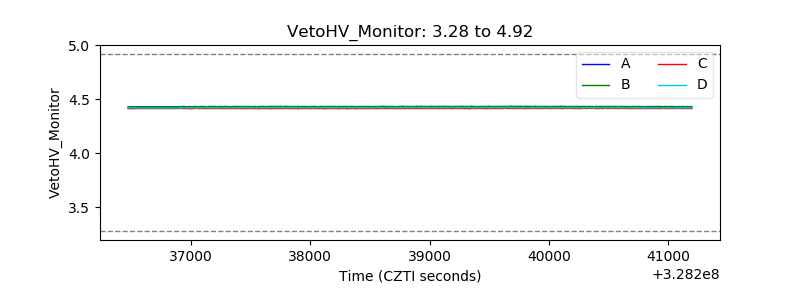 |
| Veto LLD | 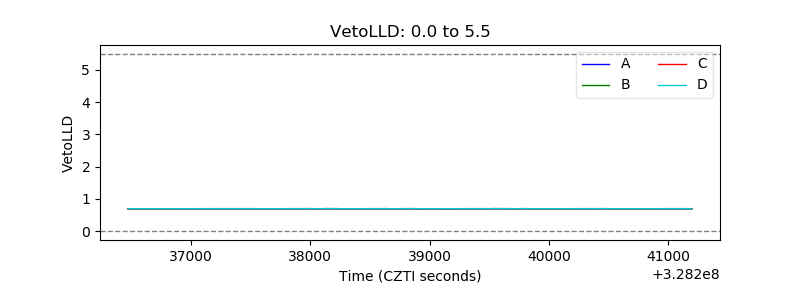 |
| Alpha Counter | 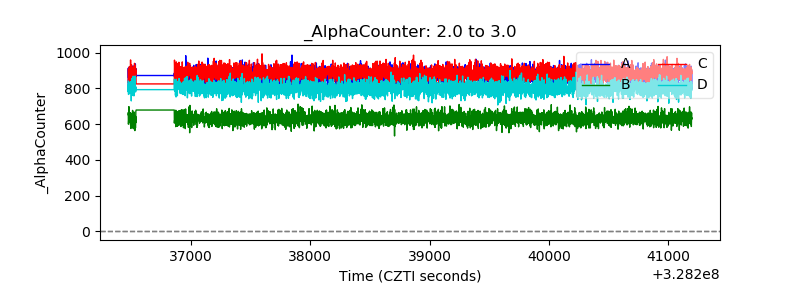 |
| _CPM_Rate | 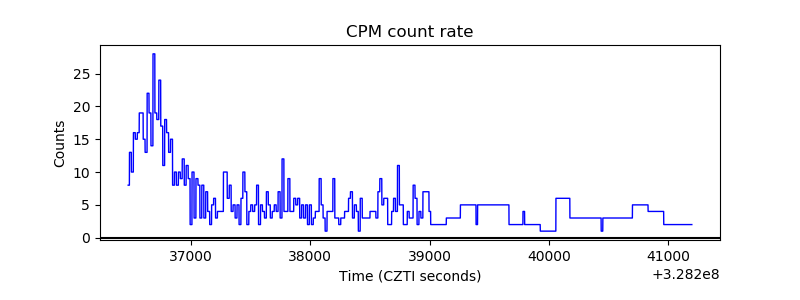 |
| CZT Counter |  |
| +2.5 Volts monitor |  |
| +5 Volts monitor |  |
| _ROLL_ROT | 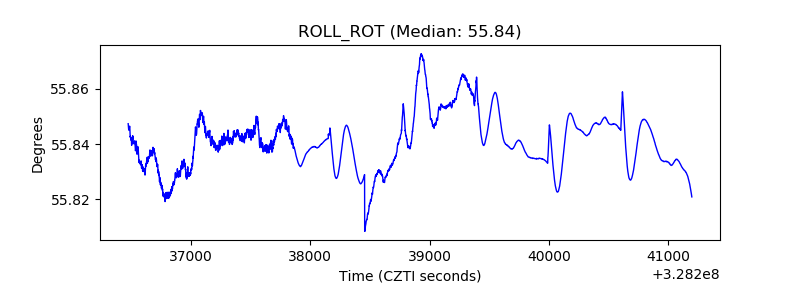 |
| _Roll_DEC | 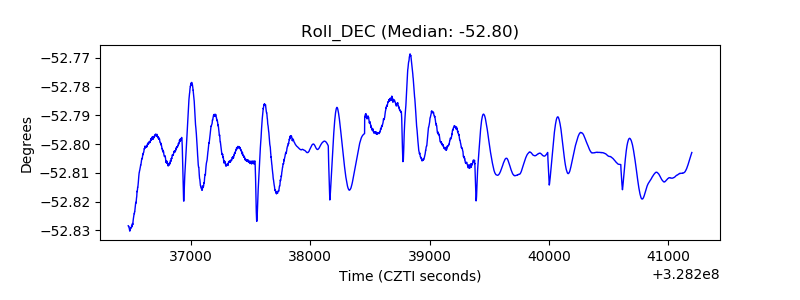 |
| _Roll_RA | 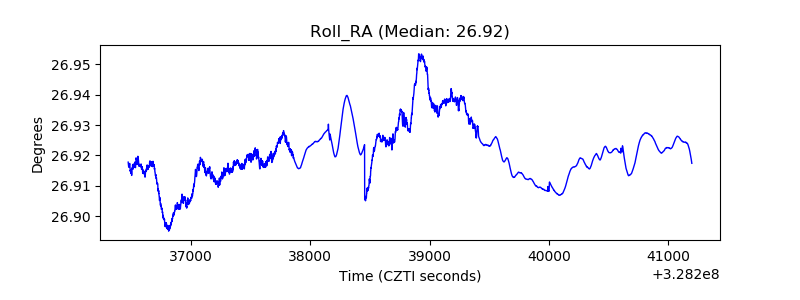 |
| Veto Counter | 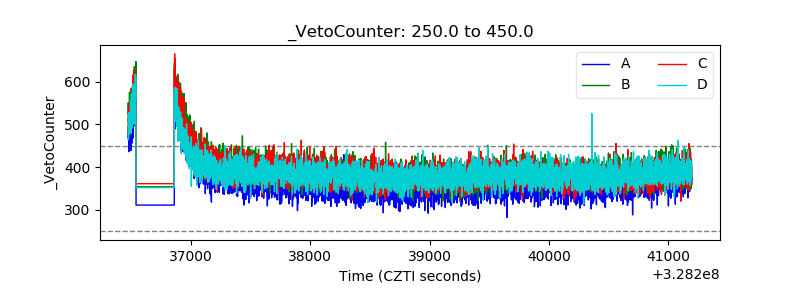 |