| Param | Original file | Final file |
|---|---|---|
| Filename | modeM0/AS1C05_002T10_9000003688cztM0_level2.fits | modeM0/AS1C05_002T10_9000003688cztM0_level2_quad_clean.evt |
| Size (bytes) | 52,934,400 | 35,651,520 |
| Size | 50.5 MB | 34.0 MB |
| Events in quadrant A | 330,924 | 188,074 |
| Events in quadrant B | 311,180 | 186,944 |
| Events in quadrant C | 316,790 | 177,143 |
| Events in quadrant D | 281,692 | 163,397 |
| Mode M9 | |||
|---|---|---|---|
| Quadrant | BADHDUFLAG | Total packets | Discarded packets |
| A | 0 | 14 | 0 |
| B | 0 | 15 | 0 |
| C | 0 | 15 | 0 |
| D | 0 | 15 | 0 |
| Mode M0 | |||
|---|---|---|---|
| Quadrant | BADHDUFLAG | Total packets | Discarded packets |
| A | 0 | 10883 | 0 |
| B | 0 | 11445 | 0 |
| C | 0 | 10813 | 0 |
| D | 0 | 12441 | 0 |
| Mode SS | |||
|---|---|---|---|
| Quadrant | BADHDUFLAG | Total packets | Discarded packets |
| A | 0 | 104 | 0 |
| B | 0 | 104 | 0 |
| C | 0 | 104 | 0 |
| D | 0 | 104 | 0 |
| Quadrant | Total seconds | Saturated seconds | Saturation percentage |
|---|---|---|---|
| A | 5185 | 65 | 1.253616% |
| B | 5185 | 120 | 2.314368% |
| C | 5185 | 93 | 1.793635% |
| D | 5185 | 57 | 1.099325% |
Noise dominated data is calculated using 1-second bins in cleaned event files. If a bin has >2000 counts, and if more than 50% of those come from <1% of pixels, then it is considered to be noise-dominated and hence unusable.
| Quadrant | # 1 sec bins | Bins with >0 counts | Bins with >2000 counts | High rate bins dominated by noise | Noise dominated (total time) | Noise dominated (detector-on time) | Marked lightcurve |
|---|---|---|---|---|---|---|---|
| A | 5183 | 5183 | 0 | 0 | 0.00% | 0.00% | 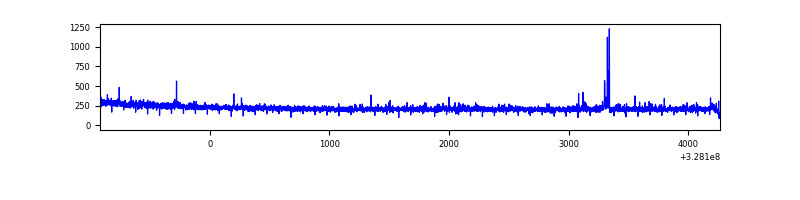 |
| B | 5184 | 5184 | 0 | 0 | 0.00% | 0.00% |  |
| C | 5184 | 5184 | 0 | 0 | 0.00% | 0.00% | 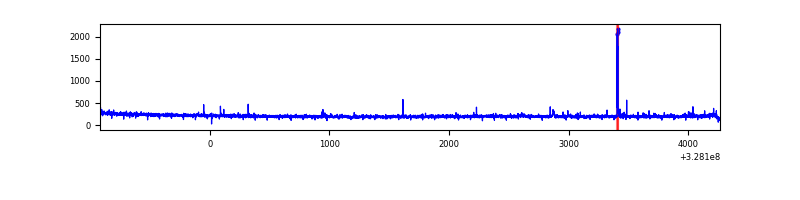 |
| D | 5184 | 5184 | 0 | 0 | 0.00% | 0.00% | 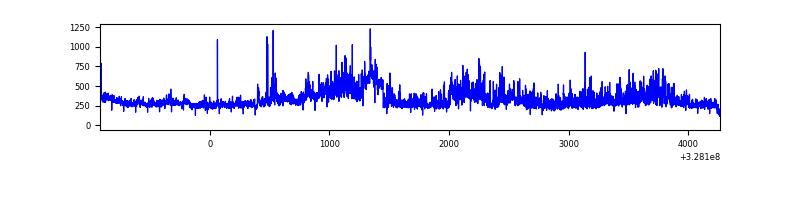 |
Top three noisy pixels from each quadrant. If the there are fewer than three noisy pixels in the level2.evt file, extra rows are filled as -1
| Pixel properties | Quadrant properties | ||||||
|---|---|---|---|---|---|---|---|
| Quadrant | DetID | PixID | Counts | Sigma | Mean | Median | Sigma |
| A | 0 | 29 | 340 | 11.5 | 86 | 81 | 22.5 |
| A | 9 | 19 | 265 | 8.17 | 86 | 81 | 22.5 |
| A | 0 | 30 | 263 | 8.08 | 86 | 81 | 22.5 |
| B | 2 | 9 | 232 | 8.13 | 82 | 79 | 18.8 |
| B | 5 | 232 | 221 | 7.55 | 82 | 79 | 18.8 |
| B | 5 | 128 | 216 | 7.28 | 82 | 79 | 18.8 |
| C | 12 | 241 | 239 | 6.95 | 83 | 79 | 23.0 |
| C | 3 | 126 | 225 | 6.34 | 83 | 79 | 23.0 |
| C | 9 | 209 | 224 | 6.29 | 83 | 79 | 23.0 |
| D | 10 | 189 | 214 | 6.26 | 80 | 73 | 22.5 |
| D | 3 | 14 | 202 | 5.73 | 80 | 73 | 22.5 |
| D | 6 | 232 | 194 | 5.37 | 80 | 73 | 22.5 |
Histogram calculated using DETX and DETY for each event in the final _common_clean file
| Quadrant A |  |
 |
Quadrant B |
|---|---|---|---|
| Quadrant D |  |
 |
Quadrant C |
| Plot type | Count rate plots | Images |
|---|---|---|
| Comparison with Poisson distribution Blue bars denote a histogram of data divided into 1 sec bins. Red curve is a Poisson curve with rate = median count rate of data. |
 |
 |
| Quadrant-wise count rates Data is divided into 100 sec bins |
 |
|
| Module-wise count rates for Quadrant A Data is divided into 100 sec bins |
 |
 |
| Module-wise count rates for Quadrant B Data is divided into 100 sec bins |
 |
 |
| Module-wise count rates for Quadrant C Data is divided into 100 sec bins |
 |
 |
| Module-wise count rates for Quadrant D Data is divided into 100 sec bins |
 |
 |
| Parameter | Plot |
|---|---|
| CZT HV Monitor |  |
| D_VDD |  |
| Temperature 1 |  |
| Veto HV Monitor |  |
| Veto LLD |  |
| Alpha Counter |  |
| _CPM_Rate | 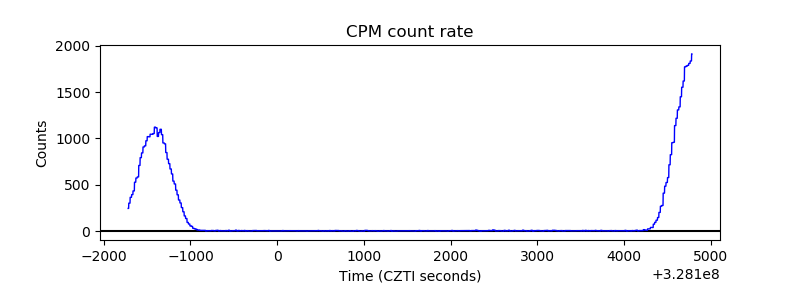 |
| CZT Counter |  |
| +2.5 Volts monitor |  |
| +5 Volts monitor |  |
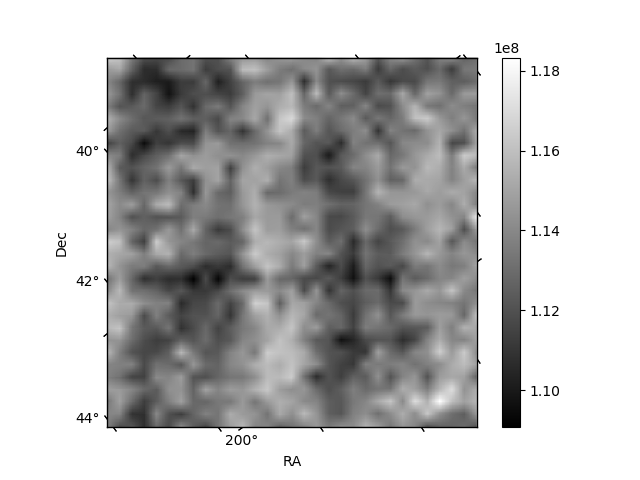
| _ROLL_ROT | 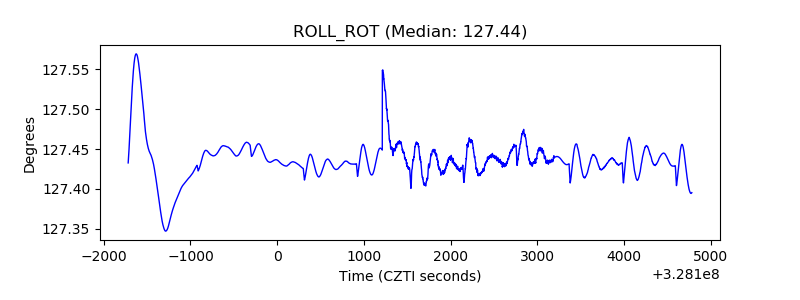 |
| _Roll_DEC |  |
| _Roll_RA |  |
| Veto Counter |  |