| Param | Original file | Final file |
|---|---|---|
| Filename | modeM0/AS1C05_002T10_9000003688_25183cztM0_level2.evt | modeM0/AS1C05_002T10_9000003688_25183cztM0_level2_quad_clean.evt |
| Size (bytes) | 372,263,040 | 75,720,960 |
| Size | 355.0 MB | 72.2 MB |
| Events in quadrant A | 2,542,037 | 493,778 |
| Events in quadrant B | 2,735,196 | 495,903 |
| Events in quadrant C | 2,568,344 | 472,218 |
| Events in quadrant D | 3,075,934 | 468,204 |
| Mode M9 | |||
|---|---|---|---|
| Quadrant | BADHDUFLAG | Total packets | Discarded packets |
| A | 0 | 14 | 0 |
| B | 0 | 15 | 0 |
| C | 0 | 15 | 0 |
| D | 0 | 15 | 0 |
| Mode M0 | |||
|---|---|---|---|
| Quadrant | BADHDUFLAG | Total packets | Discarded packets |
| A | 0 | 10883 | 0 |
| B | 0 | 11445 | 0 |
| C | 0 | 10813 | 0 |
| D | 0 | 12441 | 0 |
| Quadrant | Total seconds | Saturated seconds | Saturation percentage |
|---|---|---|---|
| A | 5185 | 65 | 1.253616% |
| B | 5185 | 120 | 2.314368% |
| C | 5185 | 93 | 1.793635% |
| D | 5185 | 57 | 1.099325% |
Noise dominated data is calculated using 1-second bins in cleaned event files. If a bin has >2000 counts, and if more than 50% of those come from <1% of pixels, then it is considered to be noise-dominated and hence unusable.
| Quadrant | # 1 sec bins | Bins with >0 counts | Bins with >2000 counts | High rate bins dominated by noise | Noise dominated (total time) | Noise dominated (detector-on time) | Marked lightcurve |
|---|---|---|---|---|---|---|---|
| A | 5184 | 5184 | 0 | 0 | 0.00% | 0.00% | 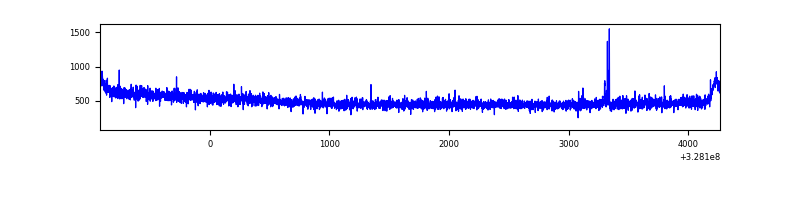 |
| B | 5185 | 5185 | 20 | 20 | 0.39% | 0.39% | 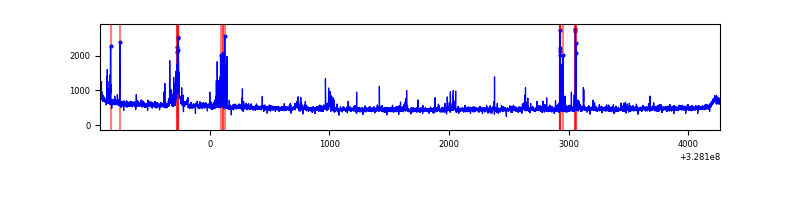 |
| C | 5184 | 5184 | 6 | 6 | 0.12% | 0.12% | 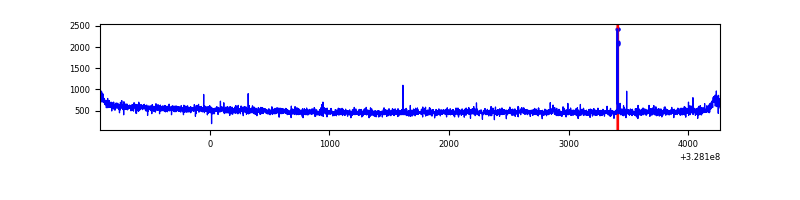 |
| D | 5184 | 5184 | 0 | 0 | 0.00% | 0.00% | 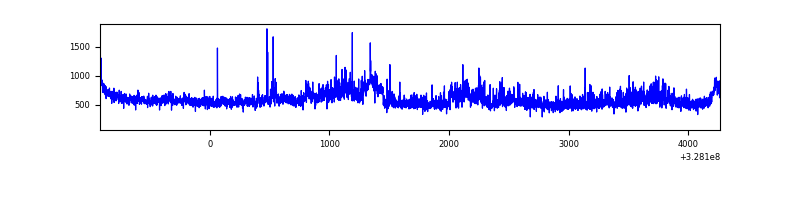 |
Top three noisy pixels from each quadrant. If the there are fewer than three noisy pixels in the level2.evt file, extra rows are filled as -1
| Pixel properties | Quadrant properties | ||||||
|---|---|---|---|---|---|---|---|
| Quadrant | DetID | PixID | Counts | Sigma | Mean | Median | Sigma |
| A | 15 | 174 | 13402 | 96.77 | 655 | 640 | 131.9 |
| A | 13 | 254 | 8208 | 57.39 | 655 | 640 | 131.9 |
| A | 3 | 137 | 5770 | 38.9 | 655 | 640 | 131.9 |
| B | 3 | 64 | 161789 | 1313.75 | 644 | 630 | 122.7 |
| B | 0 | 190 | 15680 | 122.69 | 644 | 630 | 122.7 |
| B | 12 | 111 | 14804 | 115.55 | 644 | 630 | 122.7 |
| C | 14 | 238 | 101714 | 689.89 | 624 | 627 | 146.5 |
| C | 14 | 225 | 17817 | 117.32 | 624 | 627 | 146.5 |
| C | 7 | 247 | 9110 | 57.89 | 624 | 627 | 146.5 |
| D | 8 | 195 | 461148 | 3001.96 | 636 | 616 | 153.4 |
| D | 1 | 255 | 75748 | 489.75 | 636 | 616 | 153.4 |
| D | 1 | 52 | 56157 | 362.04 | 636 | 616 | 153.4 |
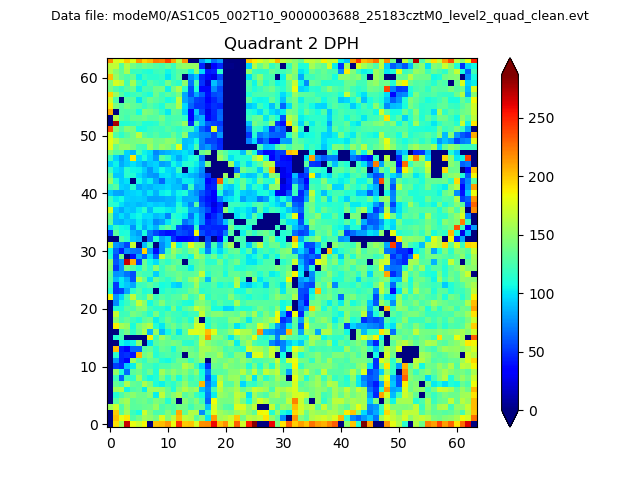
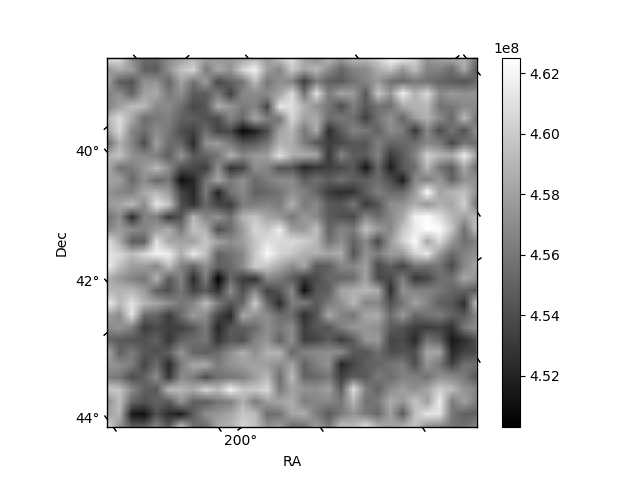
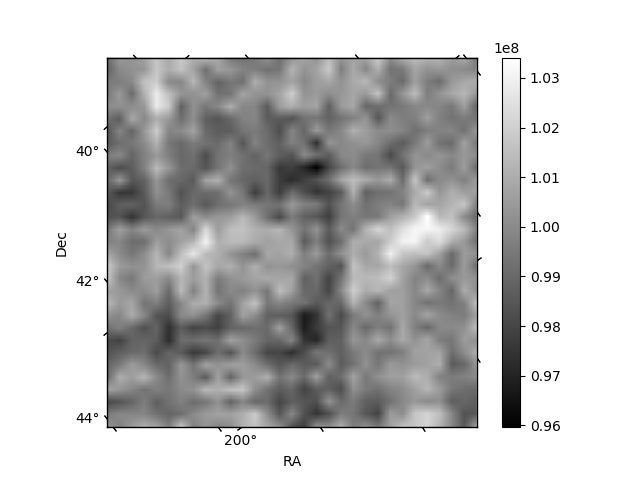
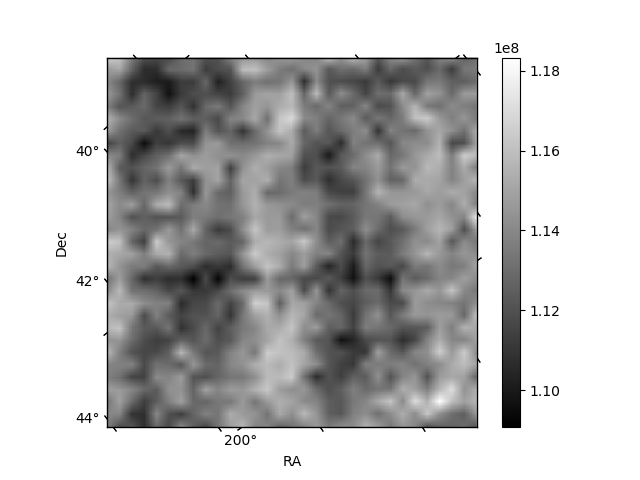
Histogram calculated using DETX and DETY for each event in the final _common_clean file
| Quadrant A | 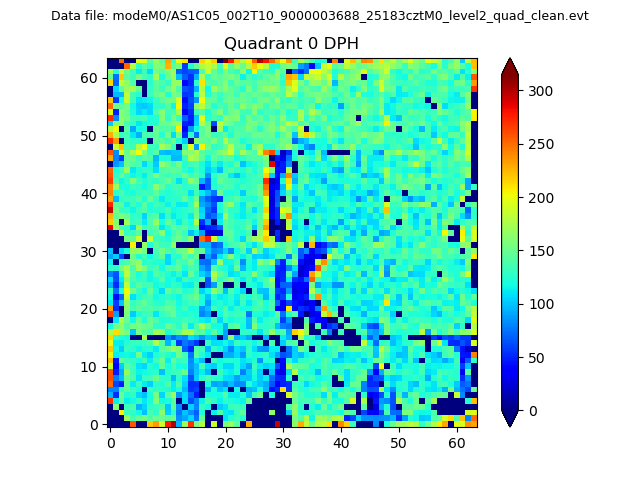 |
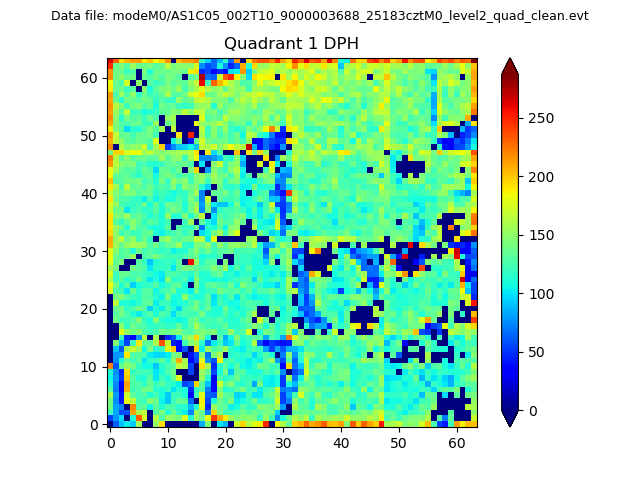 |
Quadrant B |
|---|---|---|---|
| Quadrant D | 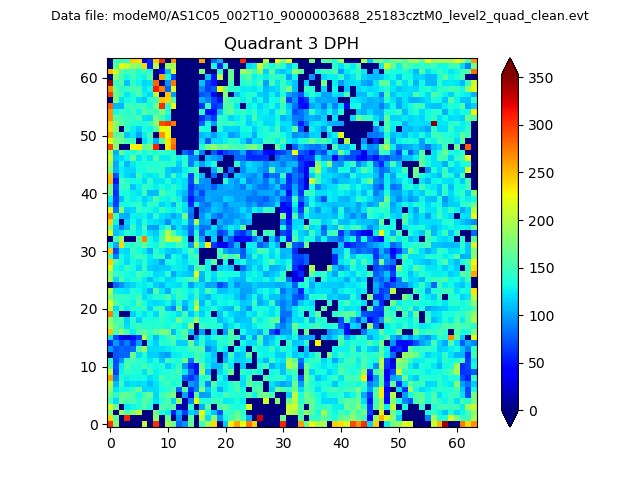 |
 |
Quadrant C |
| Plot type | Count rate plots | Images |
|---|---|---|
| Comparison with Poisson distribution Blue bars denote a histogram of data divided into 1 sec bins. Red curve is a Poisson curve with rate = median count rate of data. |
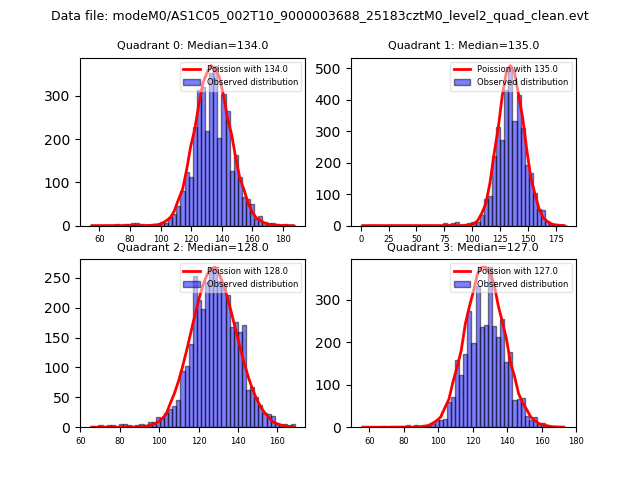 |
 |
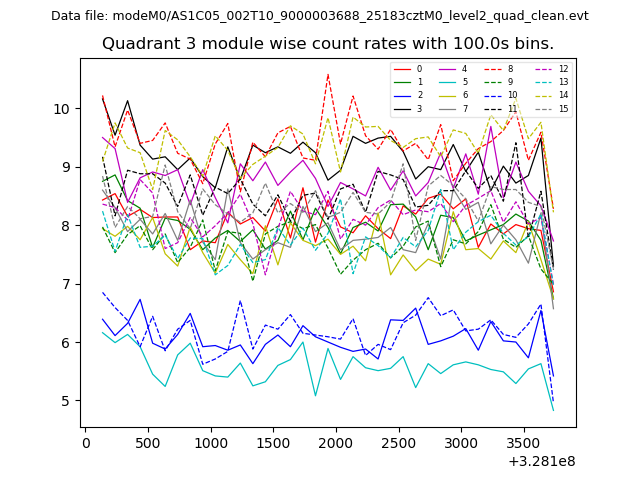
| Quadrant-wise count rates Data is divided into 100 sec bins |
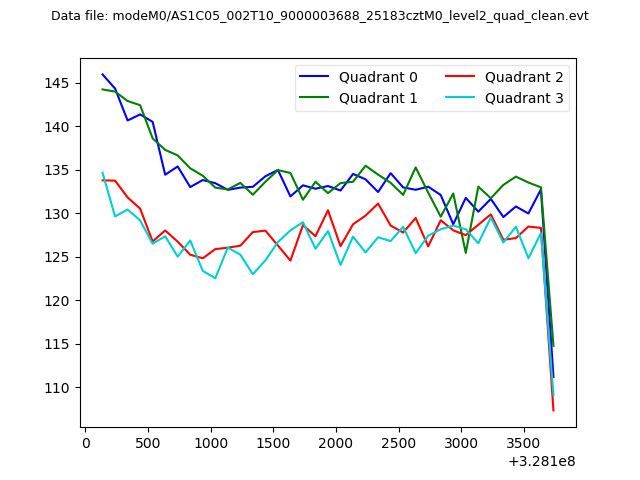 |
|
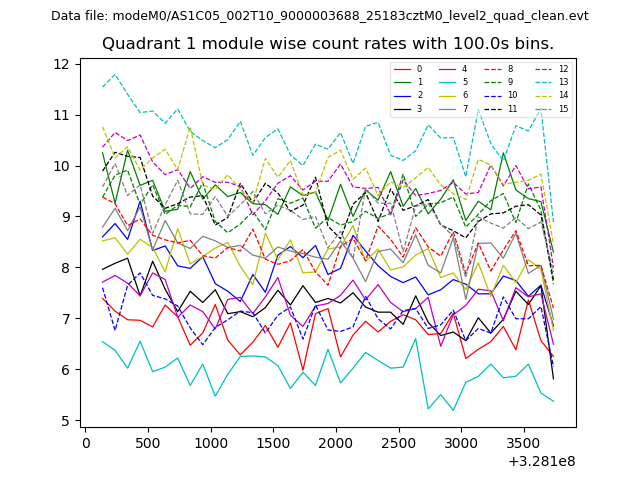
| Module-wise count rates for Quadrant A Data is divided into 100 sec bins |
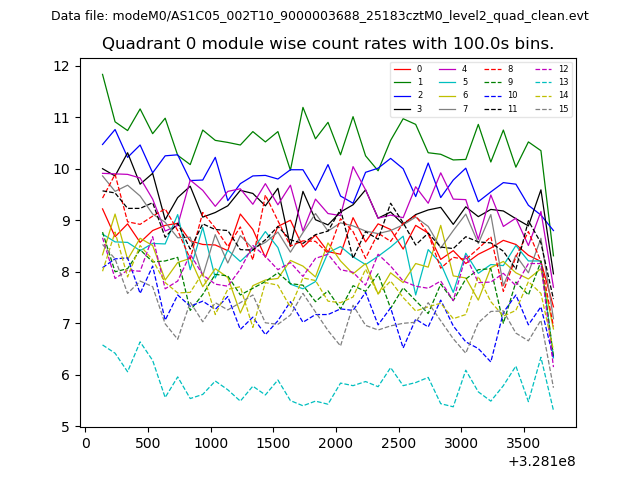 |
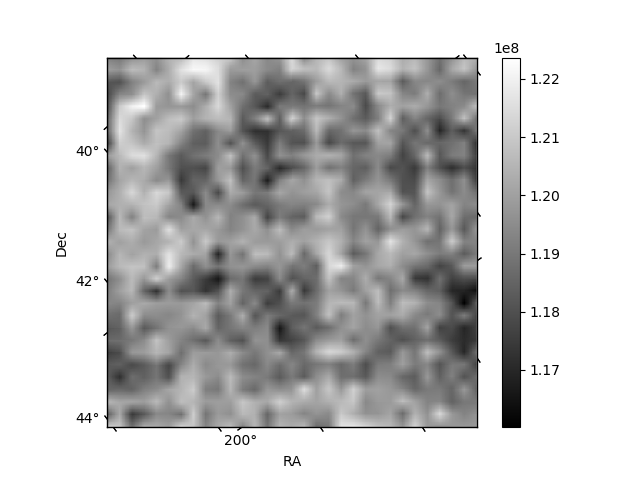 |
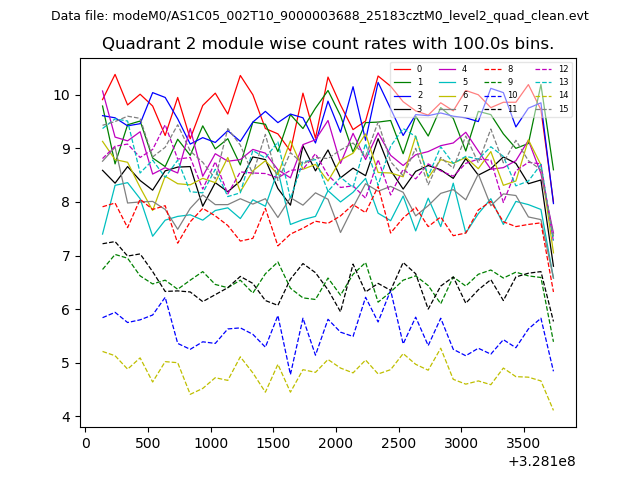
| Module-wise count rates for Quadrant B Data is divided into 100 sec bins |
 |
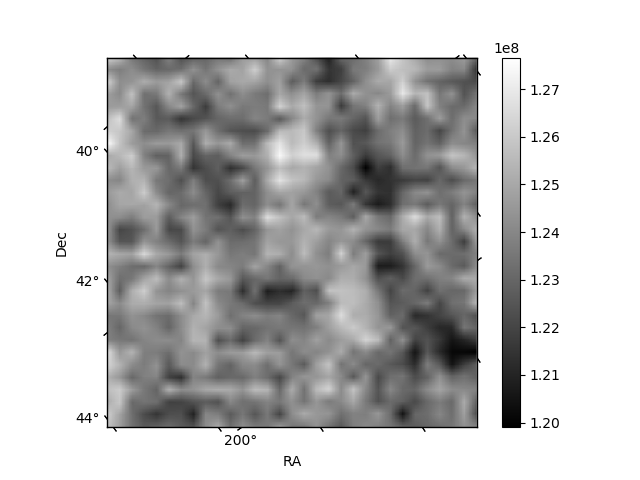 |
| Module-wise count rates for Quadrant C Data is divided into 100 sec bins |
 |
 |
| Module-wise count rates for Quadrant D Data is divided into 100 sec bins |
 |
 |
| Parameter | Plot |
|---|---|
| CZT HV Monitor | 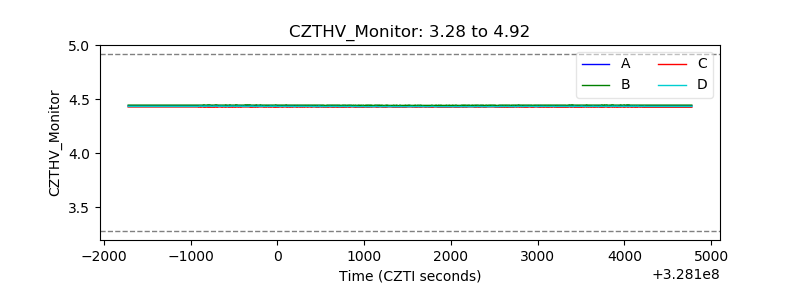 |
| D_VDD | 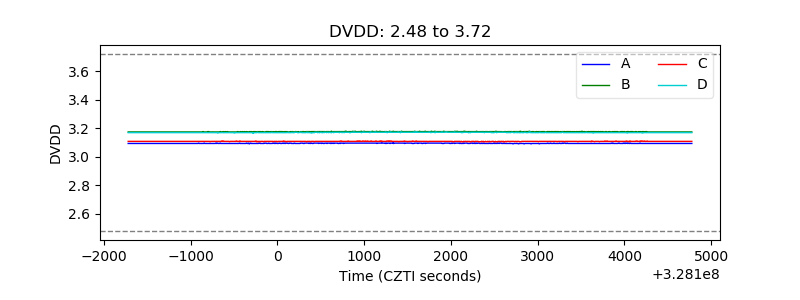 |
| Temperature 1 | 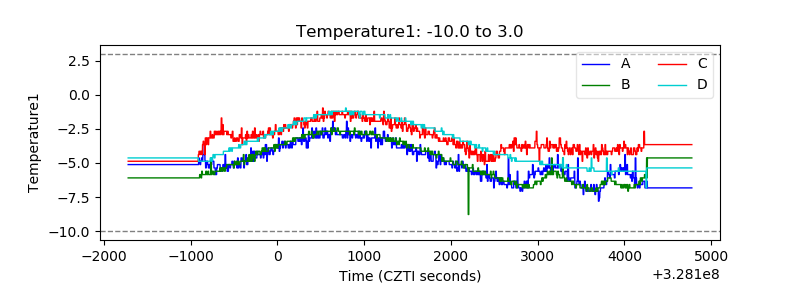 |
| Veto HV Monitor | 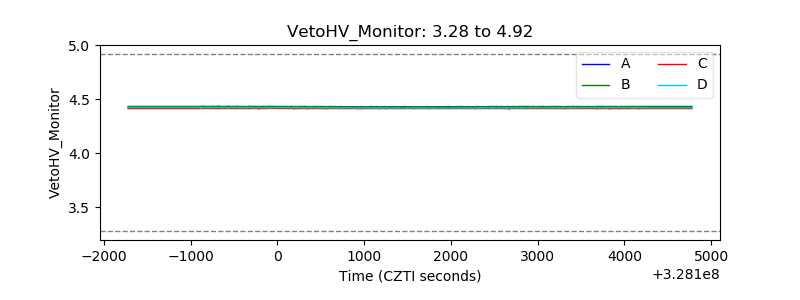 |
| Veto LLD | 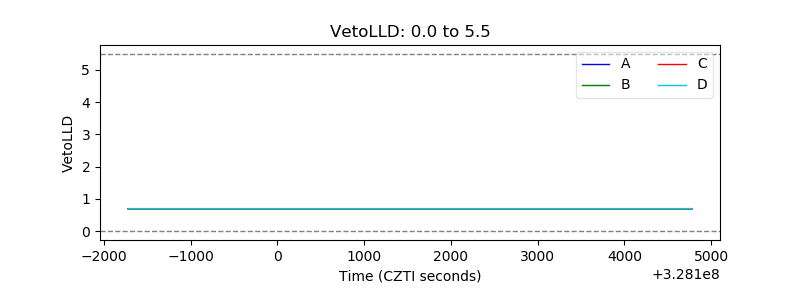 |
| Alpha Counter | 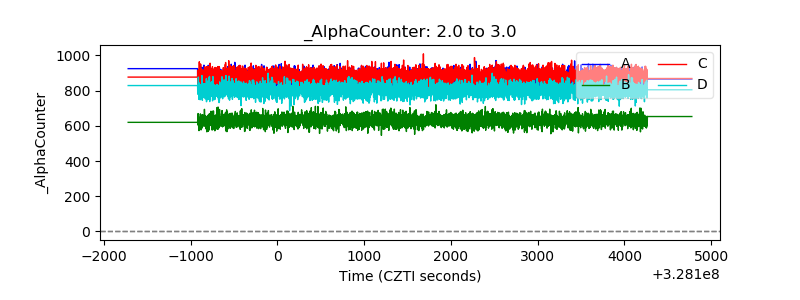 |
| _CPM_Rate |  |
| CZT Counter | 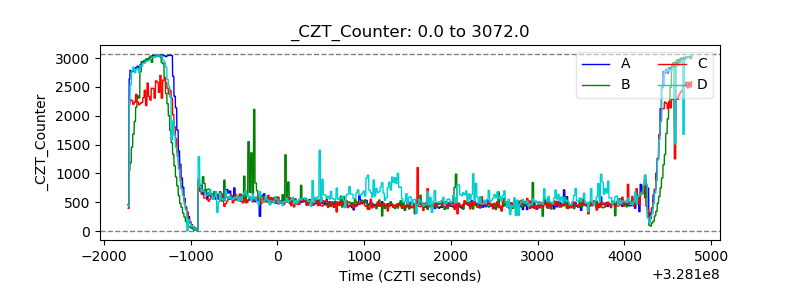 |
| +2.5 Volts monitor |  |
| +5 Volts monitor | 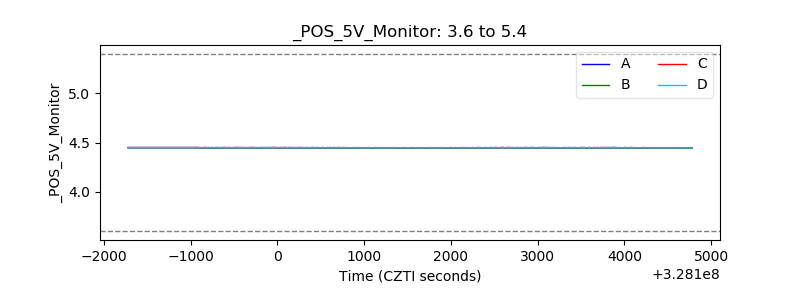 |
| _ROLL_ROT | 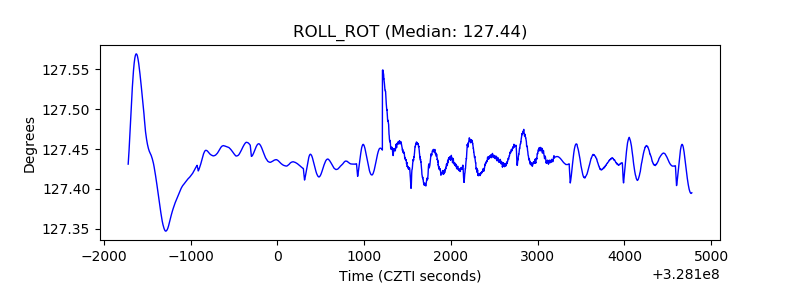 |
| _Roll_DEC | 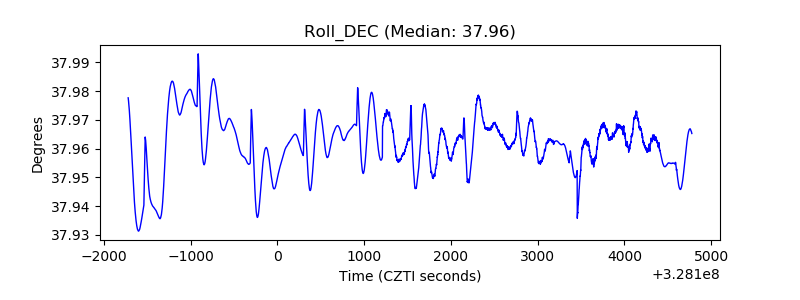 |
| _Roll_RA | 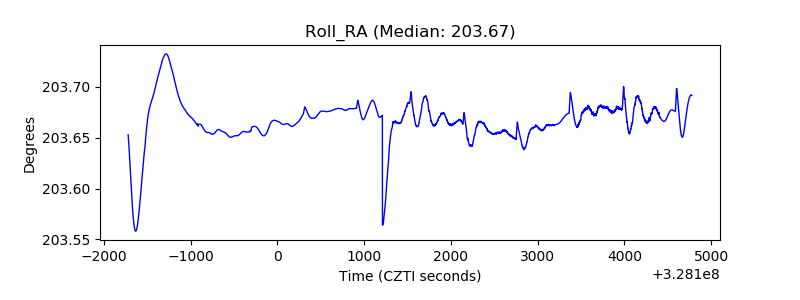 |
| Veto Counter | 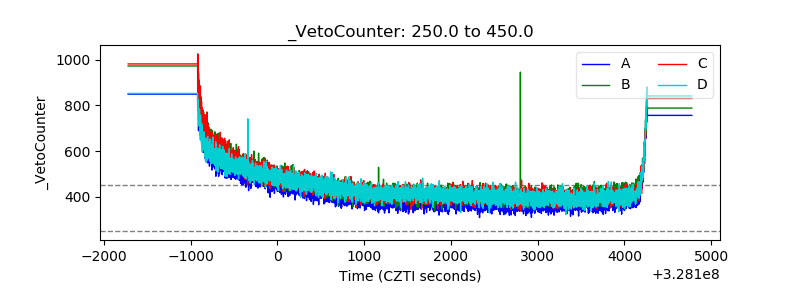 |