| Param | Original file | Final file |
|---|---|---|
| Filename | modeM0/AS1A07_097T01_9000003692_25206cztM0_level2.evt | modeM0/AS1A07_097T01_9000003692_25206cztM0_level2_quad_clean.evt |
| Size (bytes) | 177,621,120 | 33,431,040 |
| Size | 169.4 MB | 31.9 MB |
| Events in quadrant A | 1,173,970 | 215,770 |
| Events in quadrant B | 1,246,673 | 217,575 |
| Events in quadrant C | 1,204,185 | 207,569 |
| Events in quadrant D | 1,593,641 | 202,597 |
| Mode M0 | |||
|---|---|---|---|
| Quadrant | BADHDUFLAG | Total packets | Discarded packets |
| A | 0 | 4985 | 0 |
| B | 0 | 5193 | 0 |
| C | 0 | 5013 | 0 |
| D | 0 | 6389 | 0 |
| Mode M9 | |||
|---|---|---|---|
| Quadrant | BADHDUFLAG | Total packets | Discarded packets |
| A | 0 | 4 | 0 |
| B | 0 | 4 | 0 |
| C | 0 | 4 | 0 |
| D | 0 | 4 | 0 |
| Quadrant | Total seconds | Saturated seconds | Saturation percentage |
|---|---|---|---|
| A | 2337 | 37 | 1.583226% |
| B | 2337 | 78 | 3.337612% |
| C | 2337 | 83 | 3.551562% |
| D | 2337 | 47 | 2.011125% |
Noise dominated data is calculated using 1-second bins in cleaned event files. If a bin has >2000 counts, and if more than 50% of those come from <1% of pixels, then it is considered to be noise-dominated and hence unusable.
| Quadrant | # 1 sec bins | Bins with >0 counts | Bins with >2000 counts | High rate bins dominated by noise | Noise dominated (total time) | Noise dominated (detector-on time) | Marked lightcurve |
|---|---|---|---|---|---|---|---|
| A | 2722 | 2338 | 0 | 0 | 0.00% | 0.00% | 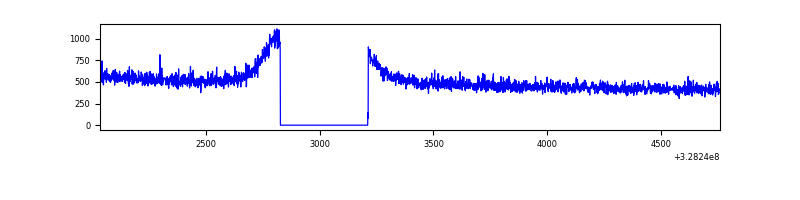 |
| B | 2722 | 2338 | 2 | 2 | 0.07% | 0.09% | 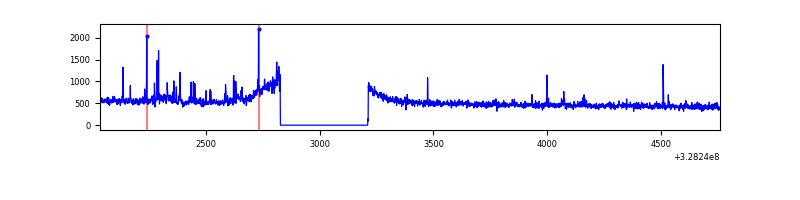 |
| C | 2722 | 2338 | 0 | 0 | 0.00% | 0.00% | 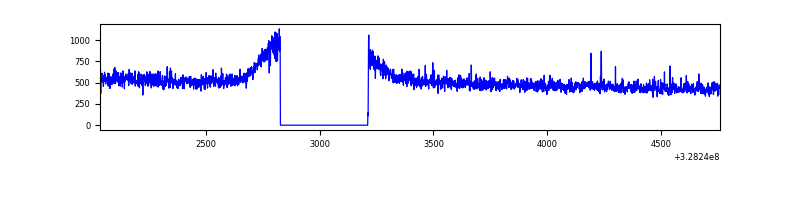 |
| D | 2722 | 2338 | 1 | 1 | 0.04% | 0.04% | 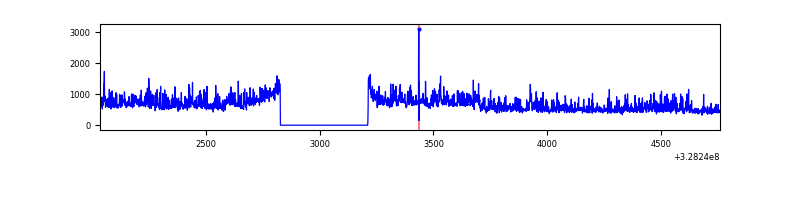 |
Top three noisy pixels from each quadrant. If the there are fewer than three noisy pixels in the level2.evt file, extra rows are filled as -1
| Pixel properties | Quadrant properties | ||||||
|---|---|---|---|---|---|---|---|
| Quadrant | DetID | PixID | Counts | Sigma | Mean | Median | Sigma |
| A | 5 | 203 | 4920 | 71.79 | 303 | 295 | 64.4 |
| A | 13 | 254 | 3727 | 53.27 | 303 | 295 | 64.4 |
| A | 3 | 137 | 2962 | 41.39 | 303 | 295 | 64.4 |
| B | 3 | 64 | 38584 | 621.46 | 303 | 296 | 61.6 |
| B | 10 | 251 | 12197 | 193.17 | 303 | 296 | 61.6 |
| B | 12 | 111 | 7762 | 121.18 | 303 | 296 | 61.6 |
| C | 14 | 238 | 46148 | 636.45 | 293 | 295 | 72.0 |
| C | 3 | 233 | 10893 | 147.1 | 293 | 295 | 72.0 |
| C | 7 | 247 | 2197 | 26.4 | 293 | 295 | 72.0 |
| D | 8 | 195 | 272139 | 3686.5 | 294 | 285 | 73.7 |
| D | 7 | 238 | 97009 | 1311.63 | 294 | 285 | 73.7 |
| D | 2 | 244 | 37226 | 500.94 | 294 | 285 | 73.7 |
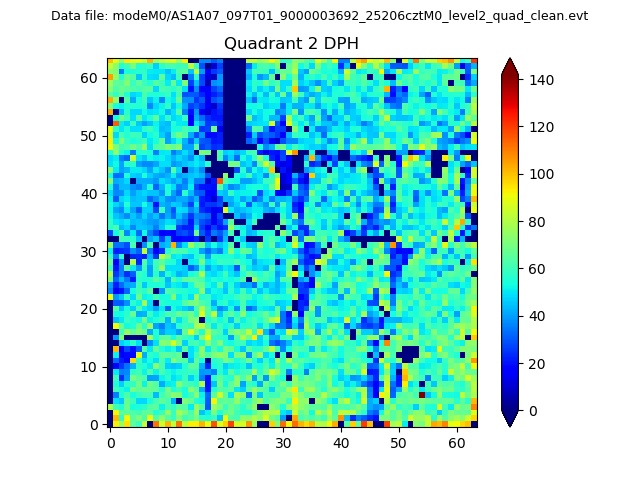
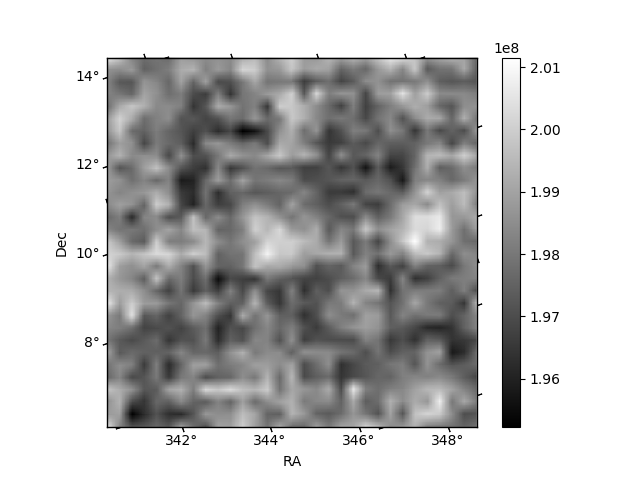
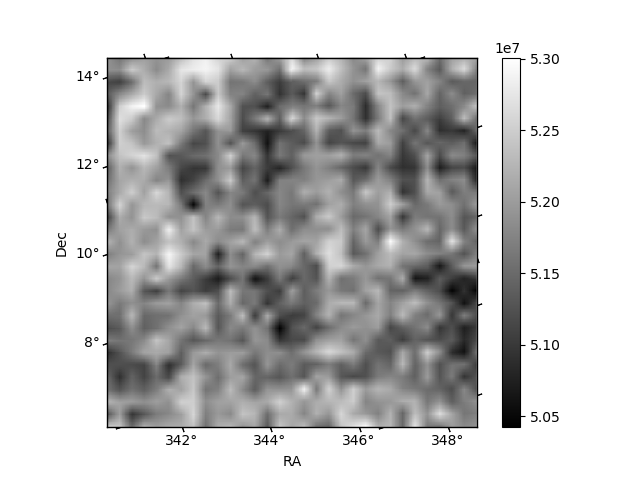
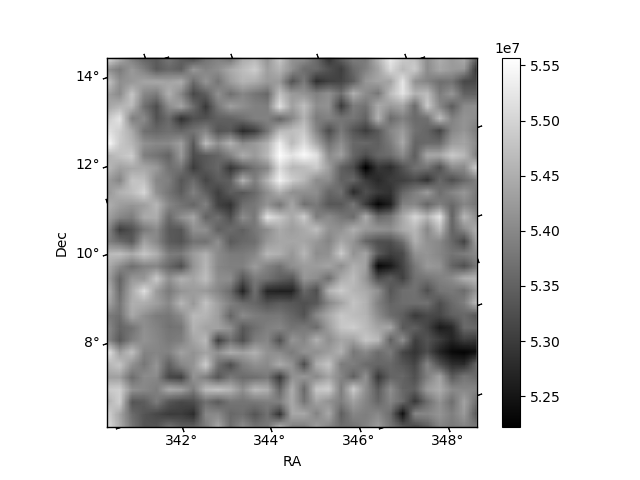
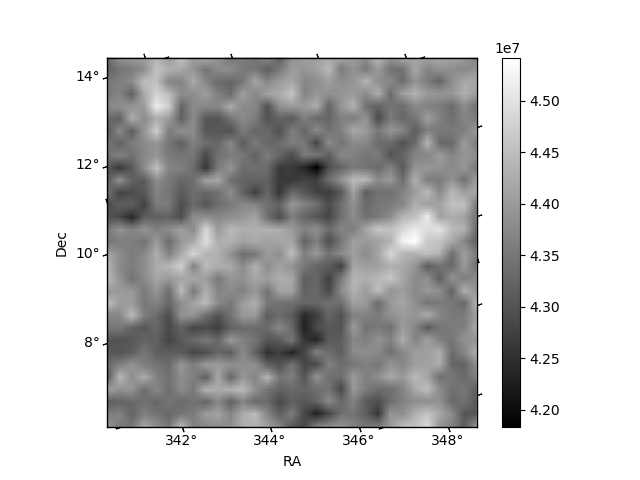
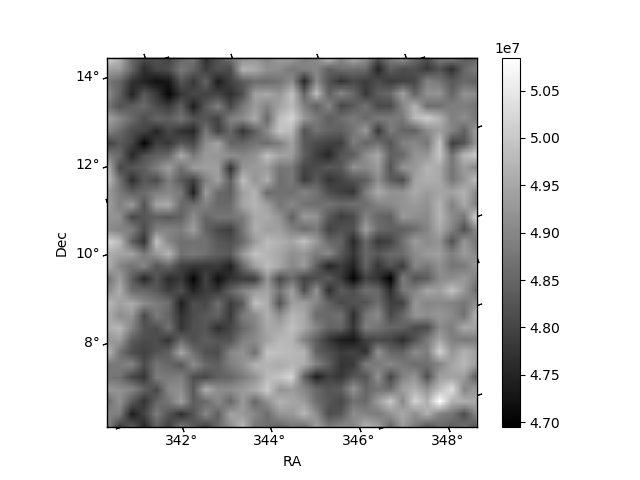
Histogram calculated using DETX and DETY for each event in the final _common_clean file
| Quadrant A | 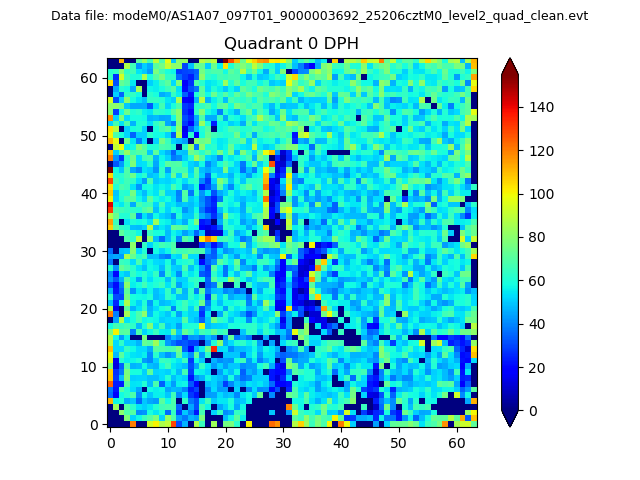 |
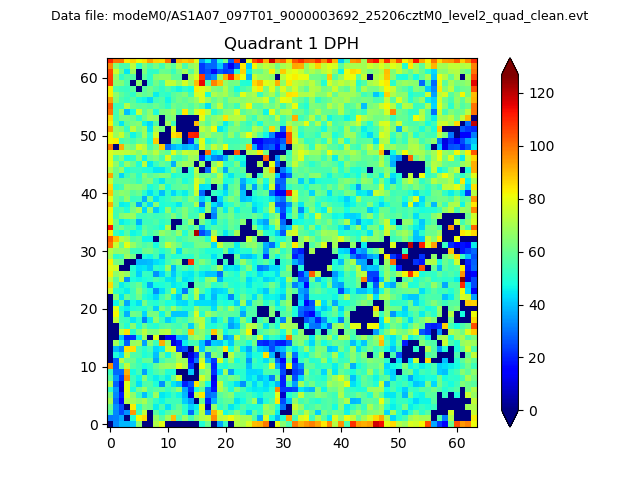 |
Quadrant B |
|---|---|---|---|
| Quadrant D | 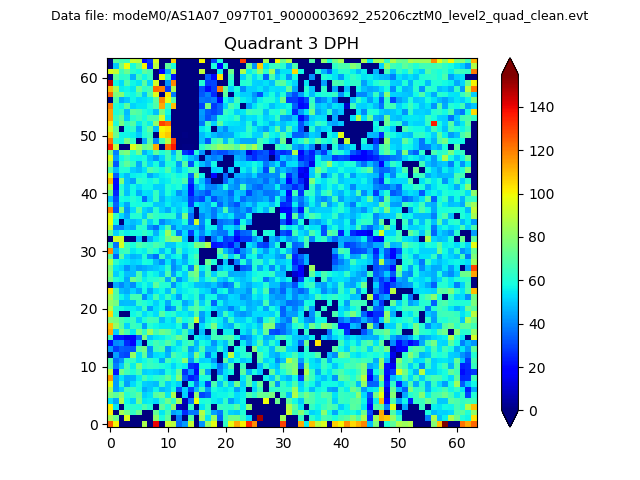 |
 |
Quadrant C |
| Plot type | Count rate plots | Images |
|---|---|---|
| Comparison with Poisson distribution Blue bars denote a histogram of data divided into 1 sec bins. Red curve is a Poisson curve with rate = median count rate of data. |
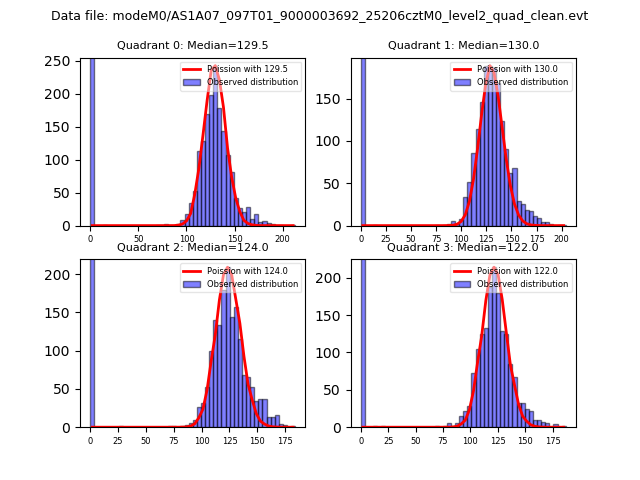 |
 |
| Quadrant-wise count rates Data is divided into 100 sec bins |
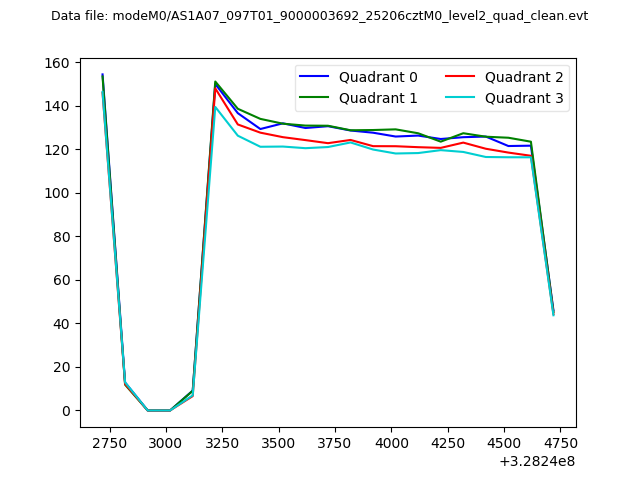 |
|
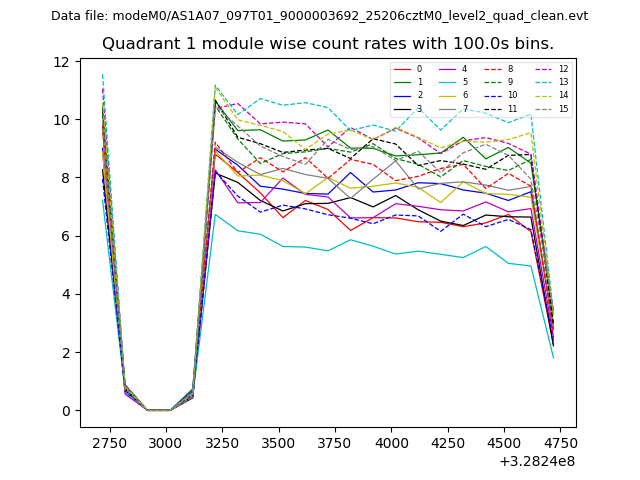
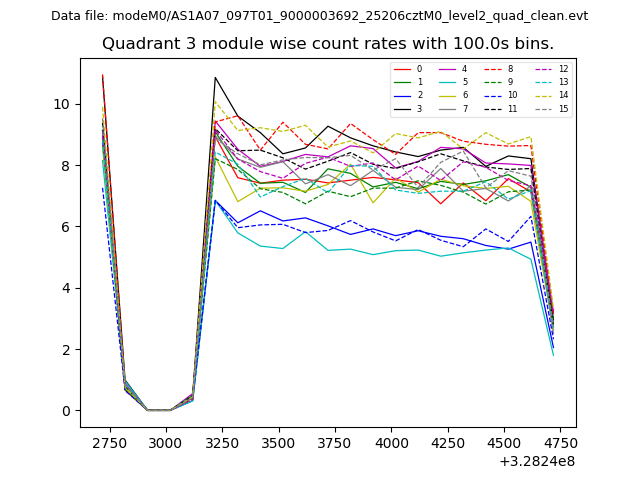
| Module-wise count rates for Quadrant A Data is divided into 100 sec bins |
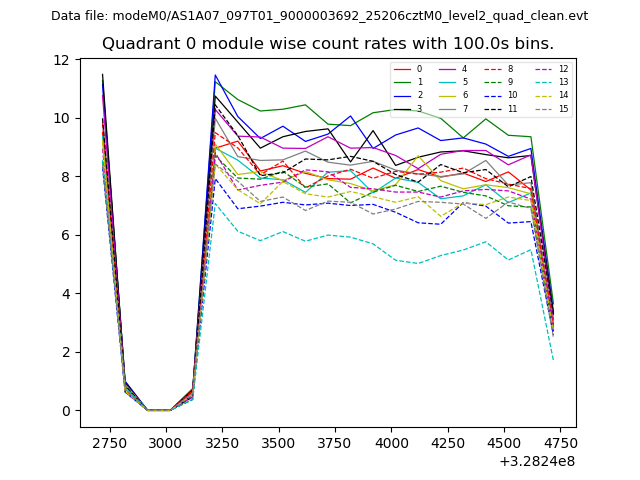 |
 |
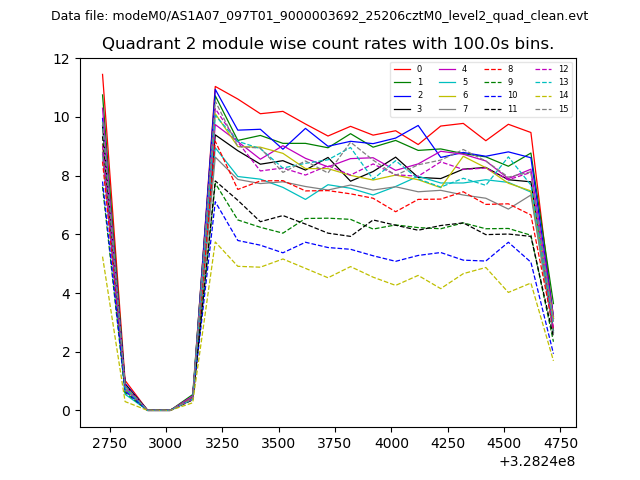
| Module-wise count rates for Quadrant B Data is divided into 100 sec bins |
 |
 |
| Module-wise count rates for Quadrant C Data is divided into 100 sec bins |
 |
 |
| Module-wise count rates for Quadrant D Data is divided into 100 sec bins |
 |
 |
| Parameter | Plot |
|---|---|
| CZT HV Monitor | 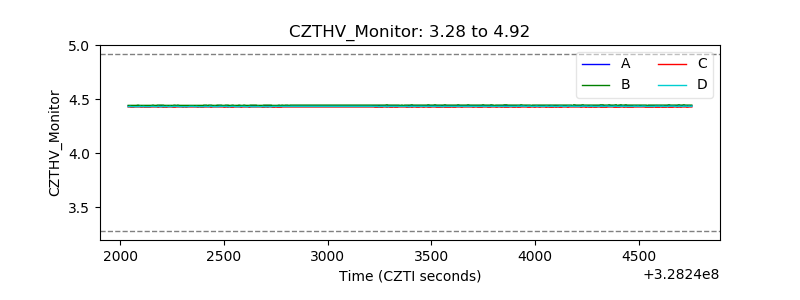 |
| D_VDD | 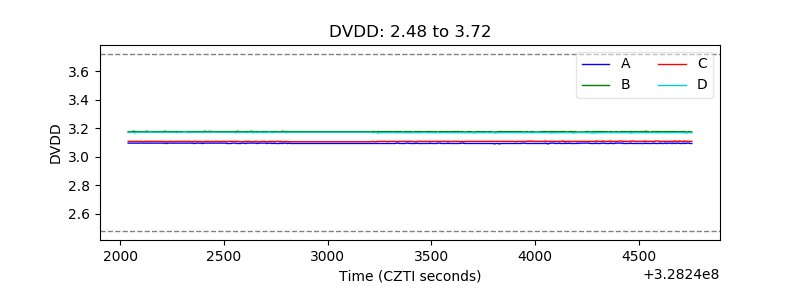 |
| Temperature 1 | 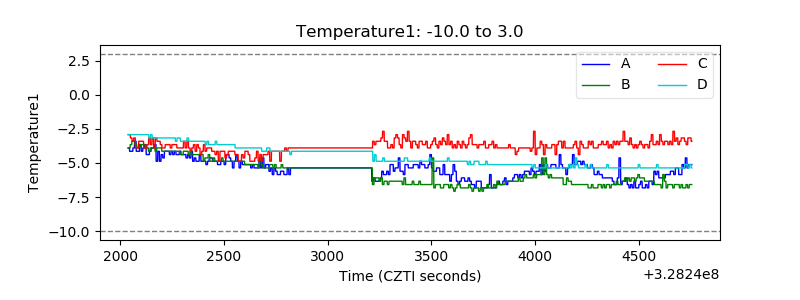 |
| Veto HV Monitor | 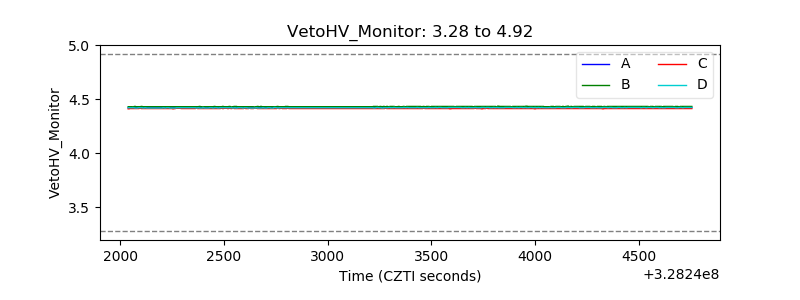 |
| Veto LLD | 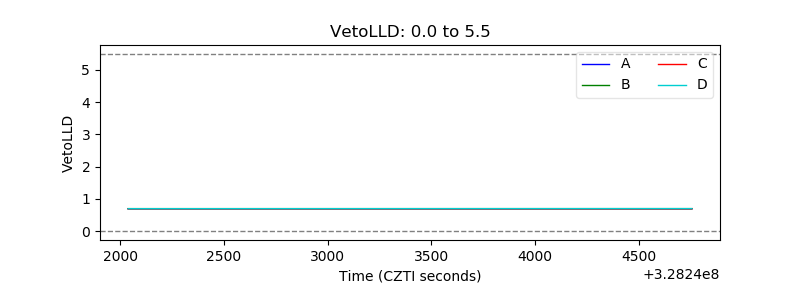 |
| Alpha Counter | 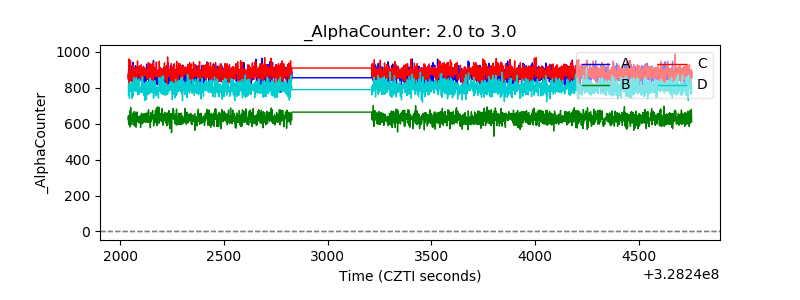 |
| _CPM_Rate | 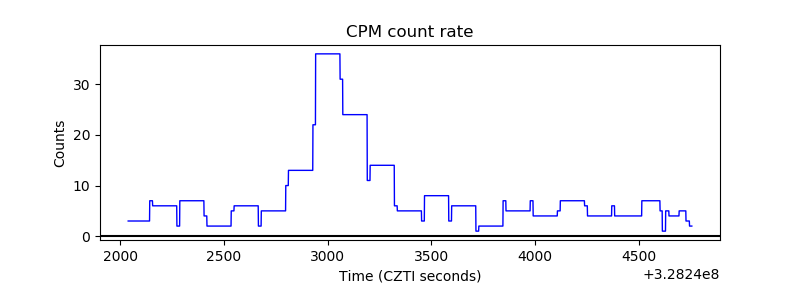 |
| CZT Counter | 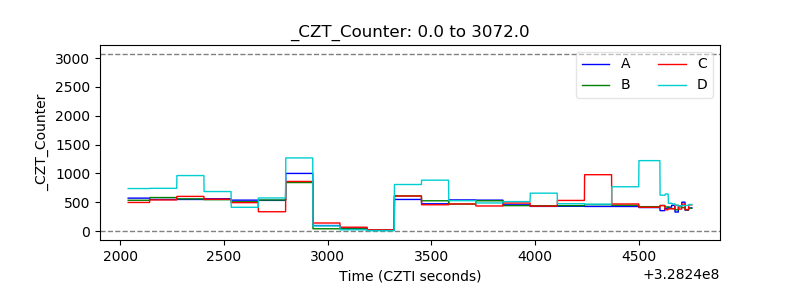 |
| +2.5 Volts monitor | 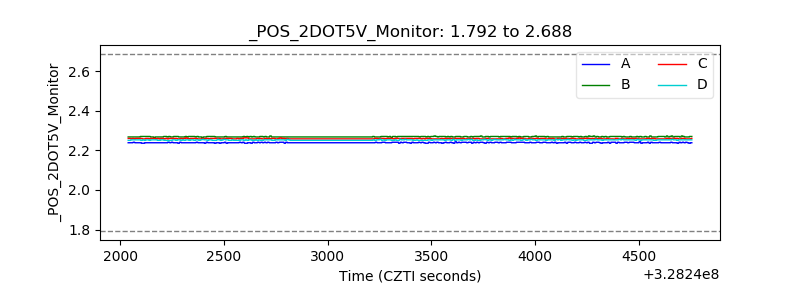 |
| +5 Volts monitor |  |
| _ROLL_ROT | 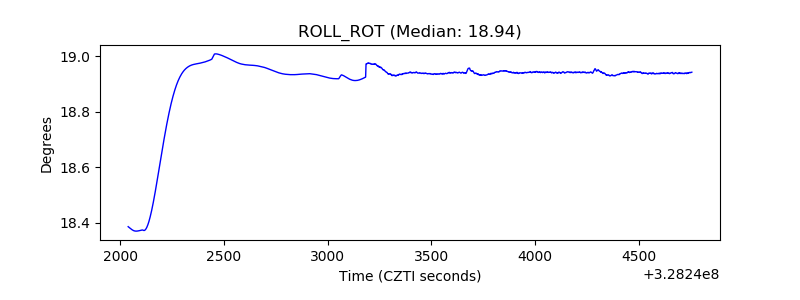 |
| _Roll_DEC | 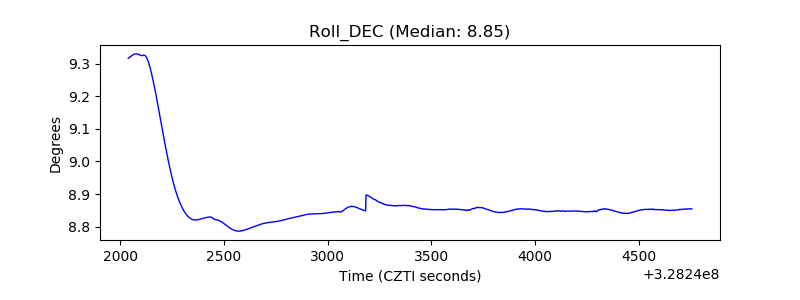 |
| _Roll_RA | 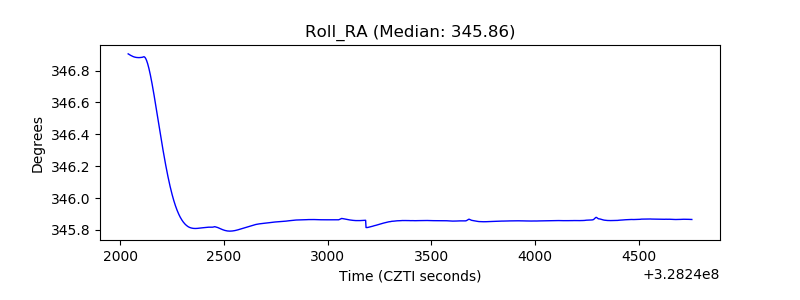 |
| Veto Counter | 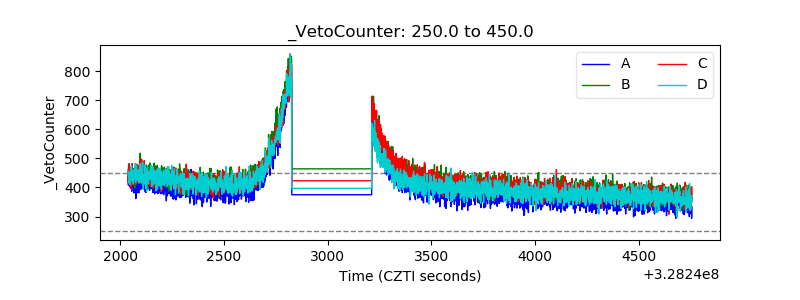 |