| Param | Original file | Final file |
|---|---|---|
| Filename | modeM0/AS1A07_097T01_9000003692_25210cztM0_level2.evt | modeM0/AS1A07_097T01_9000003692_25210cztM0_level2_quad_clean.evt |
| Size (bytes) | 485,513,280 | 83,278,080 |
| Size | 463.0 MB | 79.4 MB |
| Events in quadrant A | 3,050,436 | 534,357 |
| Events in quadrant B | 3,159,863 | 538,603 |
| Events in quadrant C | 3,295,478 | 511,925 |
| Events in quadrant D | 4,769,037 | 495,822 |
| Mode M0 | |||
|---|---|---|---|
| Quadrant | BADHDUFLAG | Total packets | Discarded packets |
| A | 0 | 12883 | 0 |
| B | 0 | 13147 | 0 |
| C | 0 | 13604 | 0 |
| D | 0 | 18367 | 0 |
| Mode M9 | |||
|---|---|---|---|
| Quadrant | BADHDUFLAG | Total packets | Discarded packets |
| A | 0 | 9 | 0 |
| B | 0 | 9 | 0 |
| C | 0 | 9 | 0 |
| D | 0 | 9 | 0 |
| Quadrant | Total seconds | Saturated seconds | Saturation percentage |
|---|---|---|---|
| A | 6315 | 49 | 0.775930% |
| B | 6315 | 54 | 0.855107% |
| C | 6315 | 77 | 1.219319% |
| D | 6315 | 391 | 6.191607% |
Noise dominated data is calculated using 1-second bins in cleaned event files. If a bin has >2000 counts, and if more than 50% of those come from <1% of pixels, then it is considered to be noise-dominated and hence unusable.
| Quadrant | # 1 sec bins | Bins with >0 counts | Bins with >2000 counts | High rate bins dominated by noise | Noise dominated (total time) | Noise dominated (detector-on time) | Marked lightcurve |
|---|---|---|---|---|---|---|---|
| A | 7301 | 6317 | 0 | 0 | 0.00% | 0.00% | 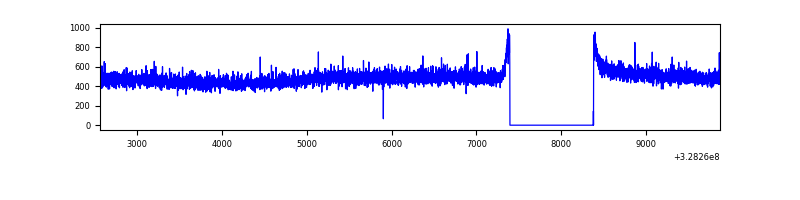 |
| B | 7301 | 6317 | 1 | 1 | 0.01% | 0.02% | 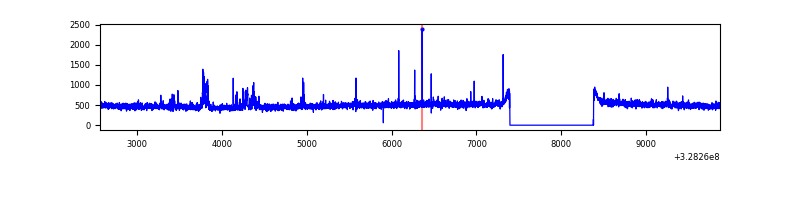 |
| C | 7301 | 6316 | 2 | 2 | 0.03% | 0.03% | 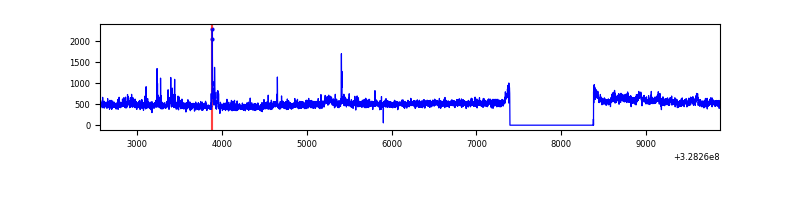 |
| D | 7301 | 6316 | 291 | 291 | 3.99% | 4.61% | 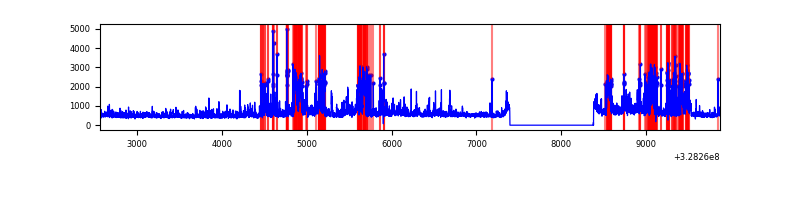 |
Top three noisy pixels from each quadrant. If the there are fewer than three noisy pixels in the level2.evt file, extra rows are filled as -1
| Pixel properties | Quadrant properties | ||||||
|---|---|---|---|---|---|---|---|
| Quadrant | DetID | PixID | Counts | Sigma | Mean | Median | Sigma |
| A | 13 | 254 | 10271 | 59.33 | 791 | 774 | 160.1 |
| A | 3 | 137 | 7298 | 40.76 | 791 | 774 | 160.1 |
| A | 0 | 226 | 6904 | 38.3 | 791 | 774 | 160.1 |
| B | 3 | 64 | 41780 | 270.95 | 780 | 759 | 151.4 |
| B | 0 | 190 | 35917 | 232.23 | 780 | 759 | 151.4 |
| B | 10 | 251 | 18823 | 119.32 | 780 | 759 | 151.4 |
| C | 7 | 247 | 234792 | 1334.18 | 744 | 749 | 175.4 |
| C | 14 | 238 | 120732 | 683.97 | 744 | 749 | 175.4 |
| C | 2 | 16 | 33632 | 187.45 | 744 | 749 | 175.4 |
| D | 10 | 70 | 744540 | 4091.66 | 748 | 725 | 181.8 |
| D | 1 | 52 | 648692 | 3564.41 | 748 | 725 | 181.8 |
| D | 8 | 195 | 306738 | 1683.35 | 748 | 725 | 181.8 |
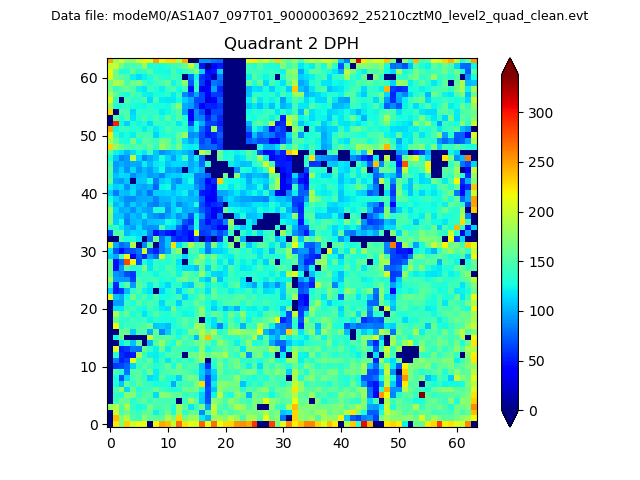
Histogram calculated using DETX and DETY for each event in the final _common_clean file
| Quadrant A | 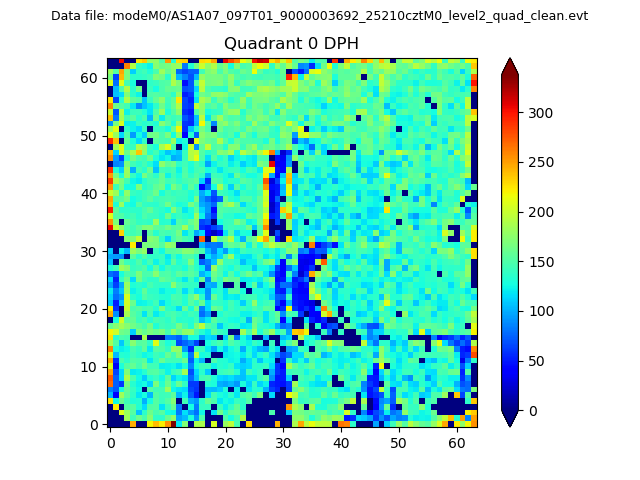 |
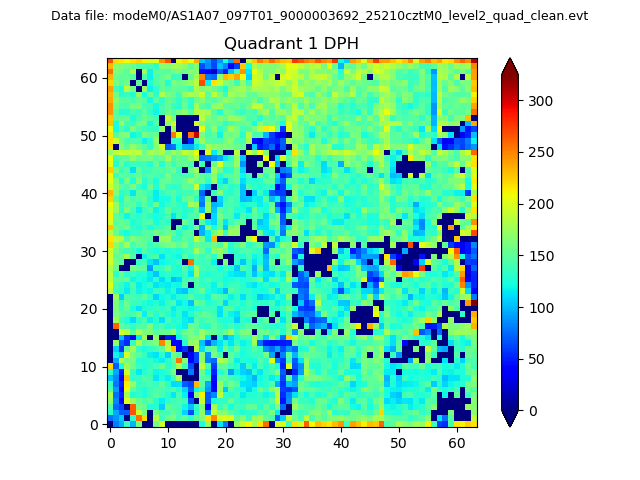 |
Quadrant B |
|---|---|---|---|
| Quadrant D | 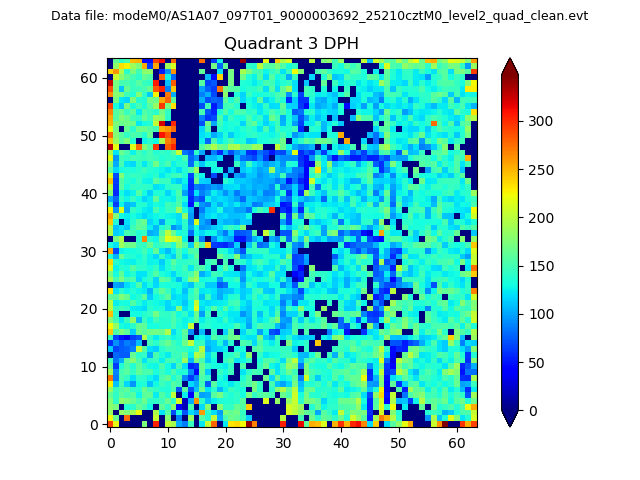 |
 |
Quadrant C |
| Plot type | Count rate plots | Images |
|---|---|---|
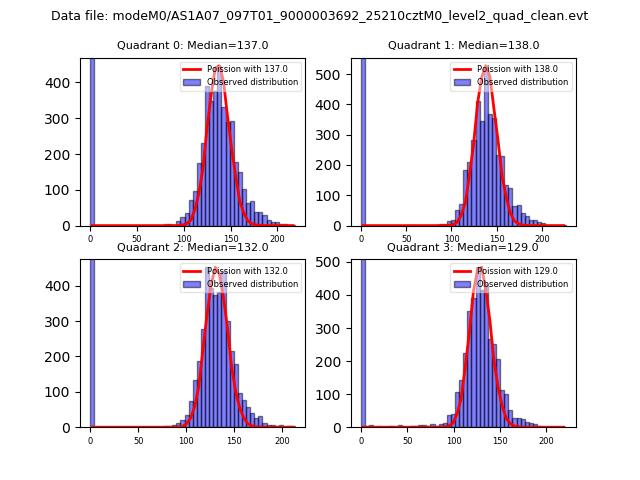
| Comparison with Poisson distribution Blue bars denote a histogram of data divided into 1 sec bins. Red curve is a Poisson curve with rate = median count rate of data. |
 |
 |
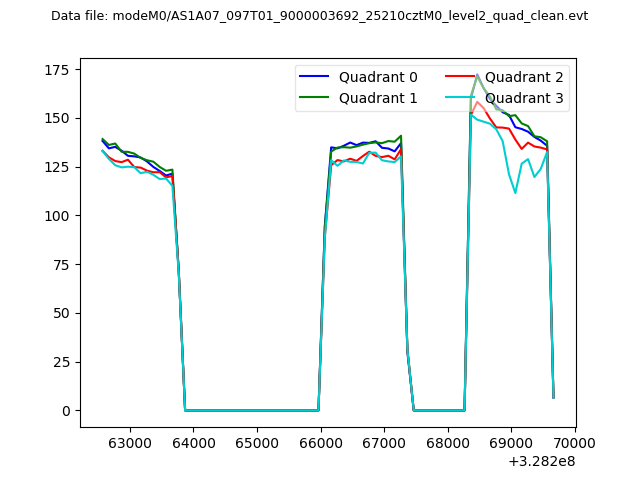
| Quadrant-wise count rates Data is divided into 100 sec bins |
 |
|
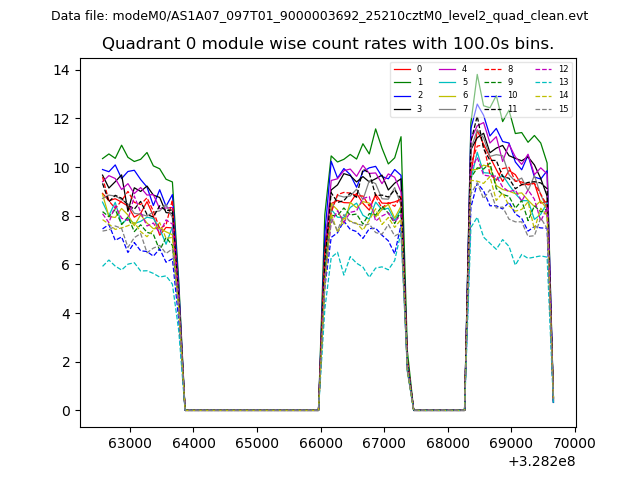
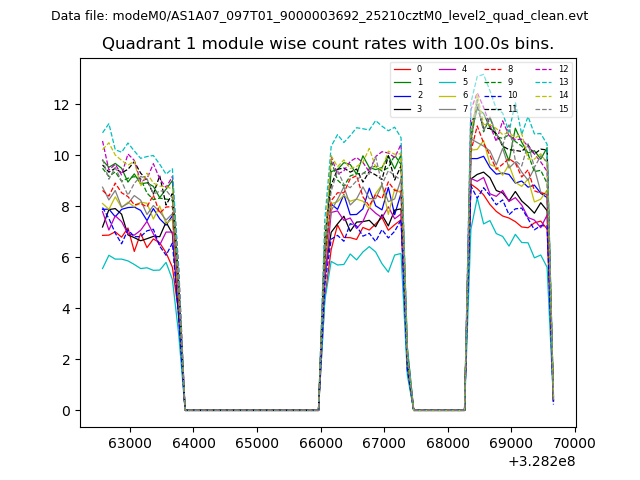
| Module-wise count rates for Quadrant A Data is divided into 100 sec bins |
 |
 |
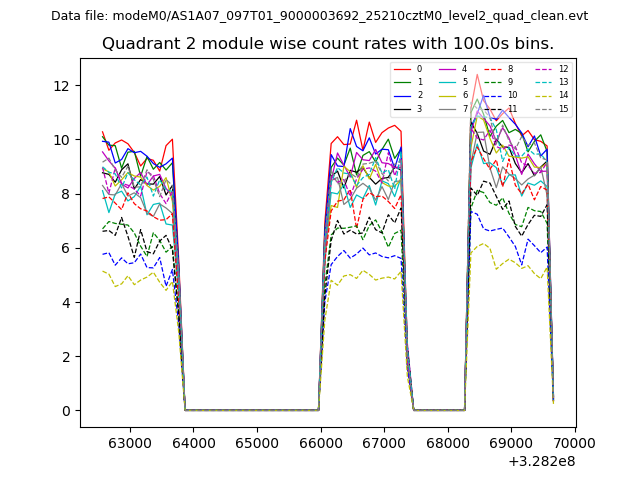
| Module-wise count rates for Quadrant B Data is divided into 100 sec bins |
 |
 |
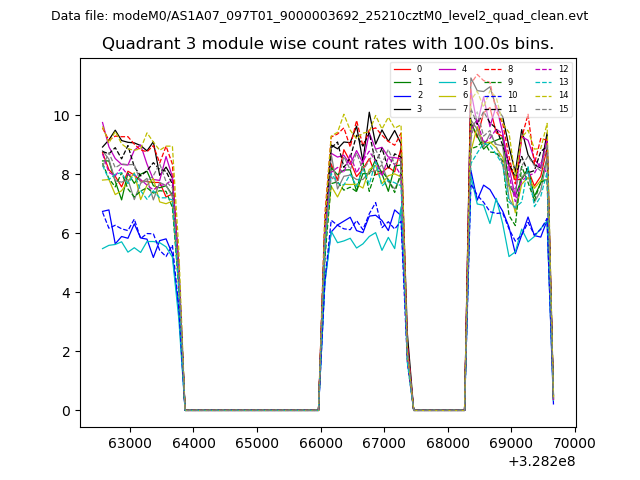
| Module-wise count rates for Quadrant C Data is divided into 100 sec bins |
 |
 |
| Module-wise count rates for Quadrant D Data is divided into 100 sec bins |
 |
 |
| Parameter | Plot |
|---|---|
| CZT HV Monitor | 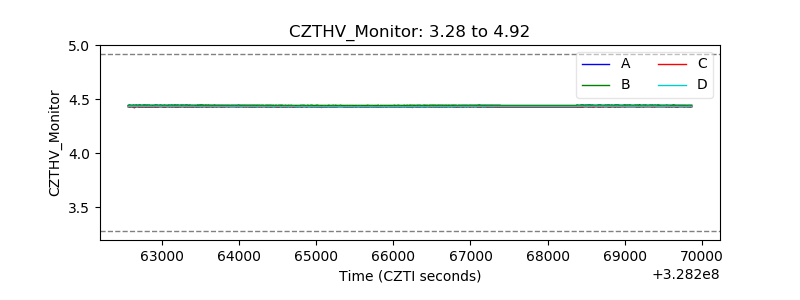 |
| D_VDD | 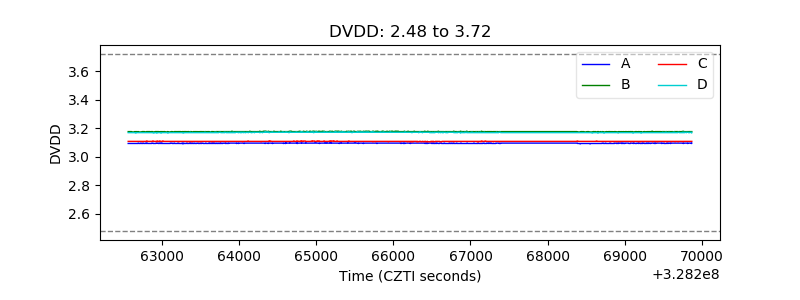 |
| Temperature 1 | 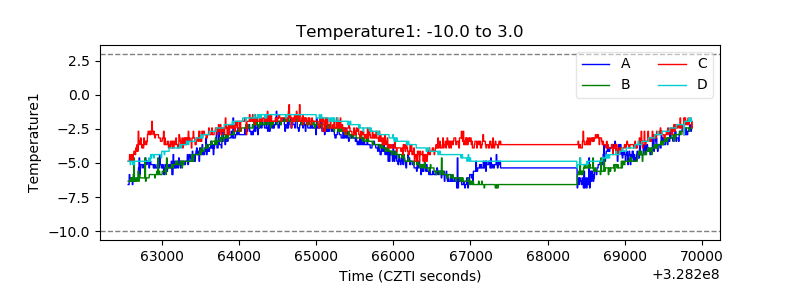 |
| Veto HV Monitor | 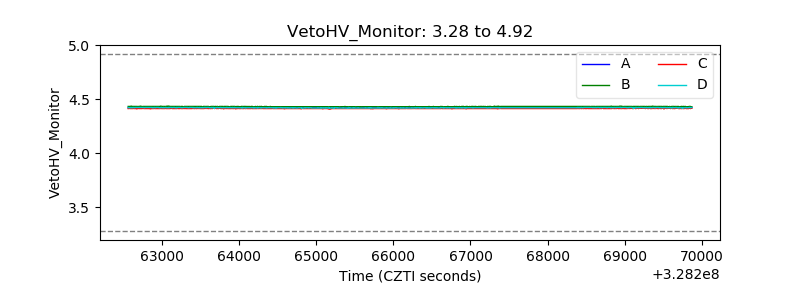 |
| Veto LLD | 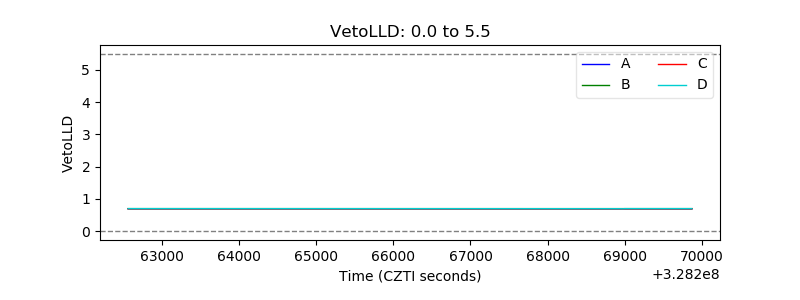 |
| Alpha Counter | 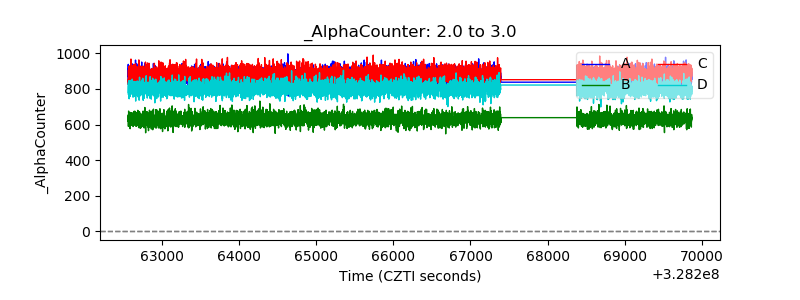 |
| _CPM_Rate | 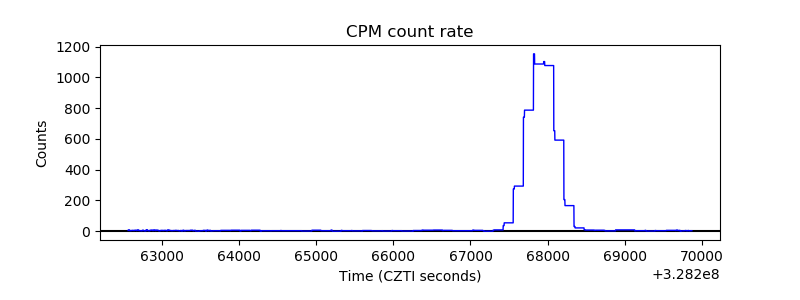 |
| CZT Counter | 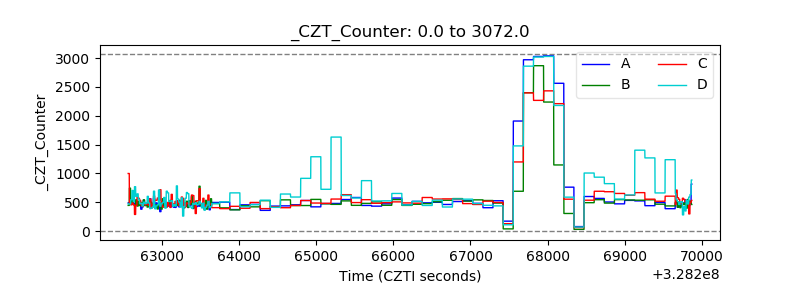 |
| +2.5 Volts monitor | 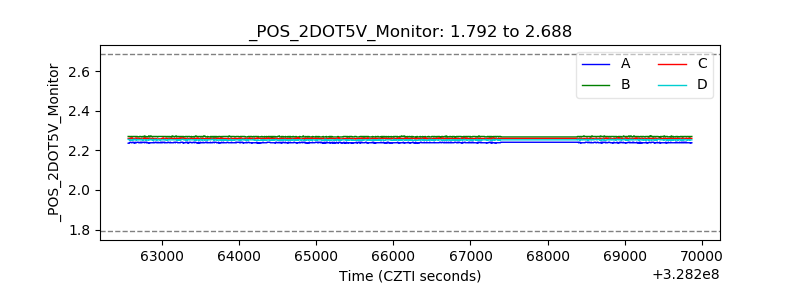 |
| +5 Volts monitor | 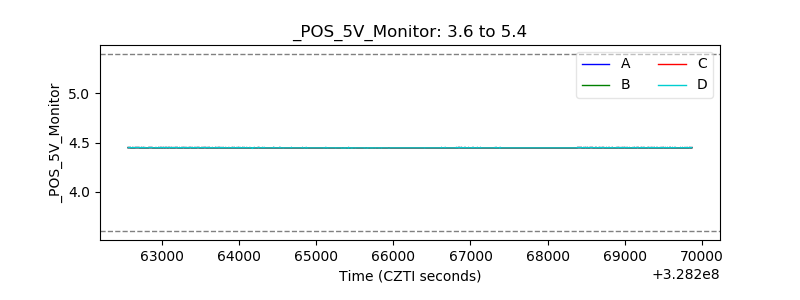 |
| _ROLL_ROT | 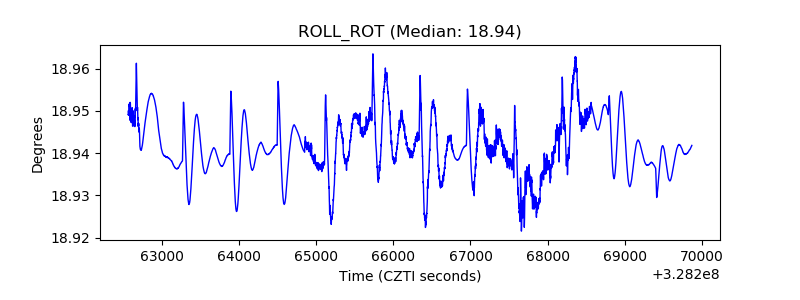 |
| _Roll_DEC | 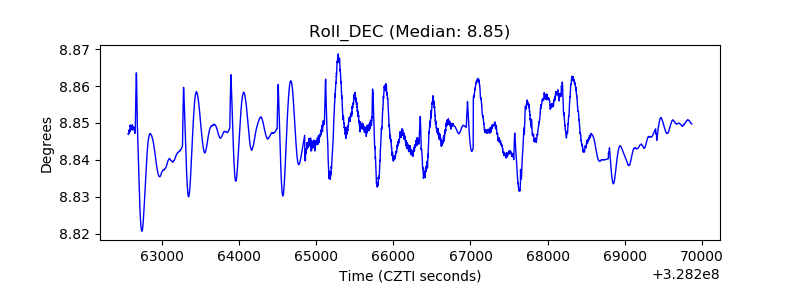 |
| _Roll_RA | 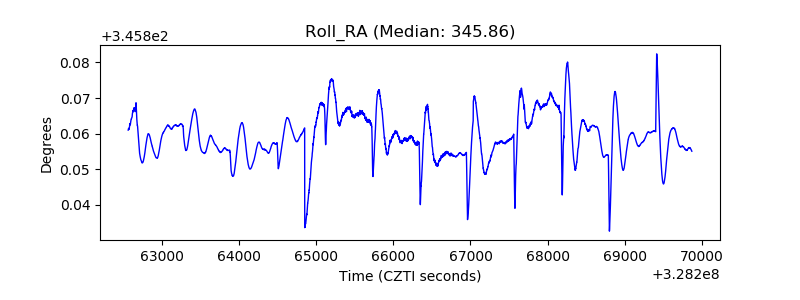 |
| Veto Counter | 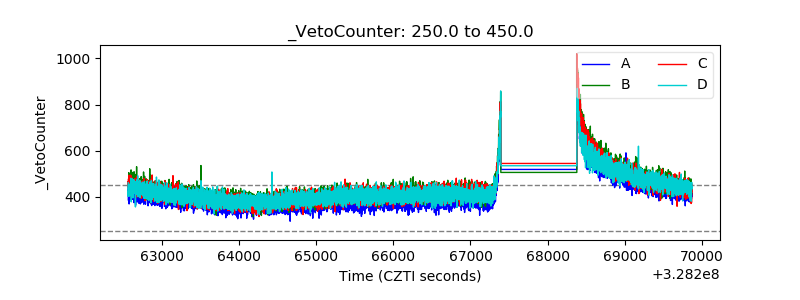 |