| Param | Original file | Final file |
|---|---|---|
| Filename | modeM0/AS1A07_097T01_9000003692_25212cztM0_level2.evt | modeM0/AS1A07_097T01_9000003692_25212cztM0_level2_quad_clean.evt |
| Size (bytes) | 2,281,550,400 | 335,229,120 |
| Size | 2.1 GB | 319.7 MB |
| Events in quadrant A | 13,486,195 | 2,121,200 |
| Events in quadrant B | 14,315,588 | 2,145,948 |
| Events in quadrant C | 19,627,111 | 1,973,784 |
| Events in quadrant D | 19,780,541 | 1,986,370 |
| Mode M0 | |||
|---|---|---|---|
| Quadrant | BADHDUFLAG | Total packets | Discarded packets |
| A | 0 | 57687 | 0 |
| B | 0 | 60013 | 0 |
| C | 0 | 76104 | 0 |
| D | 0 | 77937 | 0 |
| Mode M9 | |||
|---|---|---|---|
| Quadrant | BADHDUFLAG | Total packets | Discarded packets |
| A | 0 | 41 | 0 |
| B | 0 | 41 | 0 |
| C | 0 | 41 | 0 |
| D | 0 | 41 | 0 |
| Quadrant | Total seconds | Saturated seconds | Saturation percentage |
|---|---|---|---|
| A | 28005 | 203 | 0.724871% |
| B | 28005 | 373 | 1.331905% |
| C | 28005 | 2271 | 8.109266% |
| D | 28005 | 1033 | 3.688627% |
Noise dominated data is calculated using 1-second bins in cleaned event files. If a bin has >2000 counts, and if more than 50% of those come from <1% of pixels, then it is considered to be noise-dominated and hence unusable.
| Quadrant | # 1 sec bins | Bins with >0 counts | Bins with >2000 counts | High rate bins dominated by noise | Noise dominated (total time) | Noise dominated (detector-on time) | Marked lightcurve |
|---|---|---|---|---|---|---|---|
| A | 32196 | 28011 | 3 | 3 | 0.01% | 0.01% | 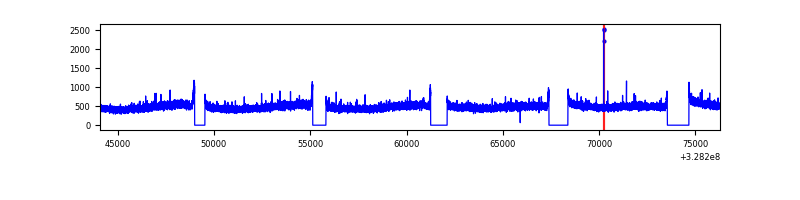 |
| B | 32196 | 28011 | 60 | 60 | 0.19% | 0.21% | 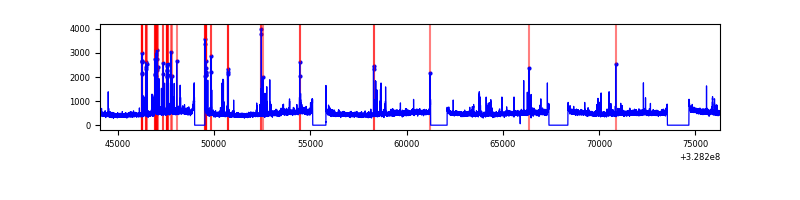 |
| C | 32196 | 28010 | 1486 | 1486 | 4.62% | 5.31% | 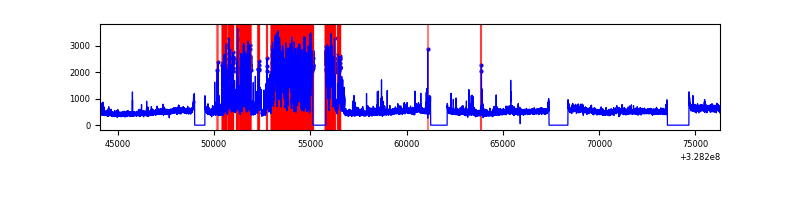 |
| D | 32196 | 28010 | 749 | 749 | 2.33% | 2.67% | 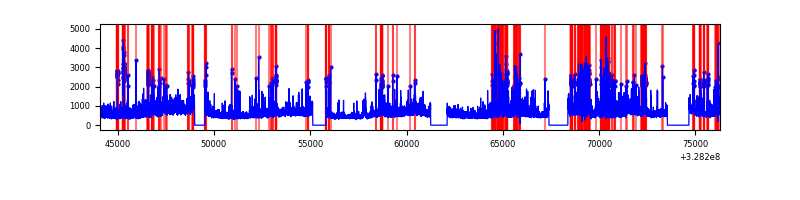 |
Top three noisy pixels from each quadrant. If the there are fewer than three noisy pixels in the level2.evt file, extra rows are filled as -1
| Pixel properties | Quadrant properties | ||||||
|---|---|---|---|---|---|---|---|
| Quadrant | DetID | PixID | Counts | Sigma | Mean | Median | Sigma |
| A | 13 | 254 | 44045 | 58.38 | 3490 | 3423 | 695.8 |
| A | 3 | 137 | 32446 | 41.71 | 3490 | 3423 | 695.8 |
| A | 0 | 226 | 30005 | 38.2 | 3490 | 3423 | 695.8 |
| B | 3 | 64 | 539000 | 821.89 | 3439 | 3354 | 651.7 |
| B | 0 | 190 | 181690 | 273.64 | 3439 | 3354 | 651.7 |
| B | 12 | 111 | 81012 | 119.16 | 3439 | 3354 | 651.7 |
| C | 7 | 247 | 6131906 | 8220.68 | 3198 | 3226 | 745.5 |
| C | 14 | 238 | 514590 | 685.92 | 3198 | 3226 | 745.5 |
| C | 2 | 16 | 400529 | 532.92 | 3198 | 3226 | 745.5 |
| D | 8 | 195 | 2077639 | 2549.02 | 3340 | 3242 | 813.8 |
| D | 1 | 52 | 1858921 | 2280.26 | 3340 | 3242 | 813.8 |
| D | 10 | 70 | 1227361 | 1504.2 | 3340 | 3242 | 813.8 |
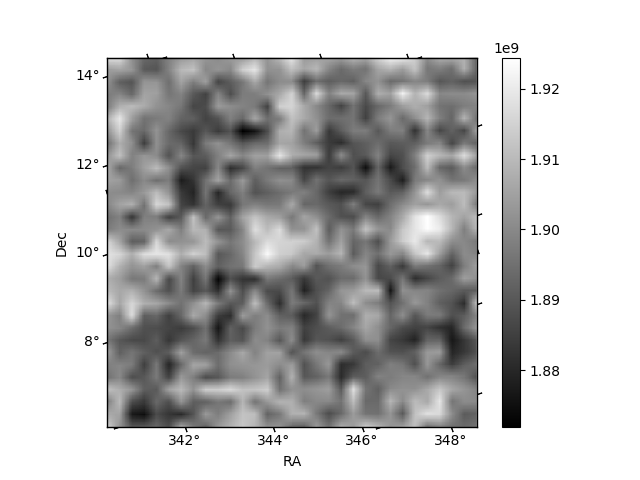
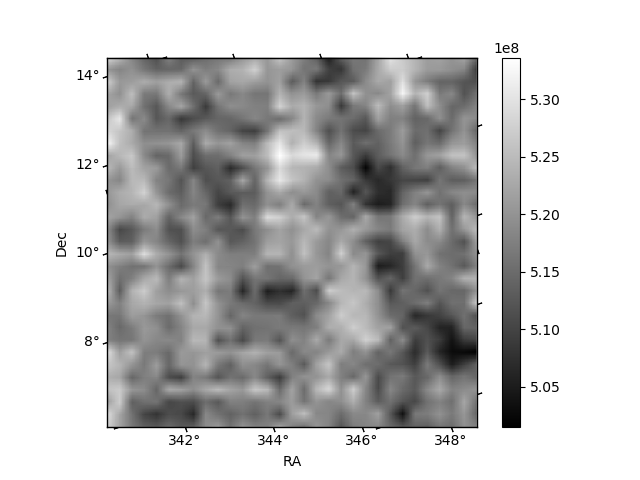
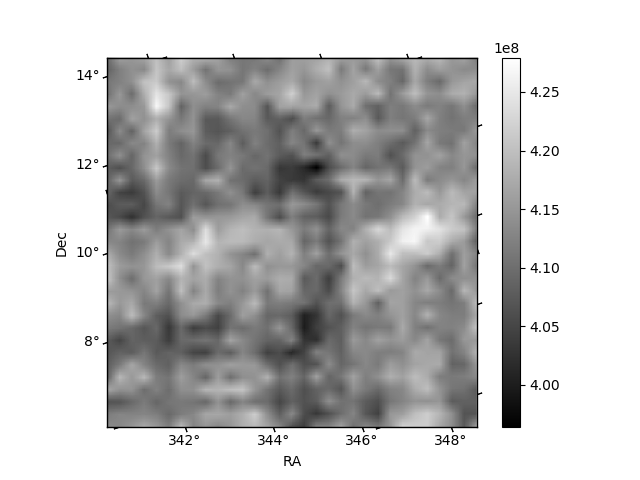
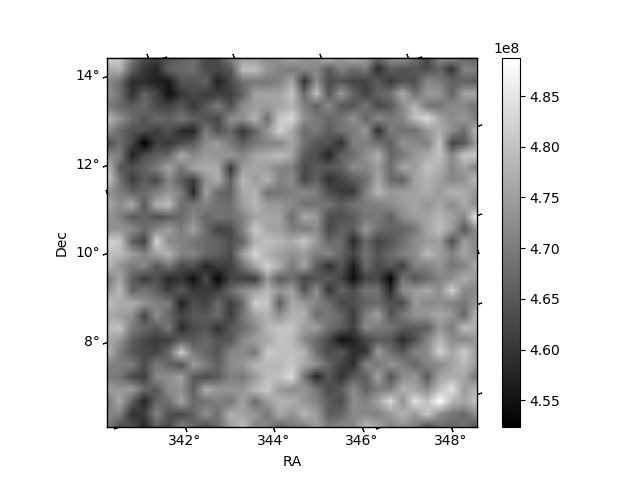
Histogram calculated using DETX and DETY for each event in the final _common_clean file
| Quadrant A | 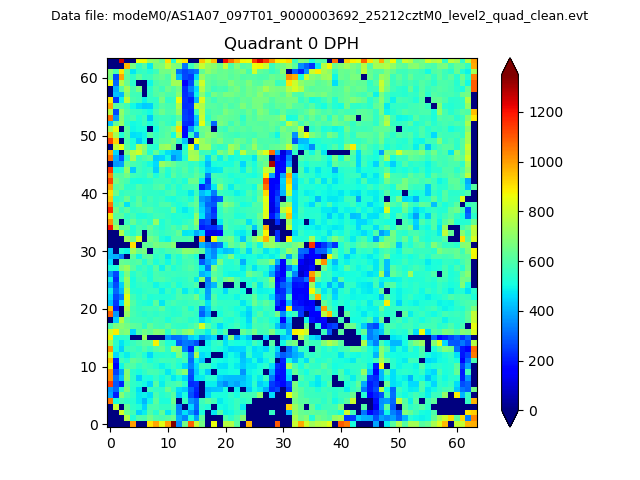 |
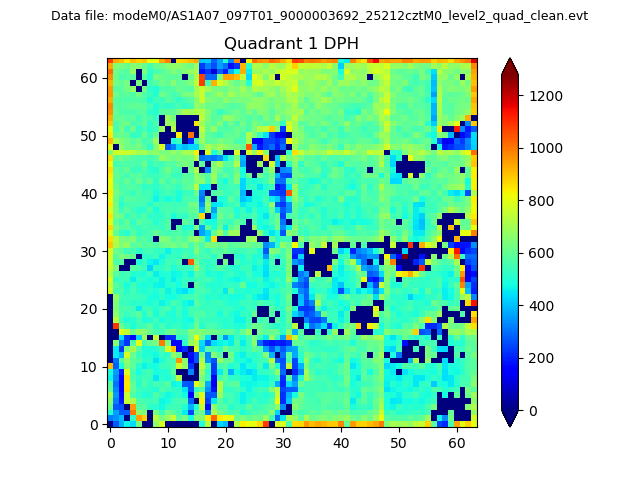 |
Quadrant B |
|---|---|---|---|
| Quadrant D | 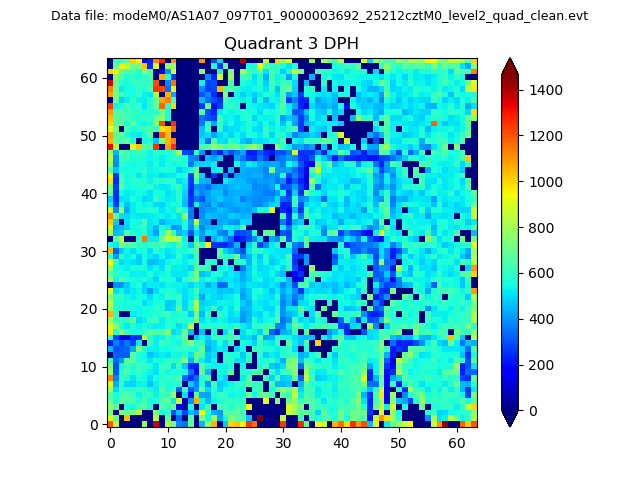 |
 |
Quadrant C |
| Plot type | Count rate plots | Images |
|---|---|---|
| Comparison with Poisson distribution Blue bars denote a histogram of data divided into 1 sec bins. Red curve is a Poisson curve with rate = median count rate of data. |
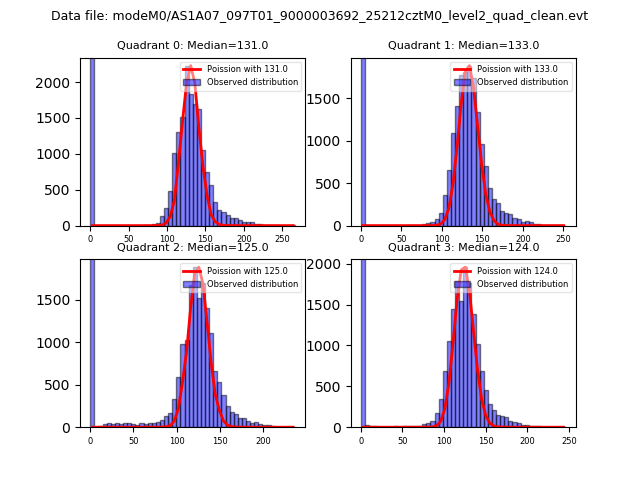 |
 |
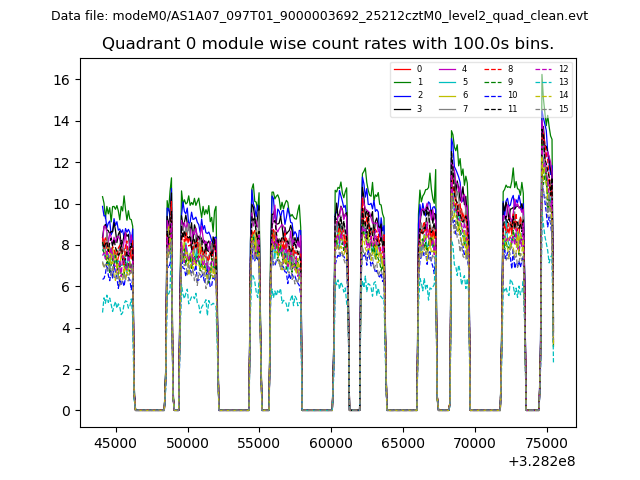
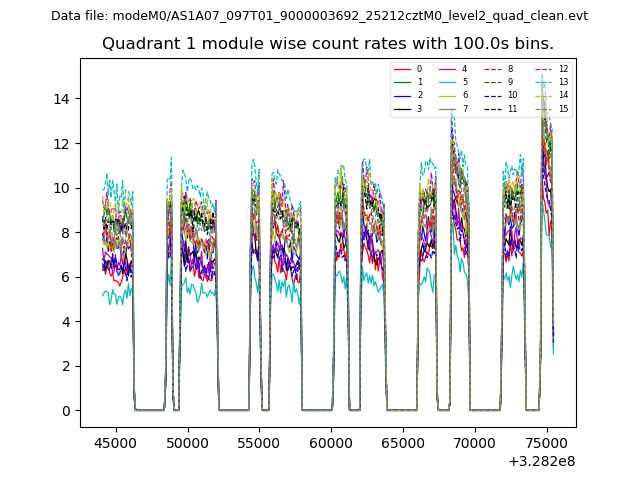
| Quadrant-wise count rates Data is divided into 100 sec bins |
 |
|
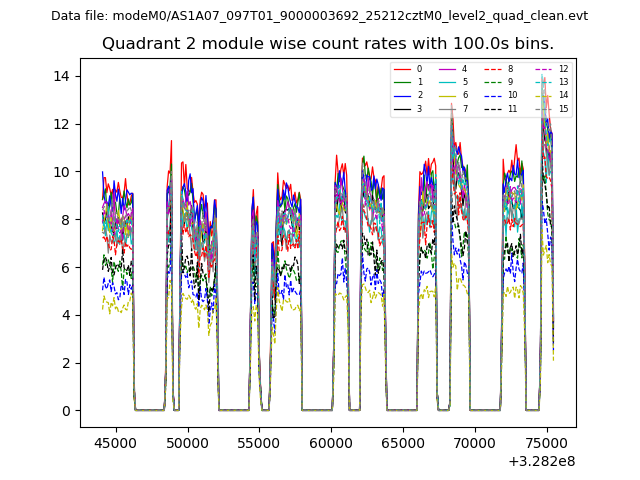
| Module-wise count rates for Quadrant A Data is divided into 100 sec bins |
 |
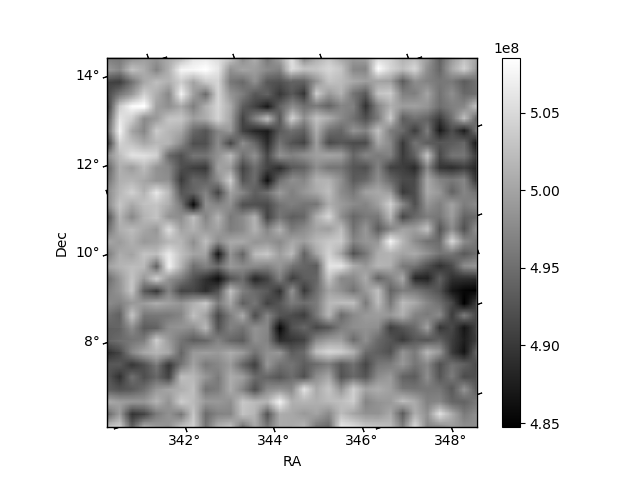 |
| Module-wise count rates for Quadrant B Data is divided into 100 sec bins |
 |
 |
| Module-wise count rates for Quadrant C Data is divided into 100 sec bins |
 |
 |
| Module-wise count rates for Quadrant D Data is divided into 100 sec bins |
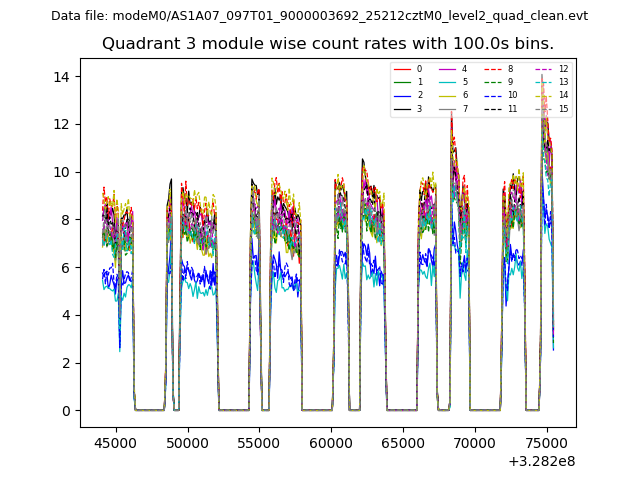 |
 |
| Parameter | Plot |
|---|---|
| CZT HV Monitor | 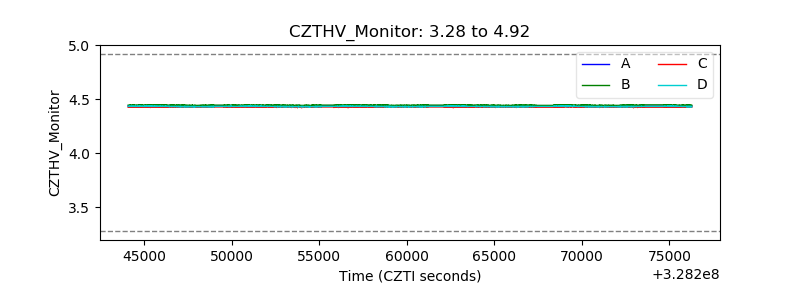 |
| D_VDD | 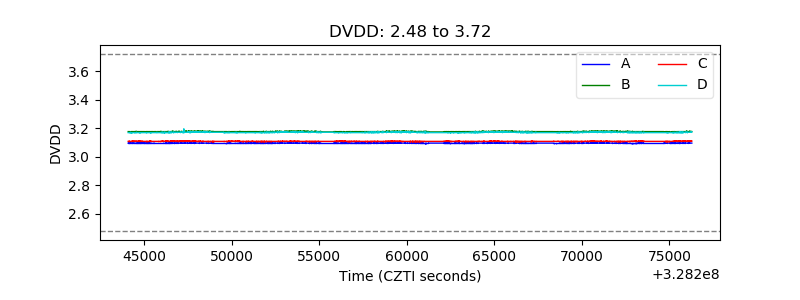 |
| Temperature 1 | 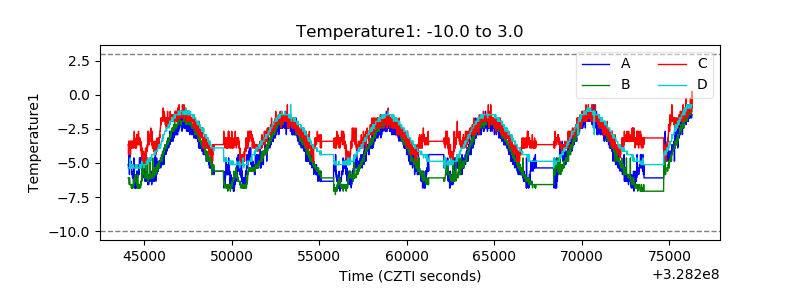 |
| Veto HV Monitor | 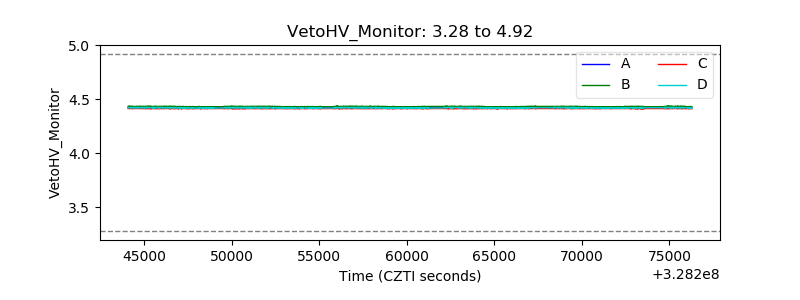 |
| Veto LLD | 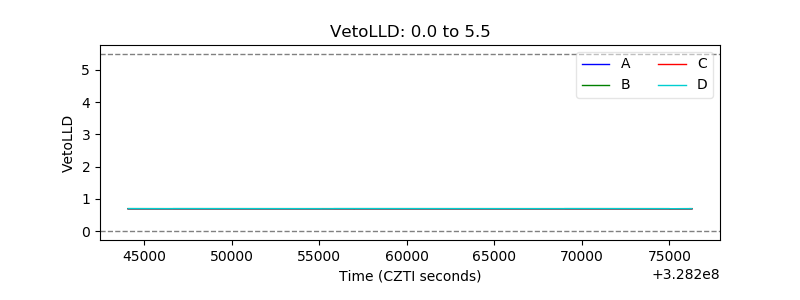 |
| Alpha Counter | 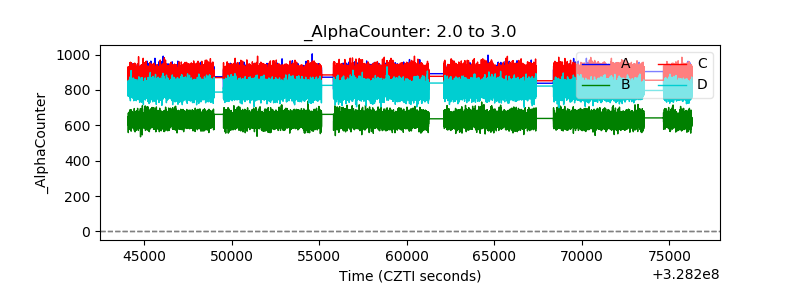 |
| _CPM_Rate |  |
| CZT Counter |  |
| +2.5 Volts monitor |  |
| +5 Volts monitor |  |
| _ROLL_ROT | 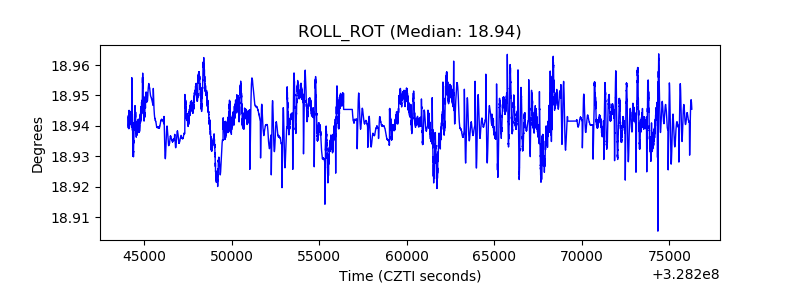 |
| _Roll_DEC | 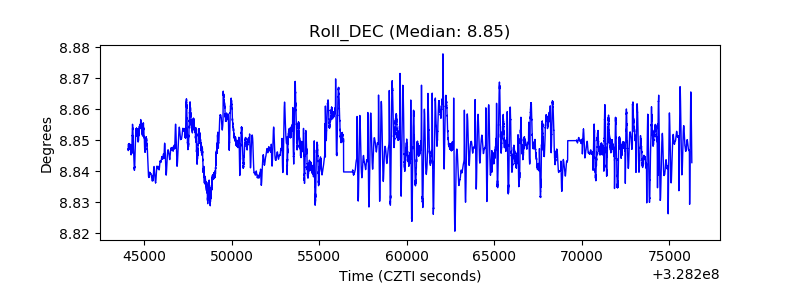 |
| _Roll_RA |  |
| Veto Counter | 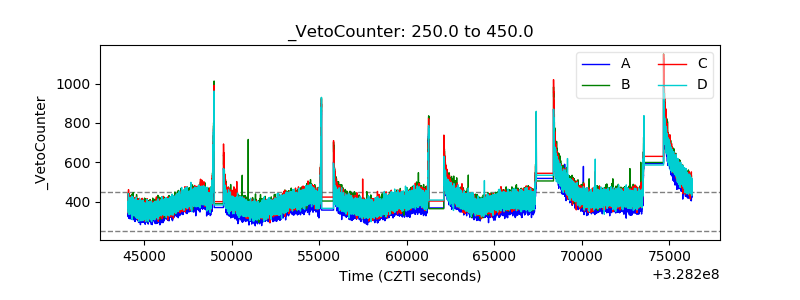 |