| Param | Original file | Final file |
|---|---|---|
| Filename | modeM0/AS1A07_097T01_9000003692_25214cztM0_level2.evt | modeM0/AS1A07_097T01_9000003692_25214cztM0_level2_quad_clean.evt |
| Size (bytes) | 710,556,480 | 65,851,200 |
| Size | 677.6 MB | 62.8 MB |
| Events in quadrant A | 3,623,803 | 409,596 |
| Events in quadrant B | 4,009,242 | 409,277 |
| Events in quadrant C | 3,692,311 | 388,698 |
| Events in quadrant D | 9,760,890 | 339,173 |
| Mode M0 | |||
|---|---|---|---|
| Quadrant | BADHDUFLAG | Total packets | Discarded packets |
| A | 0 | 14768 | 0 |
| B | 0 | 16011 | 0 |
| C | 0 | 14955 | 0 |
| D | 0 | 33437 | 0 |
| Mode M9 | |||
|---|---|---|---|
| Quadrant | BADHDUFLAG | Total packets | Discarded packets |
| A | 0 | 12 | 0 |
| B | 0 | 12 | 0 |
| C | 0 | 12 | 0 |
| D | 0 | 12 | 0 |
| Quadrant | Total seconds | Saturated seconds | Saturation percentage |
|---|---|---|---|
| A | 6396 | 84 | 1.313321% |
| B | 6397 | 229 | 3.579803% |
| C | 6397 | 141 | 2.204158% |
| D | 6397 | 2640 | 41.269345% |
Noise dominated data is calculated using 1-second bins in cleaned event files. If a bin has >2000 counts, and if more than 50% of those come from <1% of pixels, then it is considered to be noise-dominated and hence unusable.
| Quadrant | # 1 sec bins | Bins with >0 counts | Bins with >2000 counts | High rate bins dominated by noise | Noise dominated (total time) | Noise dominated (detector-on time) | Marked lightcurve |
|---|---|---|---|---|---|---|---|
| A | 7676 | 6397 | 0 | 0 | 0.00% | 0.00% | 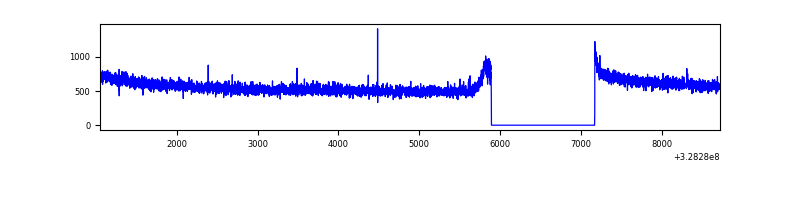 |
| B | 7677 | 6398 | 77 | 77 | 1.00% | 1.20% | 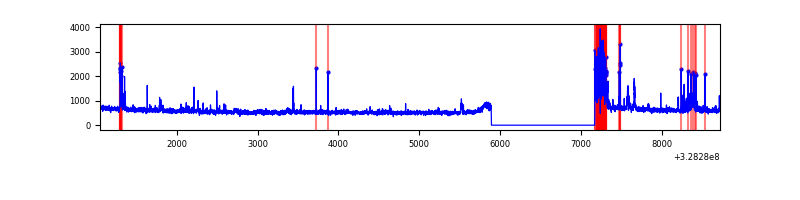 |
| C | 7677 | 6398 | 2 | 2 | 0.03% | 0.03% | 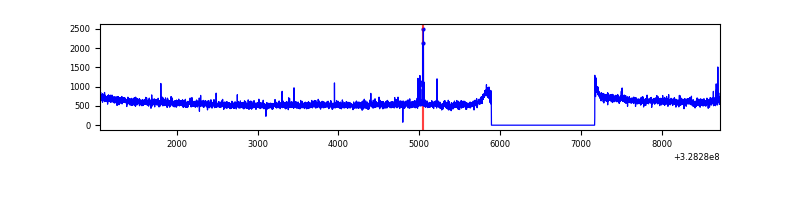 |
| D | 7677 | 6398 | 2107 | 2107 | 27.45% | 32.93% | 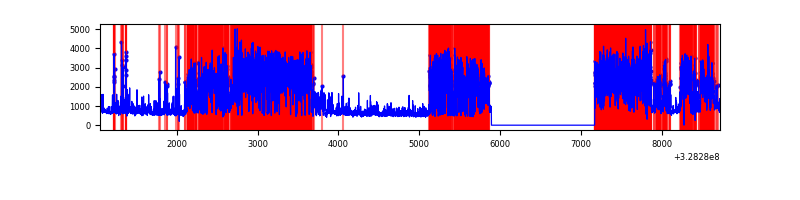 |
Top three noisy pixels from each quadrant. If the there are fewer than three noisy pixels in the level2.evt file, extra rows are filled as -1
| Pixel properties | Quadrant properties | ||||||
|---|---|---|---|---|---|---|---|
| Quadrant | DetID | PixID | Counts | Sigma | Mean | Median | Sigma |
| A | 13 | 254 | 10226 | 50.3 | 940 | 927 | 184.9 |
| A | 0 | 226 | 8281 | 39.78 | 940 | 927 | 184.9 |
| A | 3 | 137 | 7692 | 36.59 | 940 | 927 | 184.9 |
| B | 3 | 64 | 315446 | 1859.64 | 912 | 895 | 169.1 |
| B | 0 | 190 | 63096 | 367.74 | 912 | 895 | 169.1 |
| B | 0 | 189 | 28901 | 165.57 | 912 | 895 | 169.1 |
| C | 14 | 238 | 146838 | 718.11 | 884 | 893 | 203.2 |
| C | 7 | 247 | 53205 | 257.4 | 884 | 893 | 203.2 |
| C | 2 | 16 | 29108 | 138.83 | 884 | 893 | 203.2 |
| D | 1 | 52 | 5293165 | 30419.58 | 714 | 696 | 174.0 |
| D | 12 | 233 | 794910 | 4564.91 | 714 | 696 | 174.0 |
| D | 10 | 70 | 375901 | 2156.57 | 714 | 696 | 174.0 |
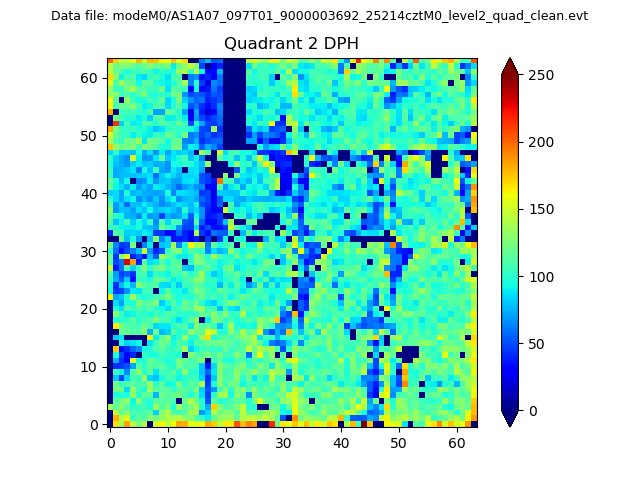
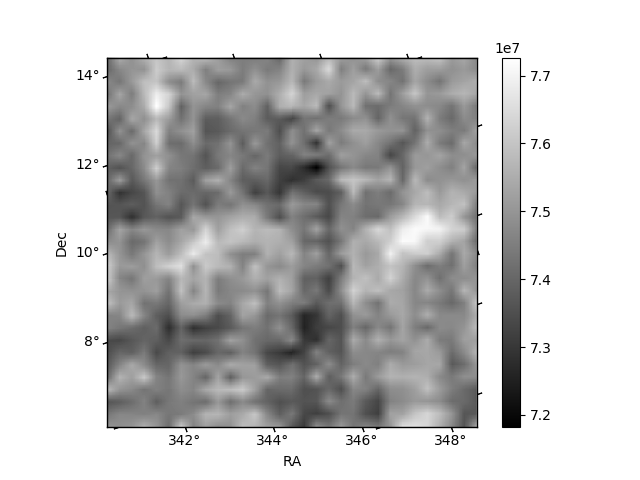
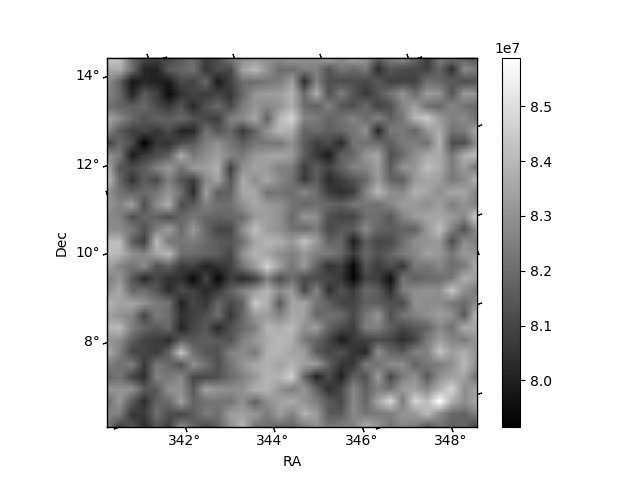
Histogram calculated using DETX and DETY for each event in the final _common_clean file
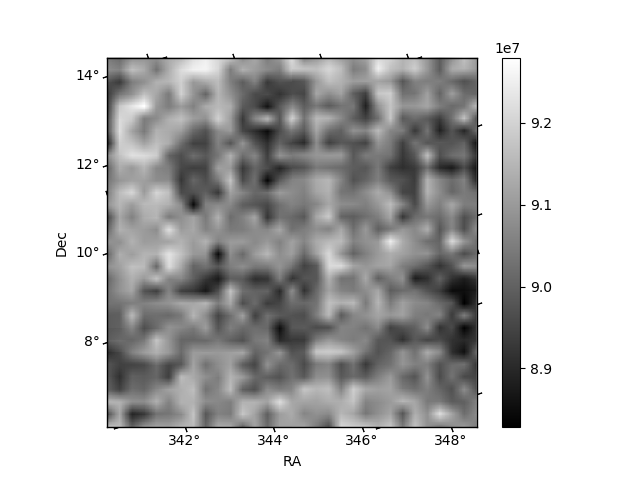
| Quadrant A |  |
 |
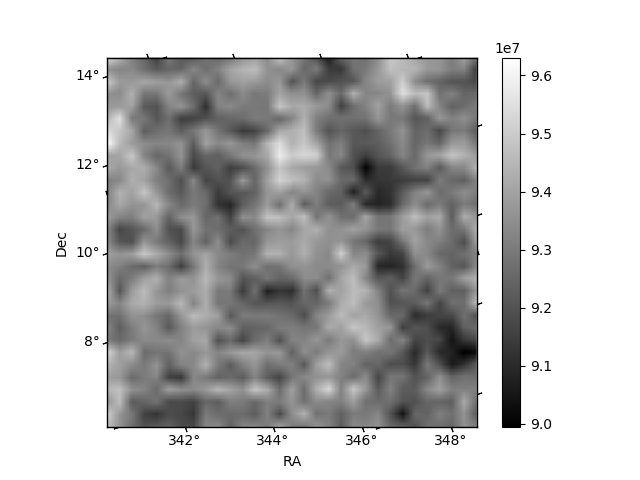
Quadrant B |
|---|---|---|---|
| Quadrant D |  |
 |
Quadrant C |
| Plot type | Count rate plots | Images |
|---|---|---|
| Comparison with Poisson distribution Blue bars denote a histogram of data divided into 1 sec bins. Red curve is a Poisson curve with rate = median count rate of data. |
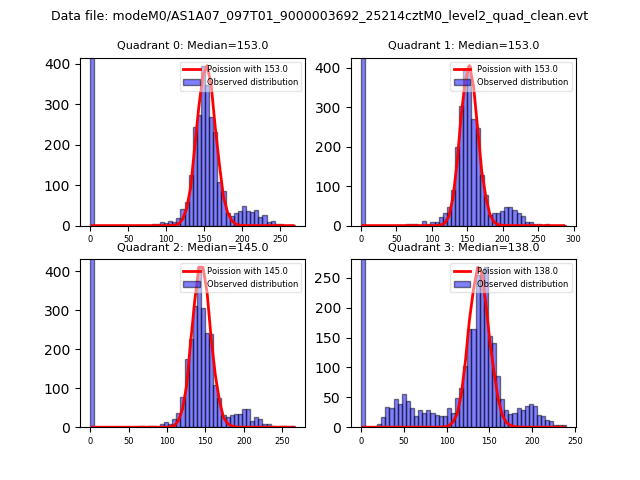 |
 |
| Quadrant-wise count rates Data is divided into 100 sec bins |
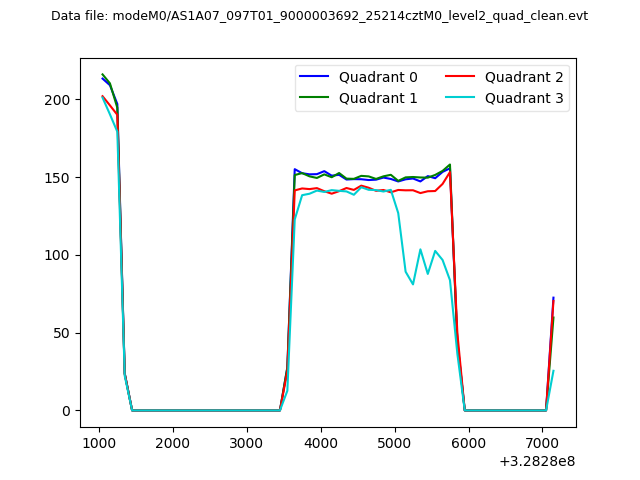 |
|
| Module-wise count rates for Quadrant A Data is divided into 100 sec bins |
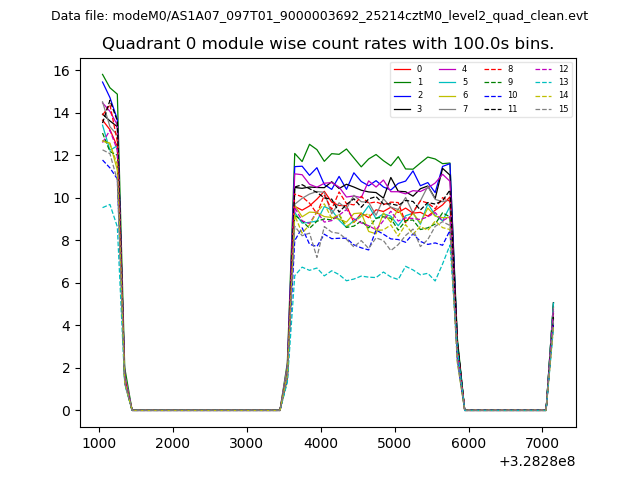 |
 |
| Module-wise count rates for Quadrant B Data is divided into 100 sec bins |
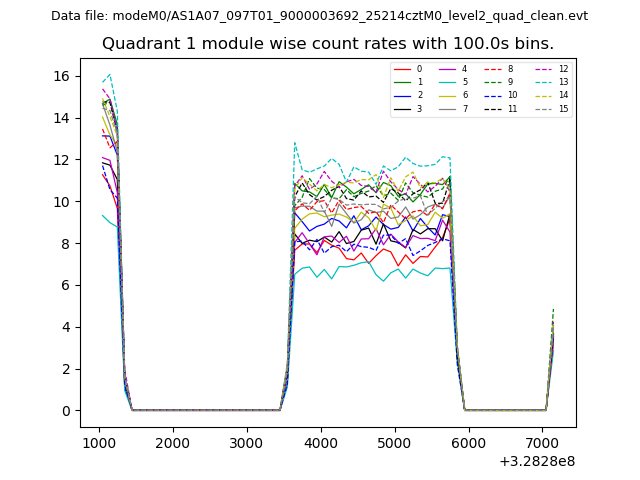 |
 |
| Module-wise count rates for Quadrant C Data is divided into 100 sec bins |
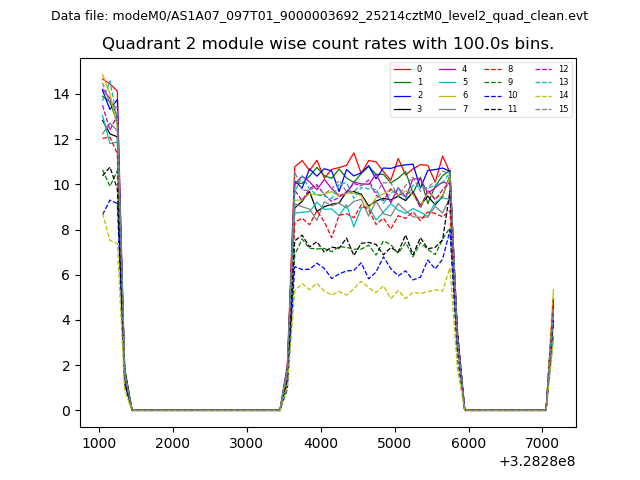 |
 |
| Module-wise count rates for Quadrant D Data is divided into 100 sec bins |
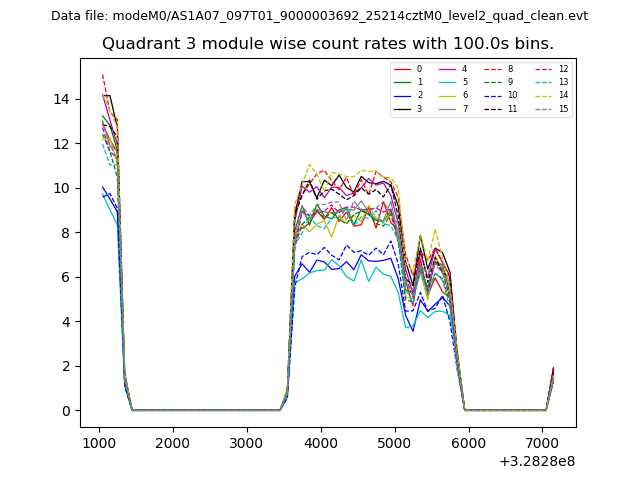 |
 |
| Parameter | Plot |
|---|---|
| CZT HV Monitor | 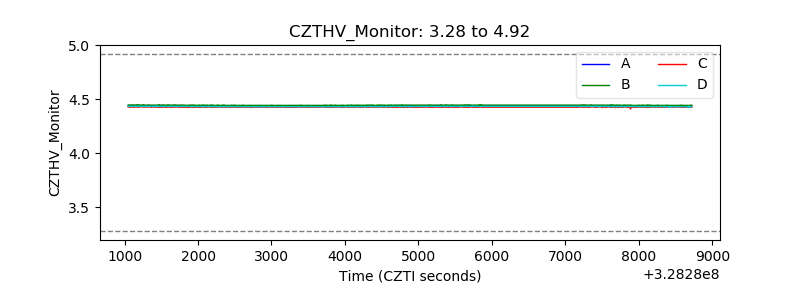 |
| D_VDD | 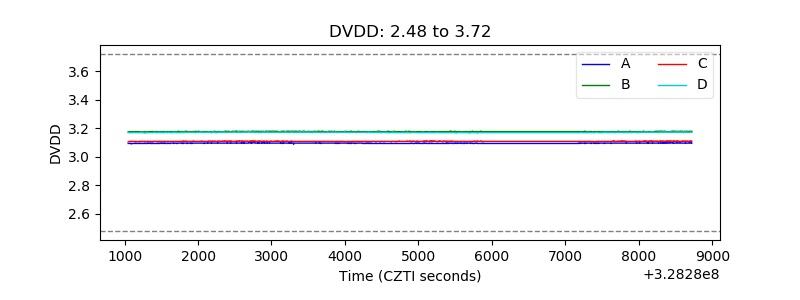 |
| Temperature 1 | 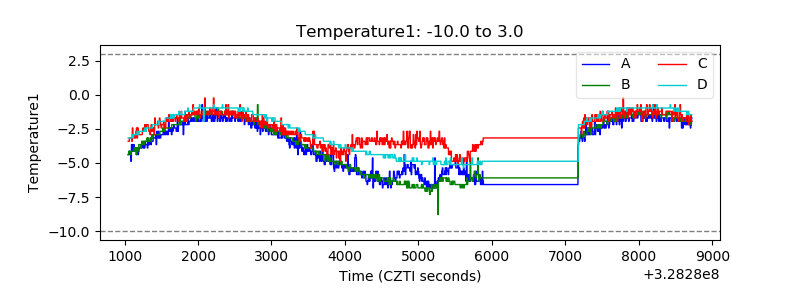 |
| Veto HV Monitor | 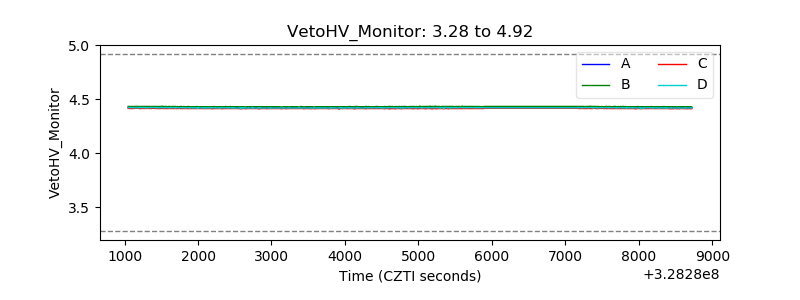 |
| Veto LLD |  |
| Alpha Counter | 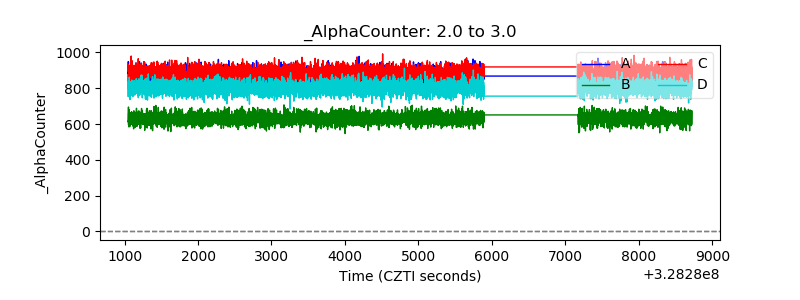 |
| _CPM_Rate | 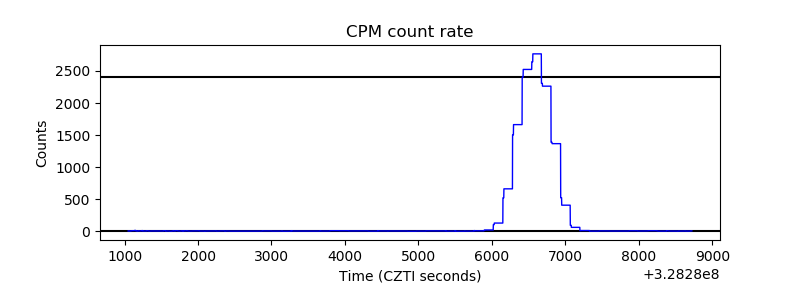 |
| CZT Counter | 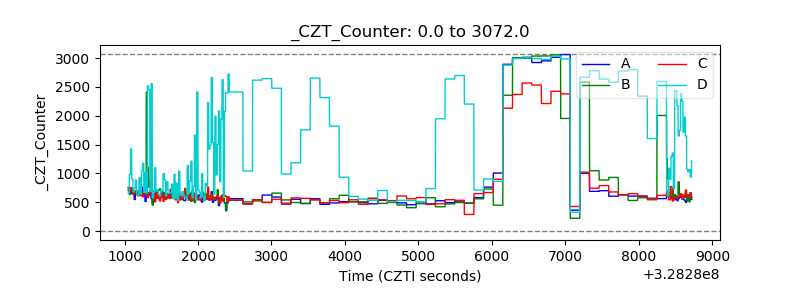 |
| +2.5 Volts monitor |  |
| +5 Volts monitor |  |
| _ROLL_ROT | 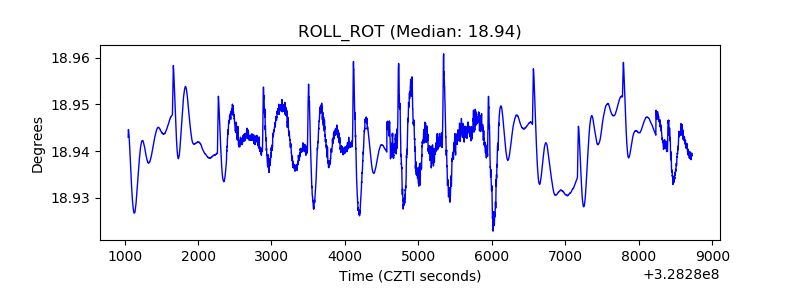 |
| _Roll_DEC | 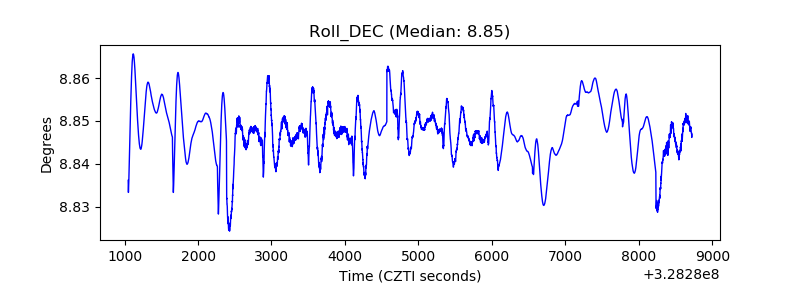 |
| _Roll_RA | 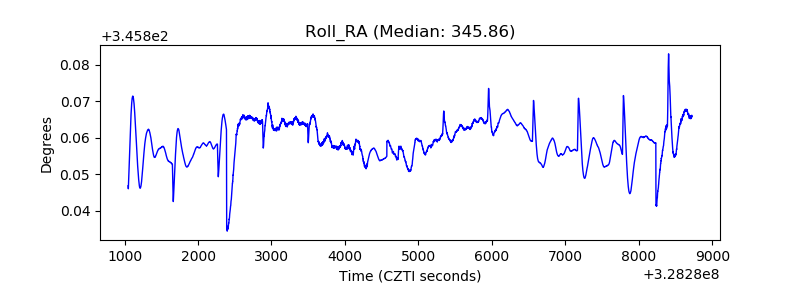 |
| Veto Counter | 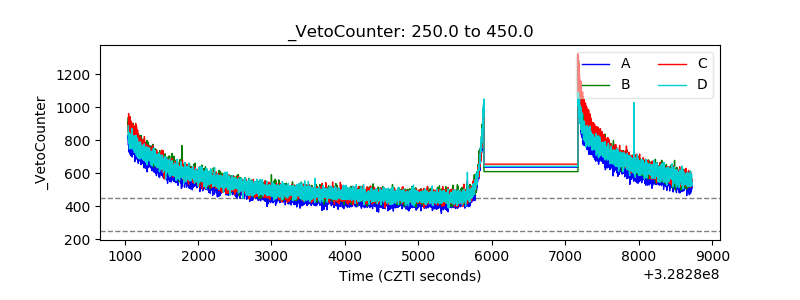 |