| Param | Original file | Final file |
|---|---|---|
| Filename | modeM0/AS1A07_097T01_9000003692_25215cztM0_level2.evt | modeM0/AS1A07_097T01_9000003692_25215cztM0_level2_quad_clean.evt |
| Size (bytes) | 607,253,760 | 63,806,400 |
| Size | 579.1 MB | 60.9 MB |
| Events in quadrant A | 3,338,742 | 398,522 |
| Events in quadrant B | 4,280,420 | 390,610 |
| Events in quadrant C | 3,419,457 | 379,591 |
| Events in quadrant D | 6,949,509 | 347,124 |
| Mode M0 | |||
|---|---|---|---|
| Quadrant | BADHDUFLAG | Total packets | Discarded packets |
| A | 0 | 13681 | 0 |
| B | 0 | 16703 | 0 |
| C | 0 | 13899 | 0 |
| D | 0 | 25040 | 0 |
| Mode M9 | |||
|---|---|---|---|
| Quadrant | BADHDUFLAG | Total packets | Discarded packets |
| A | 0 | 14 | 0 |
| B | 0 | 14 | 0 |
| C | 0 | 14 | 0 |
| D | 0 | 14 | 0 |
| Quadrant | Total seconds | Saturated seconds | Saturation percentage |
|---|---|---|---|
| A | 5953 | 72 | 1.209474% |
| B | 5954 | 340 | 5.710447% |
| C | 5954 | 115 | 1.931475% |
| D | 5954 | 1221 | 20.507222% |
Noise dominated data is calculated using 1-second bins in cleaned event files. If a bin has >2000 counts, and if more than 50% of those come from <1% of pixels, then it is considered to be noise-dominated and hence unusable.
| Quadrant | # 1 sec bins | Bins with >0 counts | Bins with >2000 counts | High rate bins dominated by noise | Noise dominated (total time) | Noise dominated (detector-on time) | Marked lightcurve |
|---|---|---|---|---|---|---|---|
| A | 7303 | 5954 | 0 | 0 | 0.00% | 0.00% | 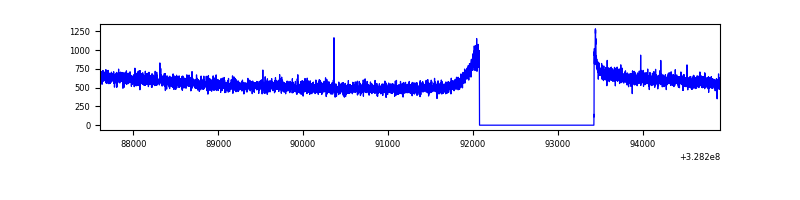 |
| B | 7304 | 5955 | 152 | 152 | 2.08% | 2.55% | 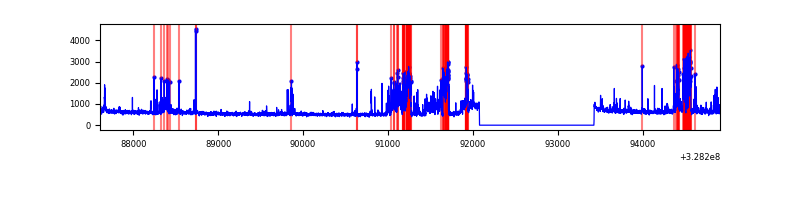 |
| C | 7304 | 5955 | 0 | 0 | 0.00% | 0.00% | 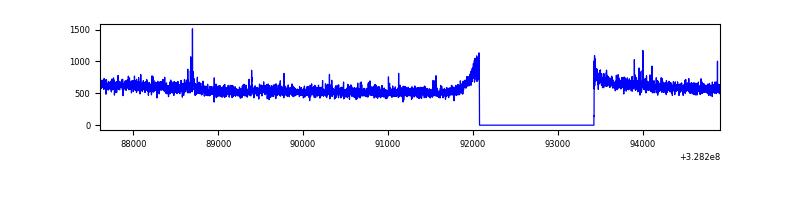 |
| D | 7304 | 5955 | 974 | 974 | 13.34% | 16.36% | 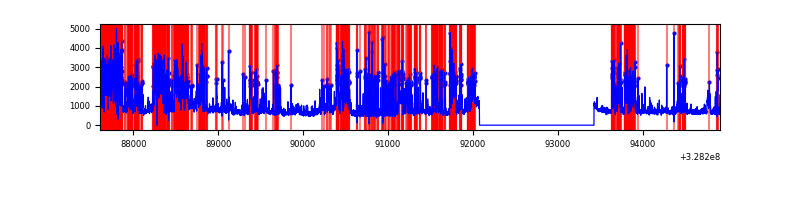 |
Top three noisy pixels from each quadrant. If the there are fewer than three noisy pixels in the level2.evt file, extra rows are filled as -1
| Pixel properties | Quadrant properties | ||||||
|---|---|---|---|---|---|---|---|
| Quadrant | DetID | PixID | Counts | Sigma | Mean | Median | Sigma |
| A | 13 | 254 | 9570 | 51.19 | 865 | 852 | 170.3 |
| A | 0 | 226 | 7600 | 39.62 | 865 | 852 | 170.3 |
| A | 3 | 137 | 6979 | 35.97 | 865 | 852 | 170.3 |
| B | 3 | 64 | 888146 | 5686.51 | 840 | 825 | 156.0 |
| B | 0 | 190 | 49286 | 310.57 | 840 | 825 | 156.0 |
| B | 0 | 229 | 30330 | 189.09 | 840 | 825 | 156.0 |
| C | 14 | 238 | 134255 | 704.24 | 821 | 830 | 189.5 |
| C | 7 | 247 | 48693 | 252.63 | 821 | 830 | 189.5 |
| C | 3 | 233 | 22748 | 115.69 | 821 | 830 | 189.5 |
| D | 1 | 52 | 1806739 | 9667.1 | 764 | 743 | 186.8 |
| D | 12 | 233 | 1031485 | 5517.33 | 764 | 743 | 186.8 |
| D | 10 | 70 | 593901 | 3175.04 | 764 | 743 | 186.8 |
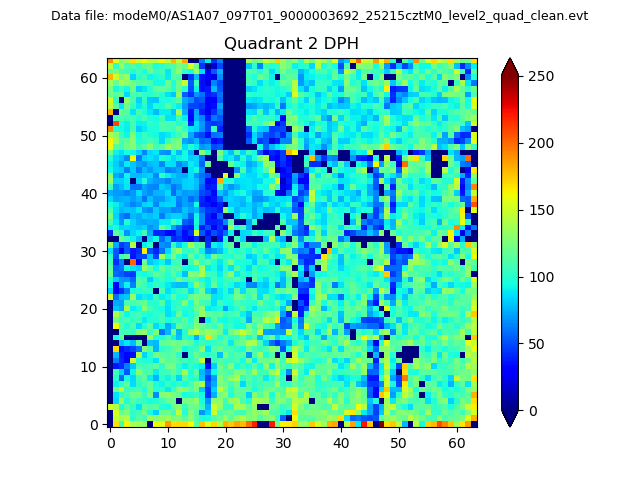
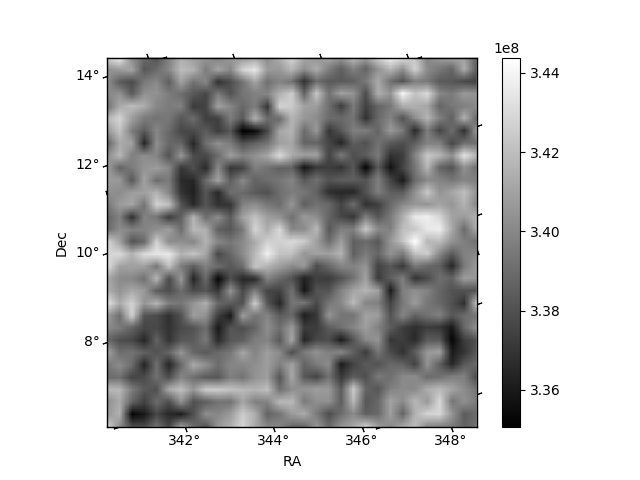
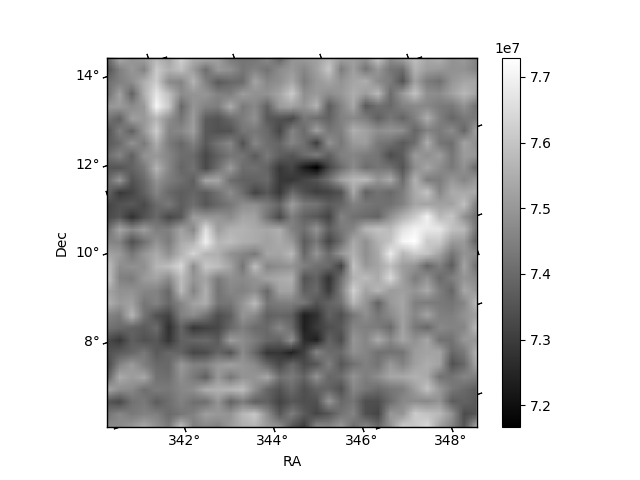
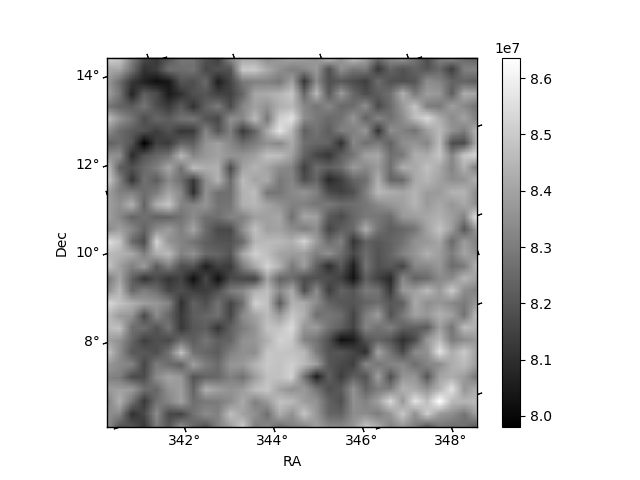
Histogram calculated using DETX and DETY for each event in the final _common_clean file
| Quadrant A | 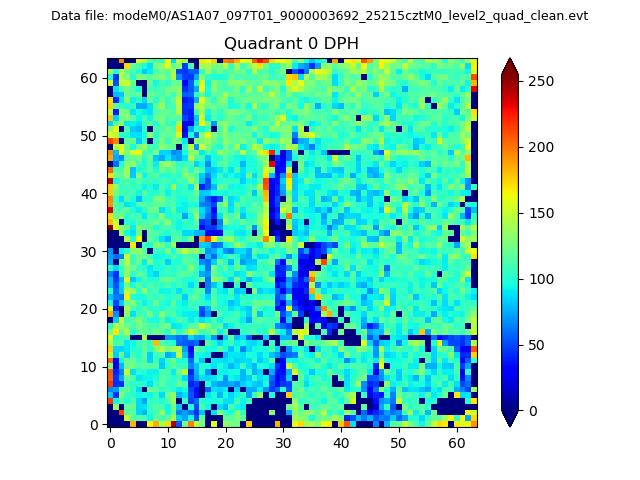 |
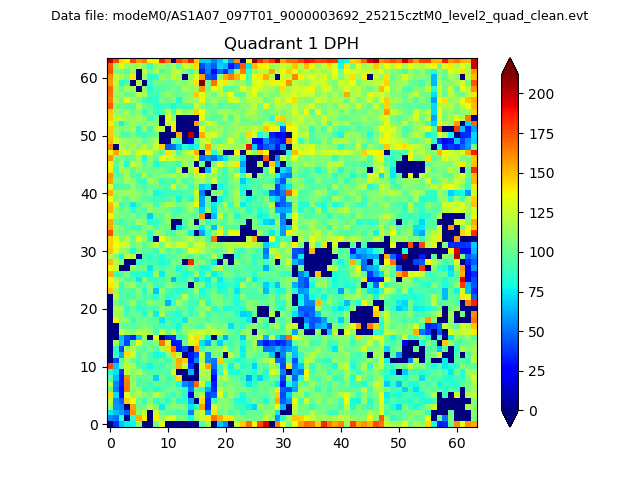 |
Quadrant B |
|---|---|---|---|
| Quadrant D | 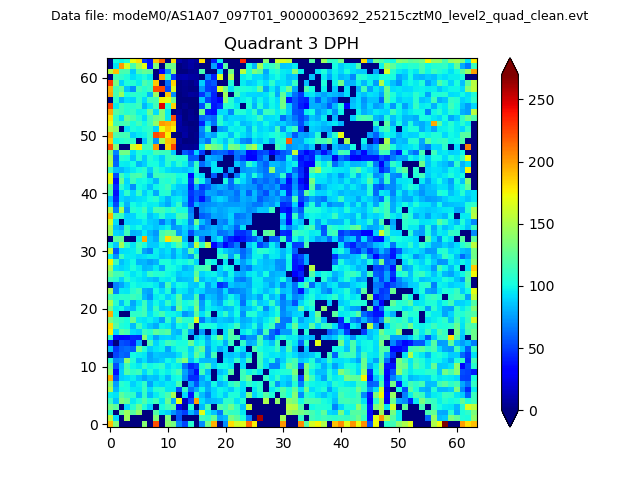 |
 |
Quadrant C |
| Plot type | Count rate plots | Images |
|---|---|---|
| Comparison with Poisson distribution Blue bars denote a histogram of data divided into 1 sec bins. Red curve is a Poisson curve with rate = median count rate of data. |
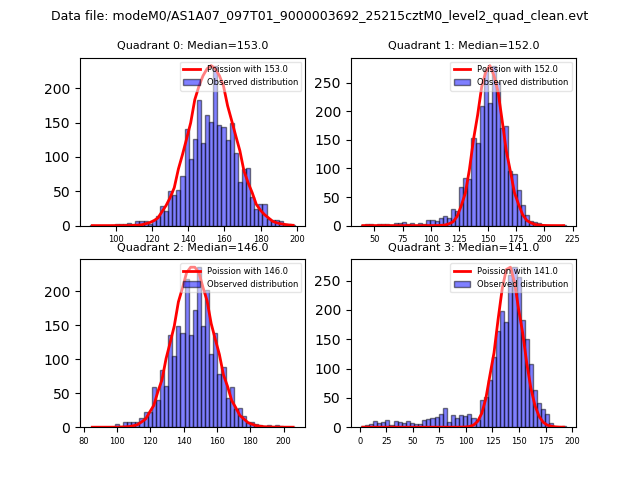 |
 |
| Quadrant-wise count rates Data is divided into 100 sec bins |
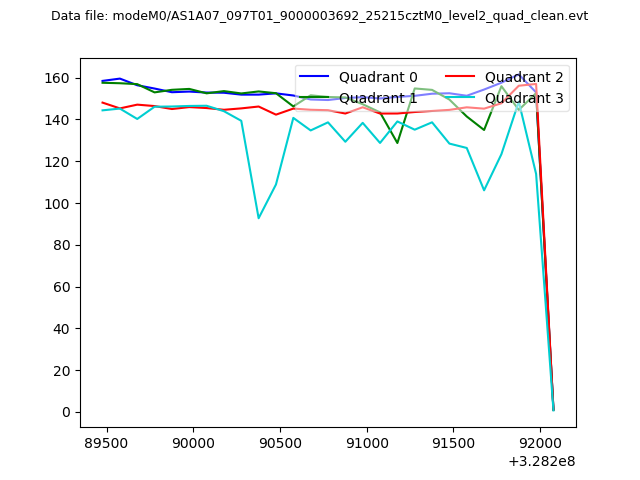 |
|
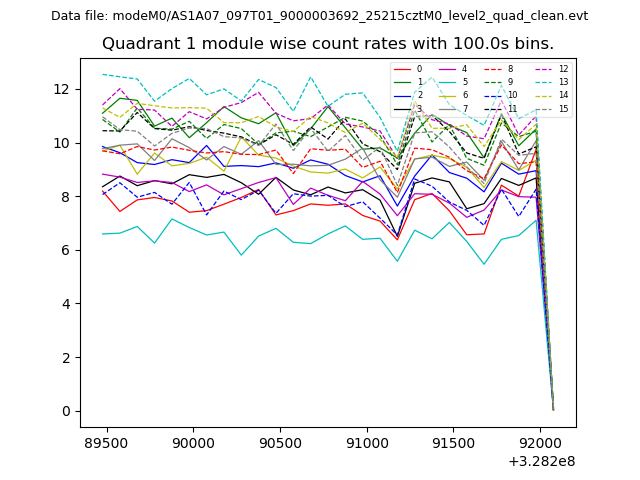
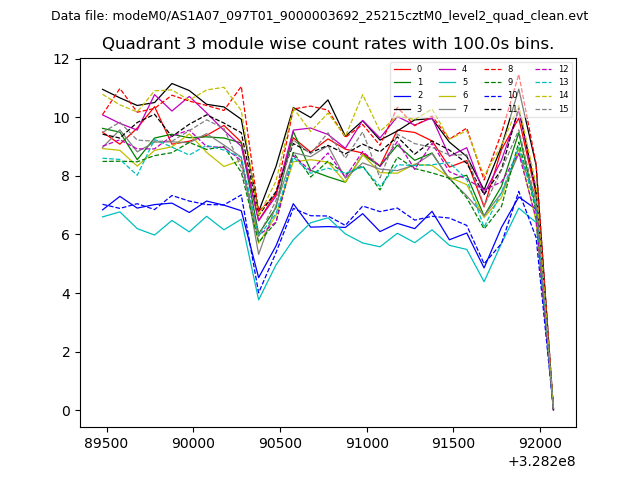
| Module-wise count rates for Quadrant A Data is divided into 100 sec bins |
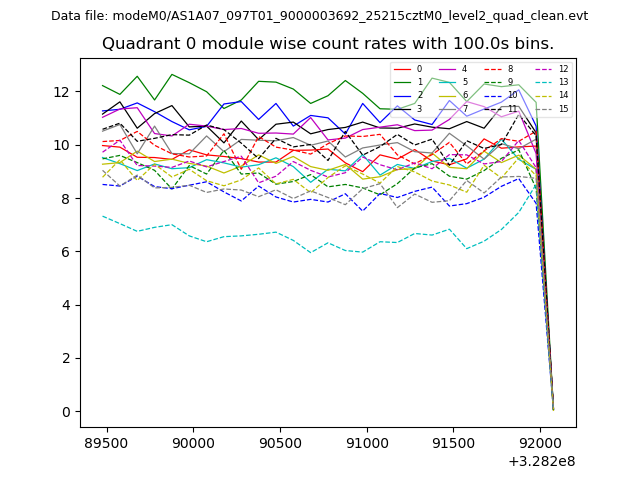 |
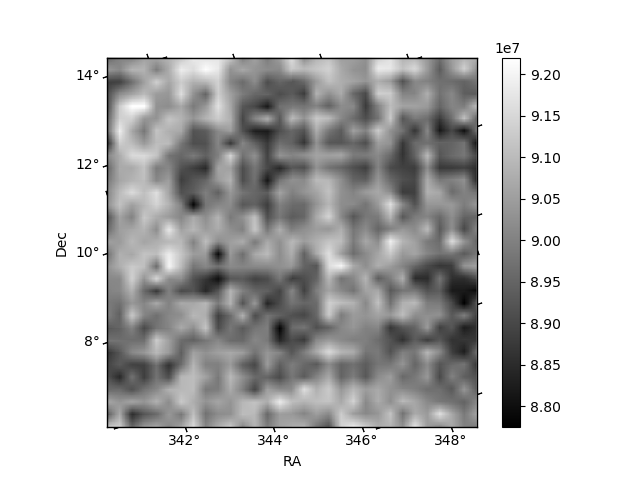 |
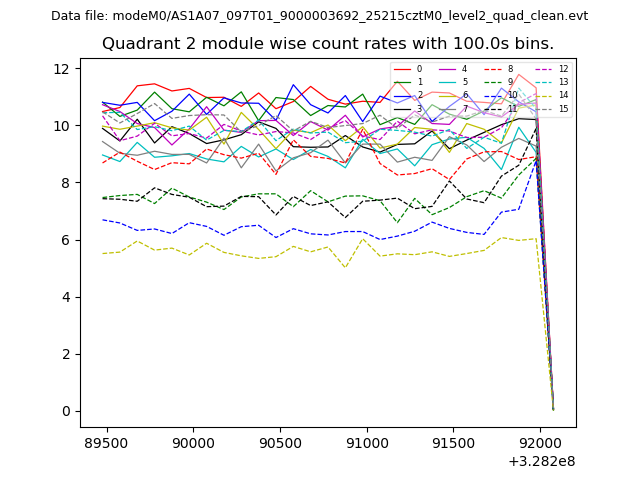
| Module-wise count rates for Quadrant B Data is divided into 100 sec bins |
 |
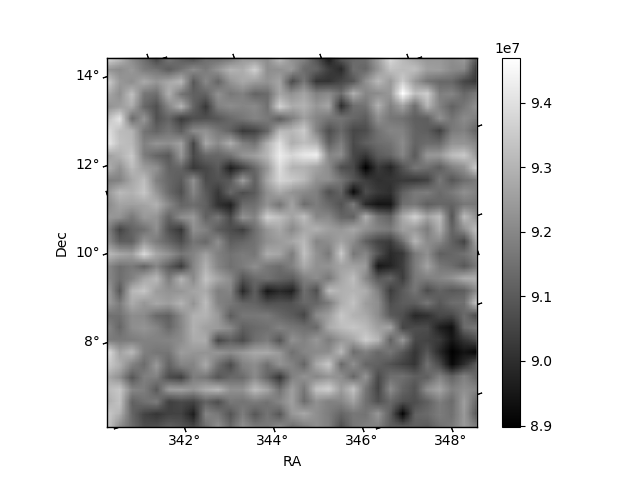 |
| Module-wise count rates for Quadrant C Data is divided into 100 sec bins |
 |
 |
| Module-wise count rates for Quadrant D Data is divided into 100 sec bins |
 |
 |
| Parameter | Plot |
|---|---|
| CZT HV Monitor | 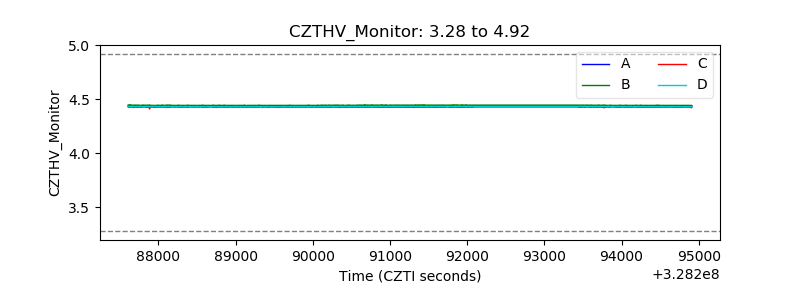 |
| D_VDD | 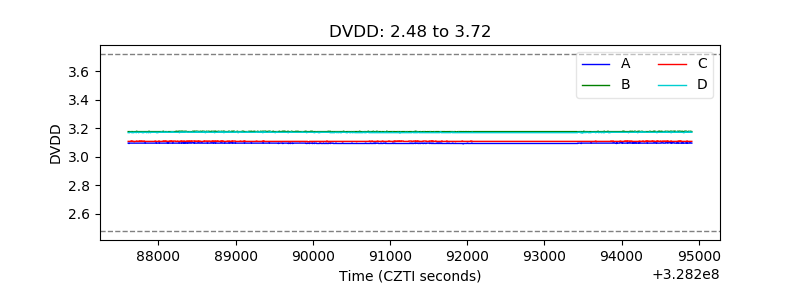 |
| Temperature 1 | 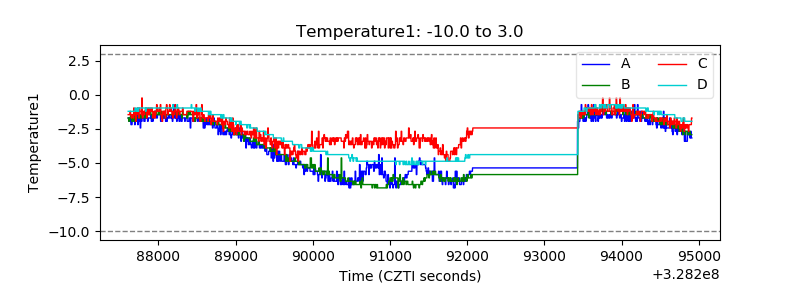 |
| Veto HV Monitor | 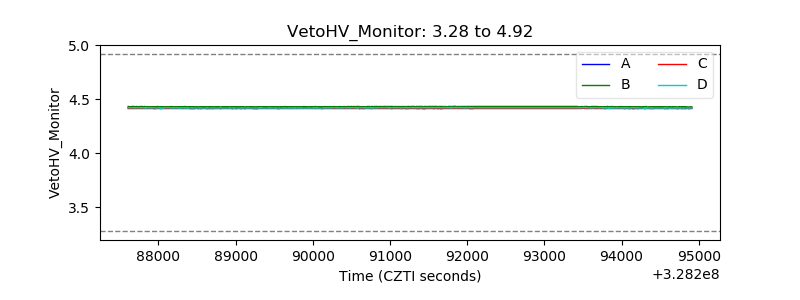 |
| Veto LLD | 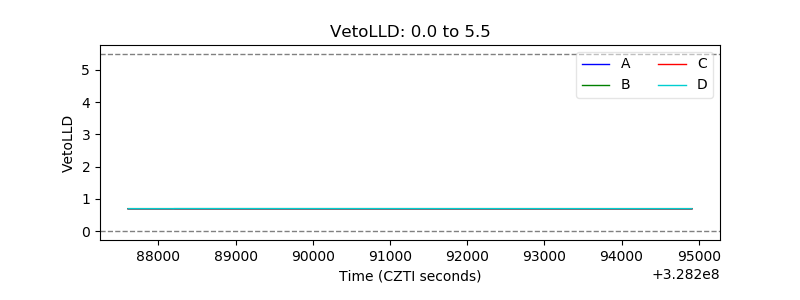 |
| Alpha Counter | 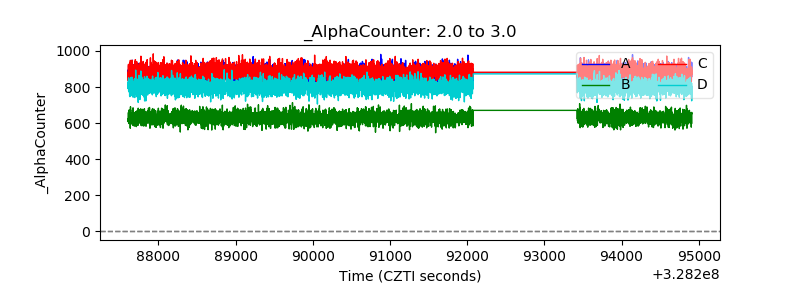 |
| _CPM_Rate | 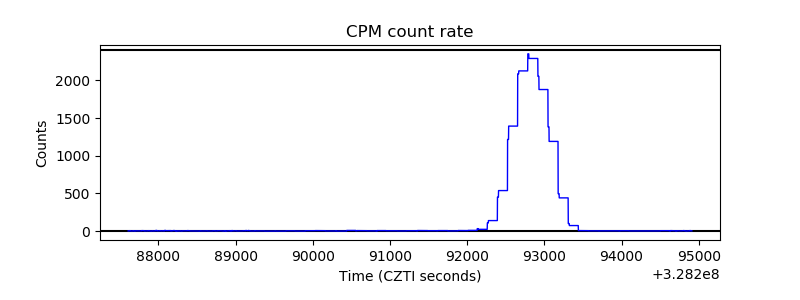 |
| CZT Counter | 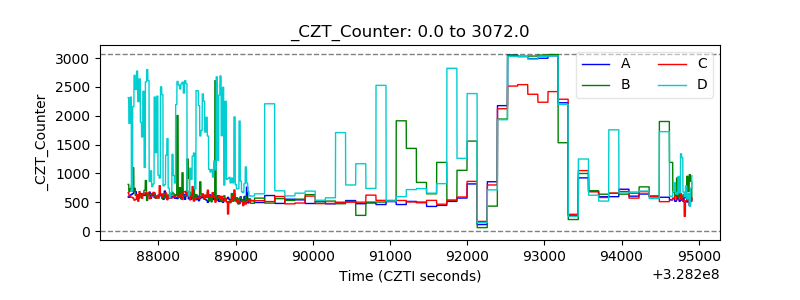 |
| +2.5 Volts monitor |  |
| +5 Volts monitor |  |
| _ROLL_ROT | 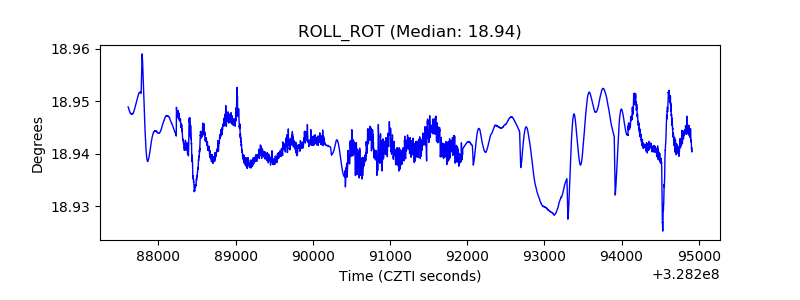 |
| _Roll_DEC | 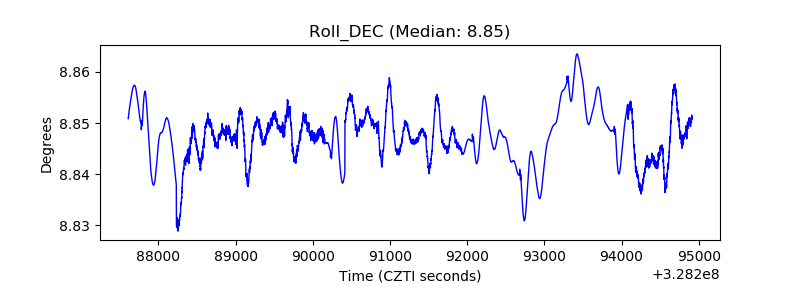 |
| _Roll_RA | 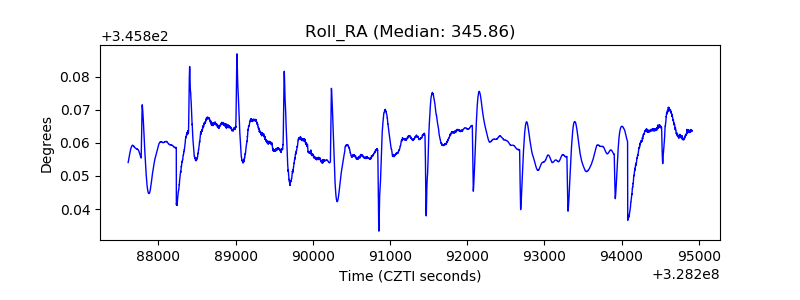 |
| Veto Counter | 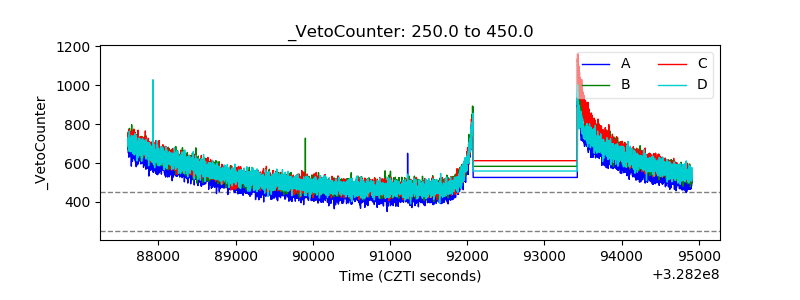 |