| Param | Original file | Final file |
|---|---|---|
| Filename | modeM0/AS1A07_097T01_9000003692_25216cztM0_level2.evt | modeM0/AS1A07_097T01_9000003692_25216cztM0_level2_quad_clean.evt |
| Size (bytes) | 560,479,680 | 73,546,560 |
| Size | 534.5 MB | 70.1 MB |
| Events in quadrant A | 3,431,439 | 461,644 |
| Events in quadrant B | 4,263,274 | 463,337 |
| Events in quadrant C | 3,534,738 | 442,186 |
| Events in quadrant D | 5,324,839 | 427,030 |
| Mode M0 | |||
|---|---|---|---|
| Quadrant | BADHDUFLAG | Total packets | Discarded packets |
| A | 0 | 14096 | 0 |
| B | 0 | 16806 | 0 |
| C | 0 | 14412 | 0 |
| D | 0 | 20372 | 0 |
| Mode M9 | |||
|---|---|---|---|
| Quadrant | BADHDUFLAG | Total packets | Discarded packets |
| A | 0 | 15 | 0 |
| B | 0 | 16 | 0 |
| C | 0 | 16 | 0 |
| D | 0 | 16 | 0 |
| Quadrant | Total seconds | Saturated seconds | Saturation percentage |
|---|---|---|---|
| A | 6190 | 107 | 1.728595% |
| B | 6190 | 380 | 6.138934% |
| C | 6190 | 159 | 2.568659% |
| D | 6190 | 545 | 8.804523% |
Noise dominated data is calculated using 1-second bins in cleaned event files. If a bin has >2000 counts, and if more than 50% of those come from <1% of pixels, then it is considered to be noise-dominated and hence unusable.
| Quadrant | # 1 sec bins | Bins with >0 counts | Bins with >2000 counts | High rate bins dominated by noise | Noise dominated (total time) | Noise dominated (detector-on time) | Marked lightcurve |
|---|---|---|---|---|---|---|---|
| A | 7460 | 6191 | 0 | 0 | 0.00% | 0.00% | 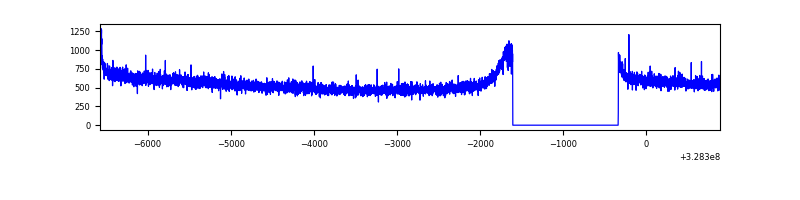 |
| B | 7460 | 6191 | 156 | 156 | 2.09% | 2.52% | 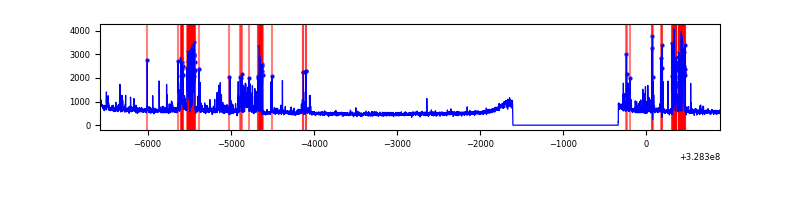 |
| C | 7460 | 6191 | 0 | 0 | 0.00% | 0.00% | 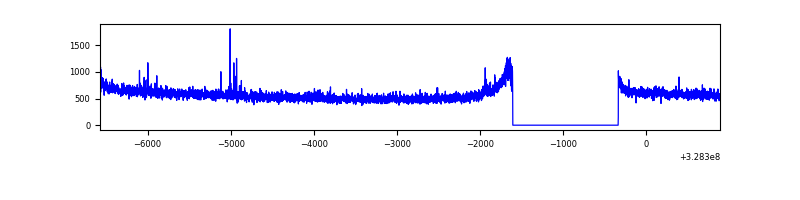 |
| D | 7460 | 6191 | 325 | 325 | 4.36% | 5.25% | 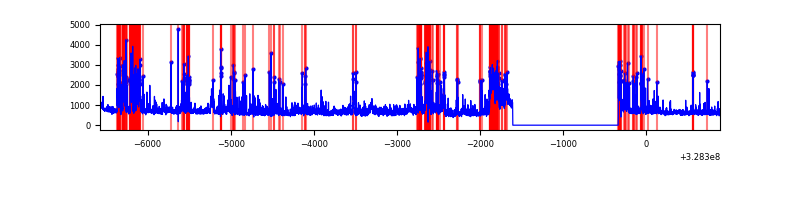 |
Top three noisy pixels from each quadrant. If the there are fewer than three noisy pixels in the level2.evt file, extra rows are filled as -1
| Pixel properties | Quadrant properties | ||||||
|---|---|---|---|---|---|---|---|
| Quadrant | DetID | PixID | Counts | Sigma | Mean | Median | Sigma |
| A | 13 | 254 | 10735 | 55.95 | 889 | 874 | 176.2 |
| A | 0 | 226 | 7599 | 38.16 | 889 | 874 | 176.2 |
| A | 3 | 137 | 7487 | 37.52 | 889 | 874 | 176.2 |
| B | 3 | 64 | 806122 | 4940.91 | 863 | 844 | 163.0 |
| B | 0 | 190 | 28478 | 169.55 | 863 | 844 | 163.0 |
| B | 0 | 229 | 24253 | 143.63 | 863 | 844 | 163.0 |
| C | 14 | 238 | 137635 | 693.49 | 849 | 857 | 197.2 |
| C | 7 | 247 | 45405 | 225.87 | 849 | 857 | 197.2 |
| C | 2 | 16 | 25285 | 123.85 | 849 | 857 | 197.2 |
| D | 10 | 70 | 730170 | 3308.0 | 835 | 818 | 220.5 |
| D | 8 | 195 | 537938 | 2436.13 | 835 | 818 | 220.5 |
| D | 1 | 52 | 370870 | 1678.38 | 835 | 818 | 220.5 |
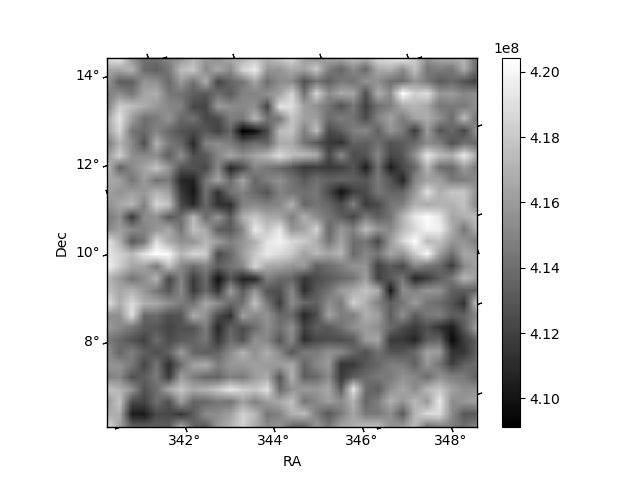
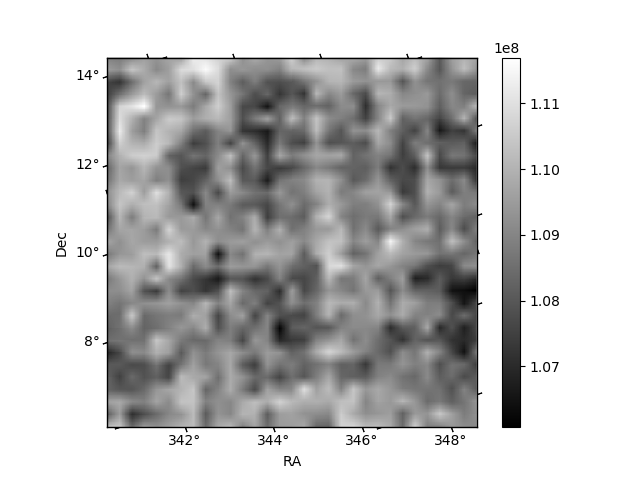
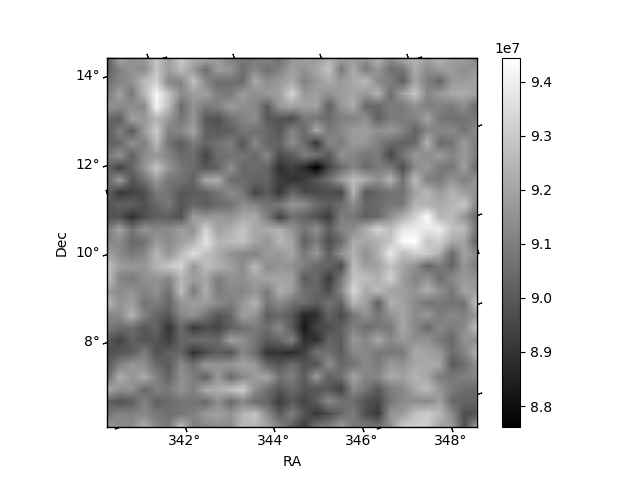
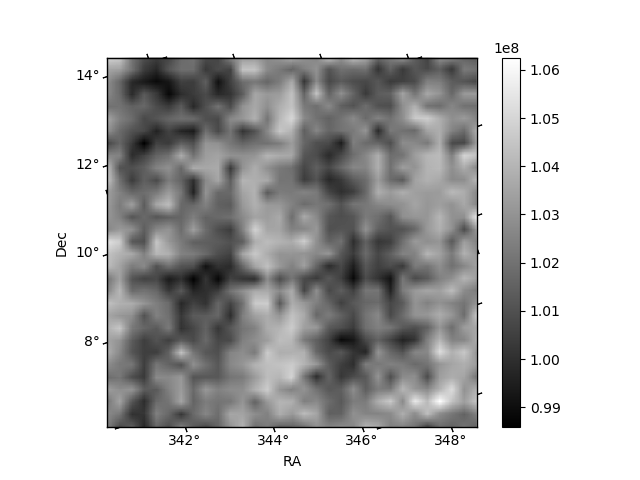
Histogram calculated using DETX and DETY for each event in the final _common_clean file
| Quadrant A | 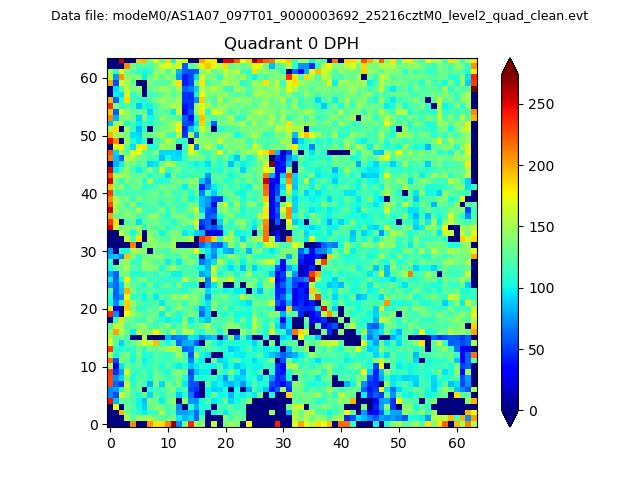 |
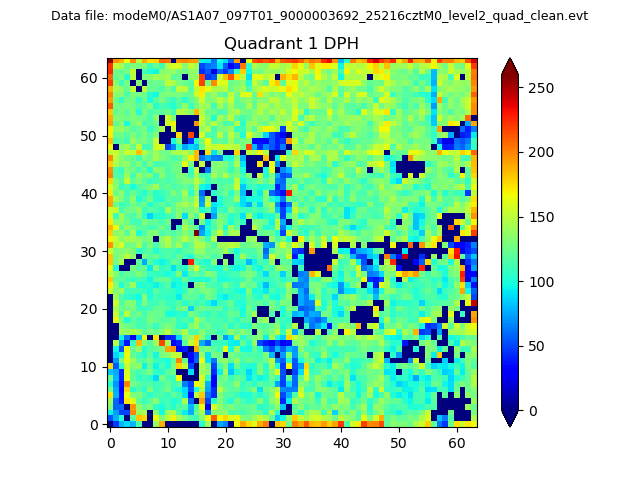 |
Quadrant B |
|---|---|---|---|
| Quadrant D | 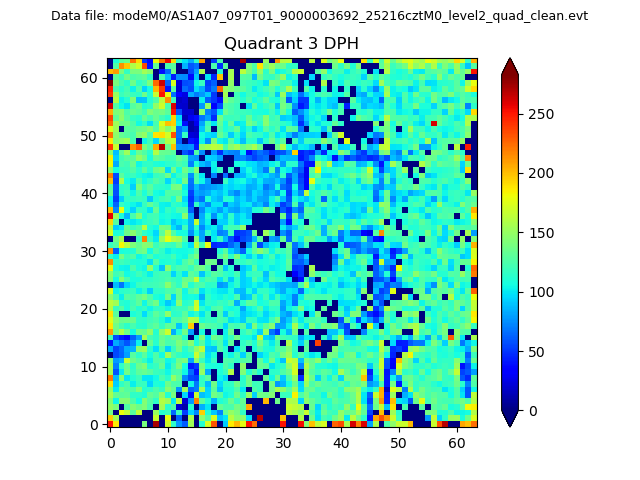 |
 |
Quadrant C |
| Plot type | Count rate plots | Images |
|---|---|---|
| Comparison with Poisson distribution Blue bars denote a histogram of data divided into 1 sec bins. Red curve is a Poisson curve with rate = median count rate of data. |
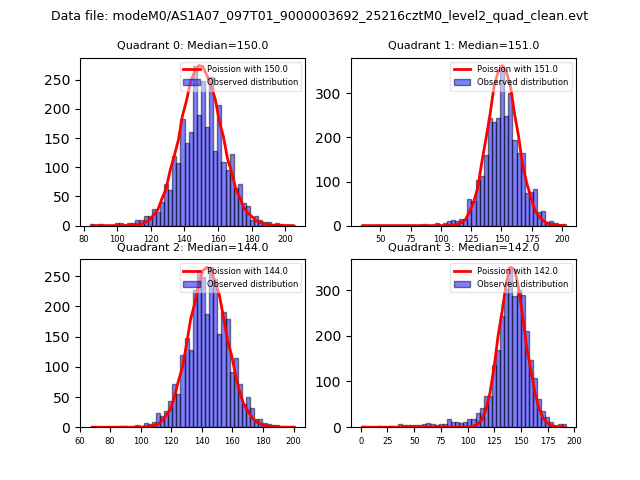 |
 |
| Quadrant-wise count rates Data is divided into 100 sec bins |
 |
|
| Module-wise count rates for Quadrant A Data is divided into 100 sec bins |
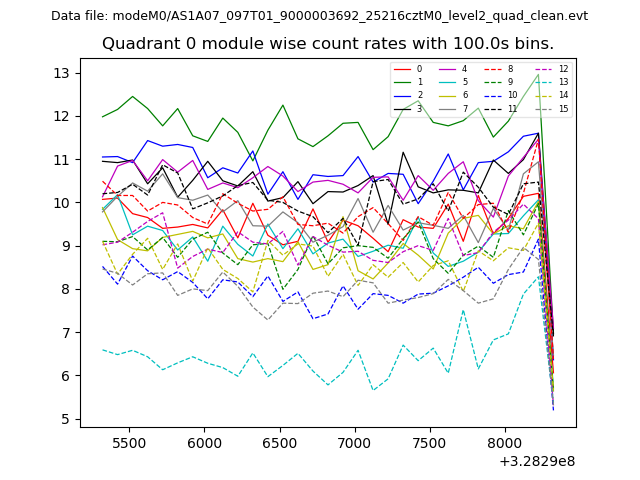 |
 |
| Module-wise count rates for Quadrant B Data is divided into 100 sec bins |
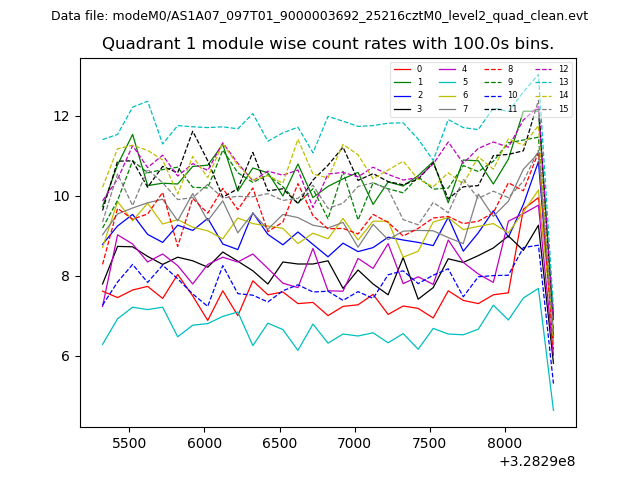 |
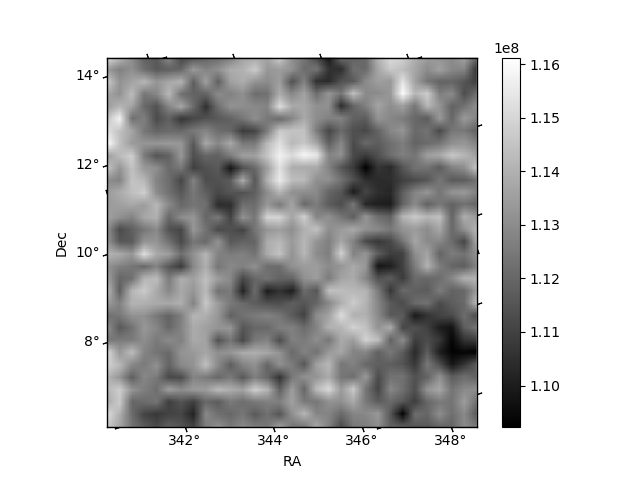 |
| Module-wise count rates for Quadrant C Data is divided into 100 sec bins |
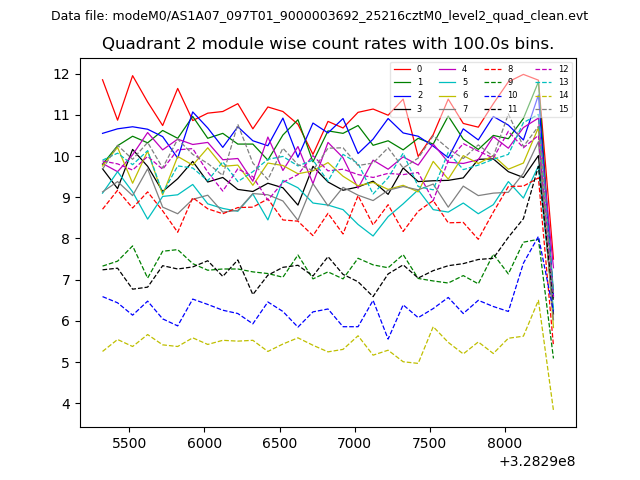 |
 |
| Module-wise count rates for Quadrant D Data is divided into 100 sec bins |
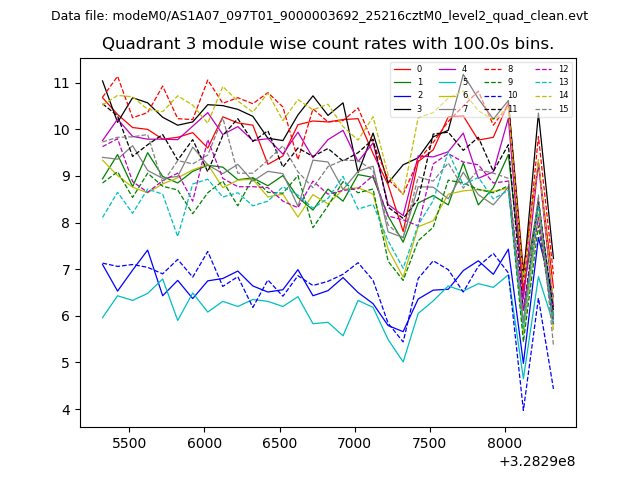 |
 |
| Parameter | Plot |
|---|---|
| CZT HV Monitor | 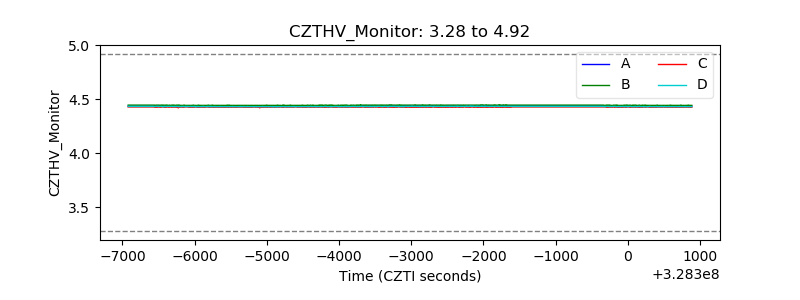 |
| D_VDD | 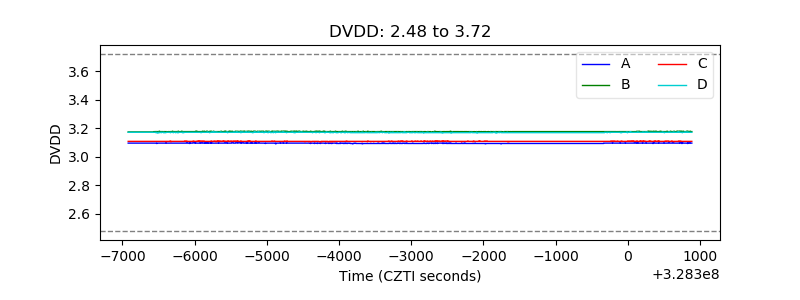 |
| Temperature 1 | 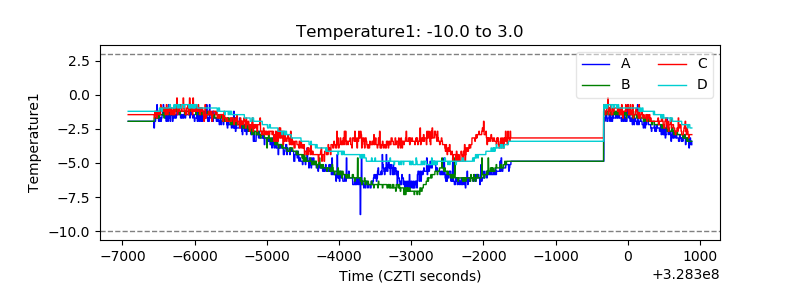 |
| Veto HV Monitor | 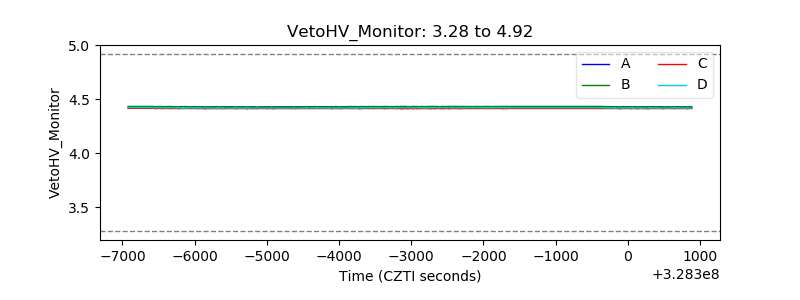 |
| Veto LLD | 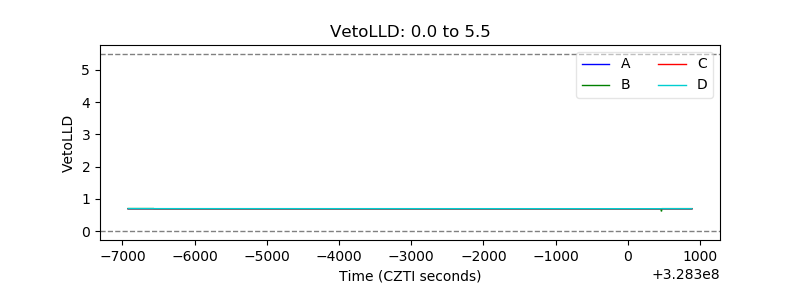 |
| Alpha Counter | 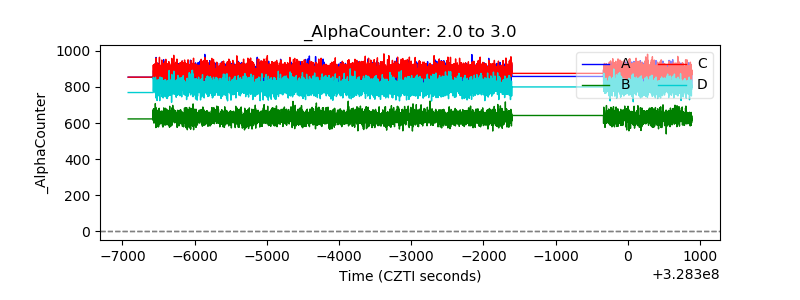 |
| _CPM_Rate |  |
| CZT Counter |  |
| +2.5 Volts monitor |  |
| +5 Volts monitor |  |
| _ROLL_ROT | 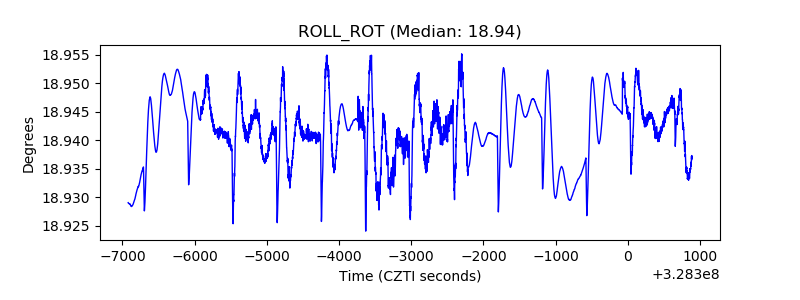 |
| _Roll_DEC | 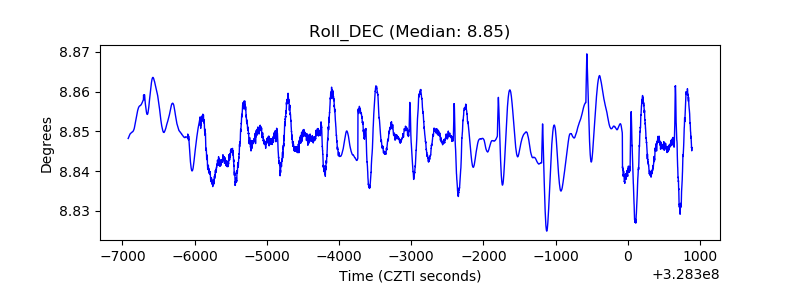 |
| _Roll_RA | 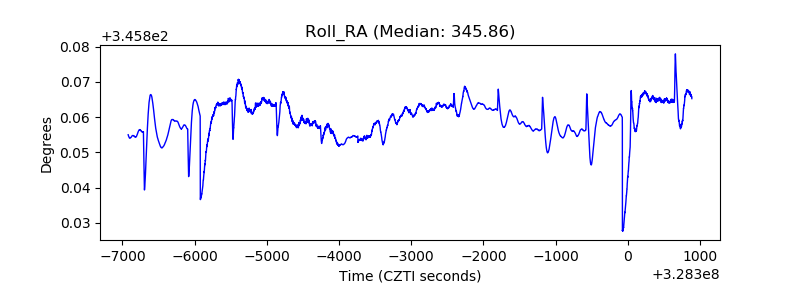 |
| Veto Counter | 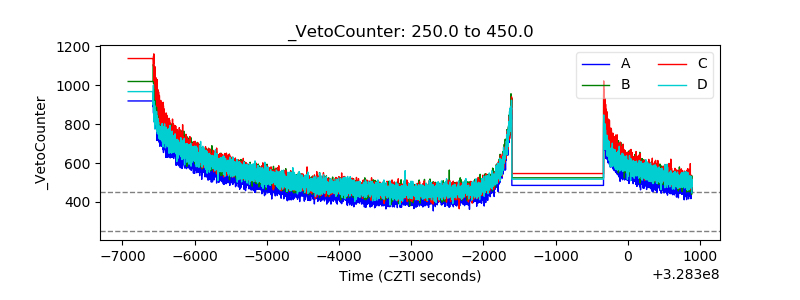 |