| Param | Original file | Final file |
|---|---|---|
| Filename | modeM0/AS1A07_097T01_9000003692_25218cztM0_level2.evt | modeM0/AS1A07_097T01_9000003692_25218cztM0_level2_quad_clean.evt |
| Size (bytes) | 653,126,400 | 91,103,040 |
| Size | 622.9 MB | 86.9 MB |
| Events in quadrant A | 3,621,796 | 603,364 |
| Events in quadrant B | 6,500,031 | 495,883 |
| Events in quadrant C | 3,740,464 | 583,918 |
| Events in quadrant D | 5,429,055 | 573,031 |
| Mode M0 | |||
|---|---|---|---|
| Quadrant | BADHDUFLAG | Total packets | Discarded packets |
| A | 0 | 15229 | 0 |
| B | 0 | 24034 | 0 |
| C | 0 | 15433 | 0 |
| D | 0 | 20954 | 0 |
| Mode M9 | |||
|---|---|---|---|
| Quadrant | BADHDUFLAG | Total packets | Discarded packets |
| A | 0 | 18 | 0 |
| B | 0 | 18 | 0 |
| C | 0 | 18 | 0 |
| D | 0 | 18 | 0 |
| Quadrant | Total seconds | Saturated seconds | Saturation percentage |
|---|---|---|---|
| A | 7213 | 86 | 1.192292% |
| B | 7214 | 1369 | 18.976989% |
| C | 7214 | 150 | 2.079290% |
| D | 7214 | 435 | 6.029942% |
Noise dominated data is calculated using 1-second bins in cleaned event files. If a bin has >2000 counts, and if more than 50% of those come from <1% of pixels, then it is considered to be noise-dominated and hence unusable.
| Quadrant | # 1 sec bins | Bins with >0 counts | Bins with >2000 counts | High rate bins dominated by noise | Noise dominated (total time) | Noise dominated (detector-on time) | Marked lightcurve |
|---|---|---|---|---|---|---|---|
| A | 9013 | 7215 | 0 | 0 | 0.00% | 0.00% | 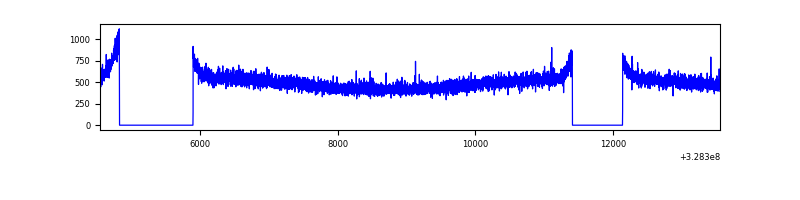 |
| B | 9014 | 7215 | 853 | 853 | 9.46% | 11.82% | 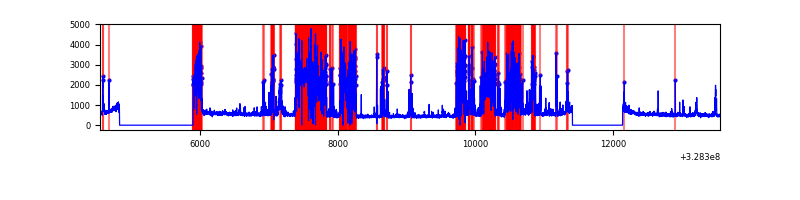 |
| C | 9014 | 7216 | 0 | 0 | 0.00% | 0.00% | 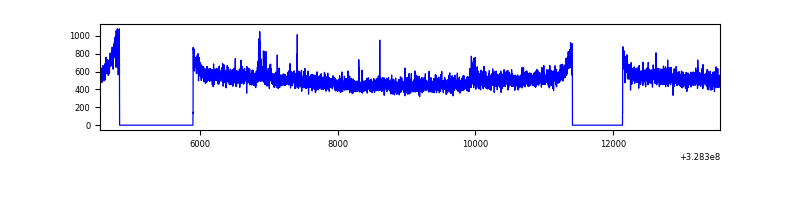 |
| D | 9014 | 7216 | 246 | 246 | 2.73% | 3.41% | 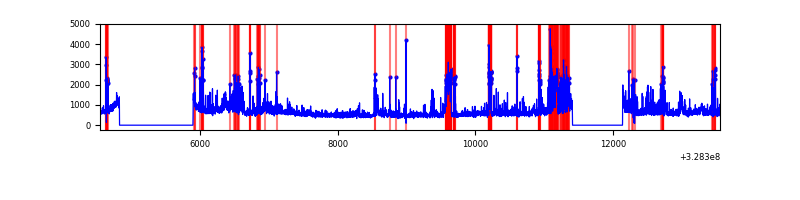 |
Top three noisy pixels from each quadrant. If the there are fewer than three noisy pixels in the level2.evt file, extra rows are filled as -1
| Pixel properties | Quadrant properties | ||||||
|---|---|---|---|---|---|---|---|
| Quadrant | DetID | PixID | Counts | Sigma | Mean | Median | Sigma |
| A | 13 | 254 | 11913 | 57.81 | 939 | 919 | 190.2 |
| A | 3 | 137 | 8672 | 40.77 | 939 | 919 | 190.2 |
| A | 0 | 226 | 8150 | 38.02 | 939 | 919 | 190.2 |
| B | 3 | 64 | 3141147 | 19846.99 | 825 | 806 | 158.2 |
| B | 7 | 219 | 47656 | 296.09 | 825 | 806 | 158.2 |
| B | 0 | 190 | 25897 | 158.58 | 825 | 806 | 158.2 |
| C | 14 | 238 | 142591 | 667.67 | 901 | 905 | 212.2 |
| C | 7 | 247 | 41942 | 193.38 | 901 | 905 | 212.2 |
| C | 2 | 16 | 28680 | 130.89 | 901 | 905 | 212.2 |
| D | 8 | 195 | 512756 | 2195.25 | 896 | 875 | 233.2 |
| D | 10 | 70 | 485489 | 2078.31 | 896 | 875 | 233.2 |
| D | 1 | 52 | 439158 | 1879.62 | 896 | 875 | 233.2 |
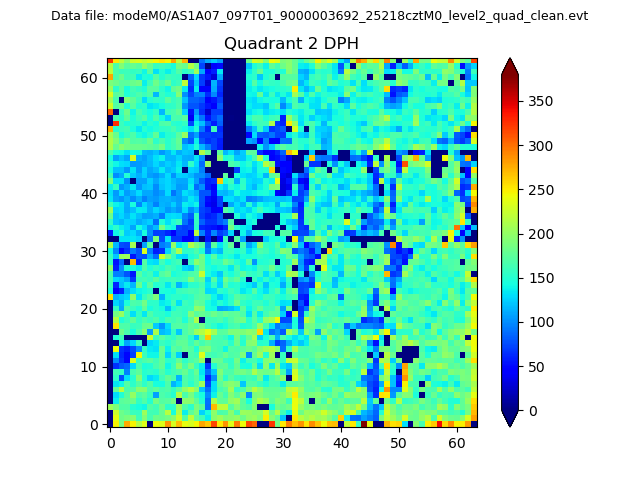
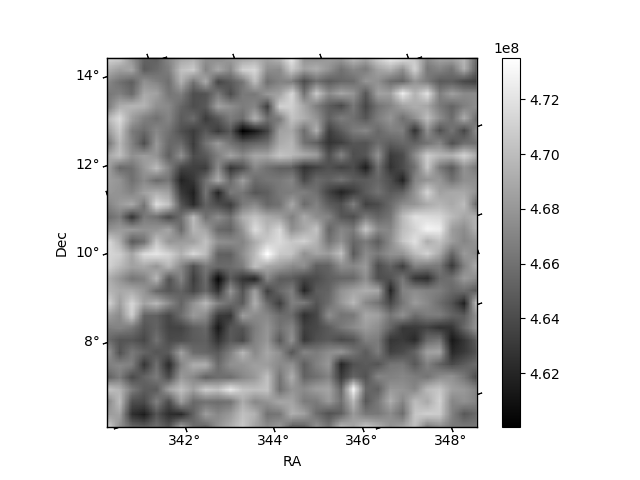
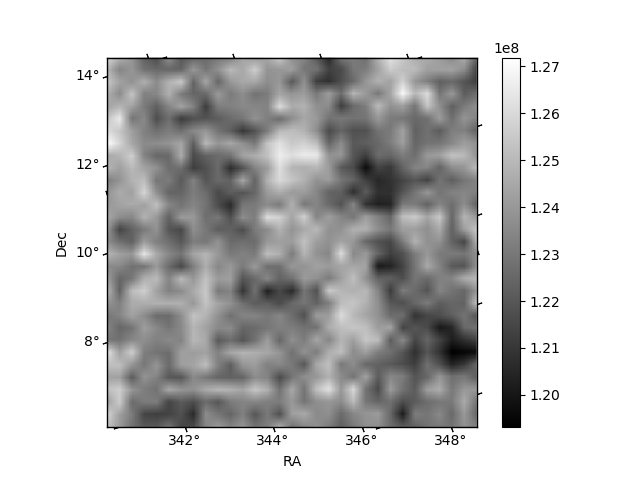
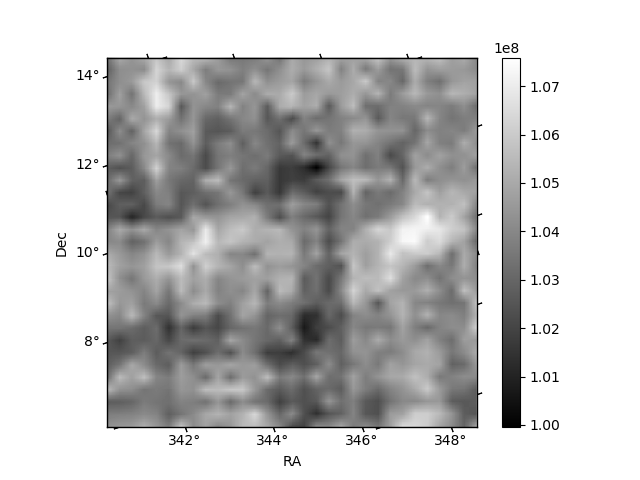
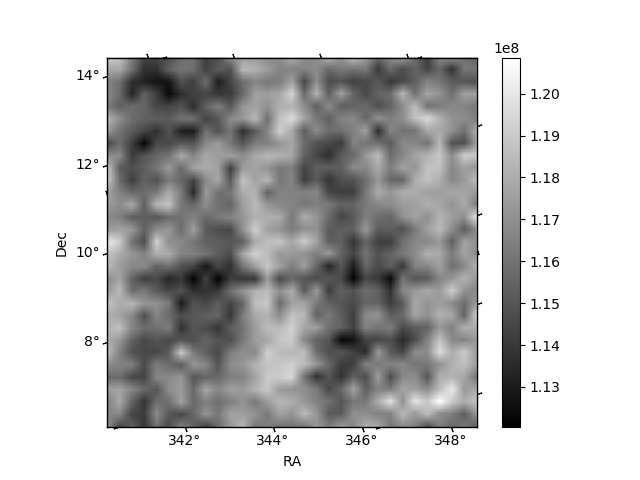
Histogram calculated using DETX and DETY for each event in the final _common_clean file
| Quadrant A | 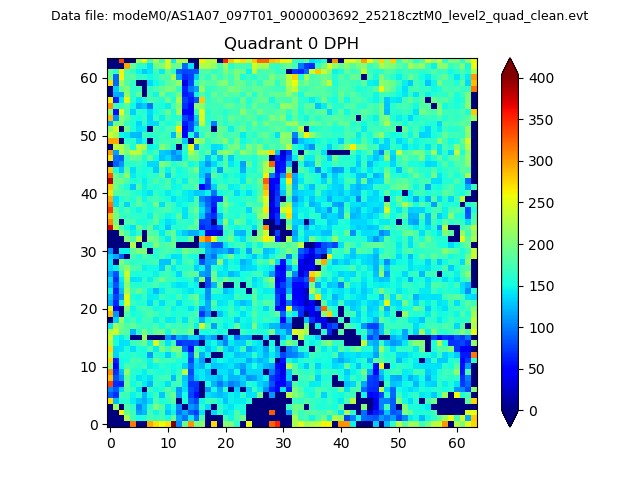 |
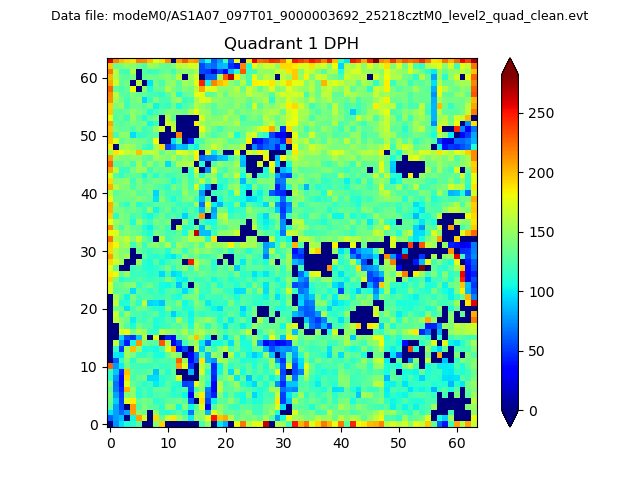 |
Quadrant B |
|---|---|---|---|
| Quadrant D | 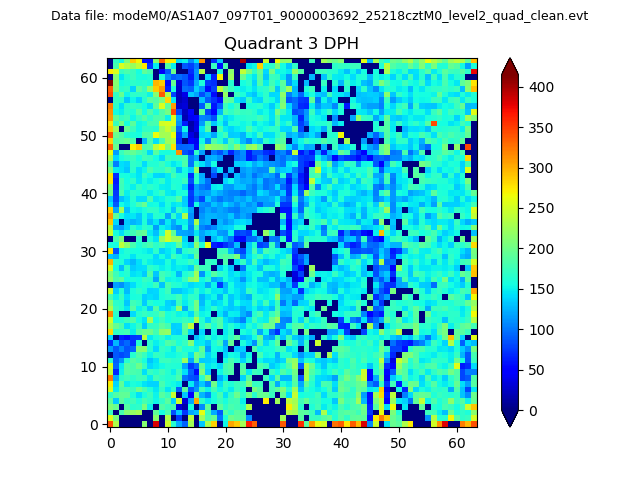 |
 |
Quadrant C |
| Plot type | Count rate plots | Images |
|---|---|---|
| Comparison with Poisson distribution Blue bars denote a histogram of data divided into 1 sec bins. Red curve is a Poisson curve with rate = median count rate of data. |
 |
 |
| Quadrant-wise count rates Data is divided into 100 sec bins |
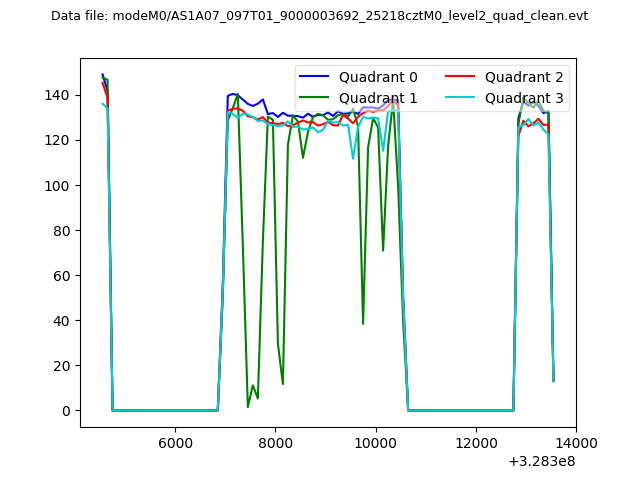 |
|
| Module-wise count rates for Quadrant A Data is divided into 100 sec bins |
 |
 |
| Module-wise count rates for Quadrant B Data is divided into 100 sec bins |
 |
 |
| Module-wise count rates for Quadrant C Data is divided into 100 sec bins |
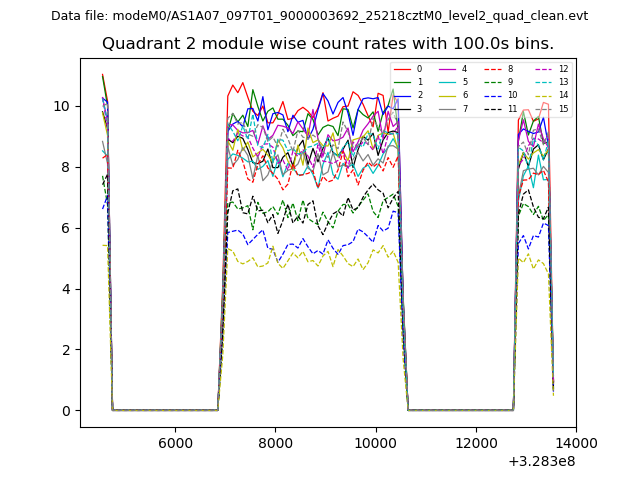 |
 |
| Module-wise count rates for Quadrant D Data is divided into 100 sec bins |
 |
 |
| Parameter | Plot |
|---|---|
| CZT HV Monitor | 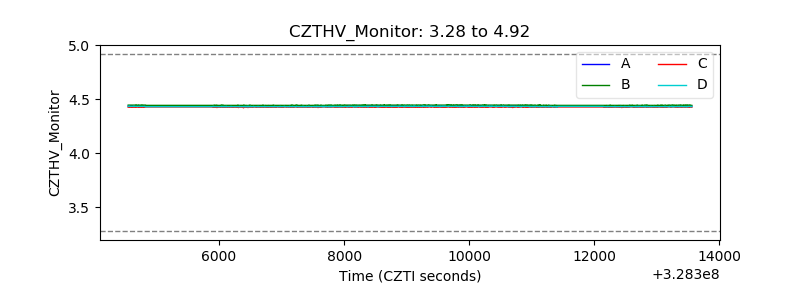 |
| D_VDD | 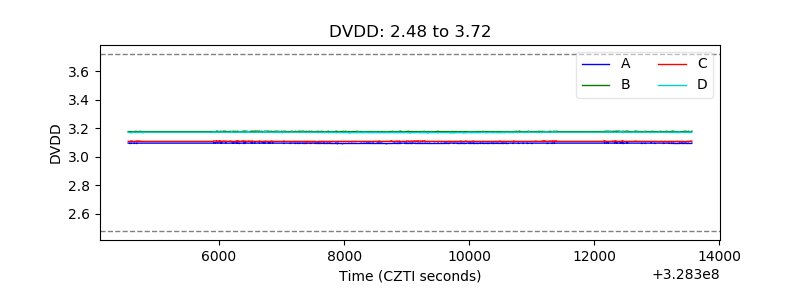 |
| Temperature 1 |  |
| Veto HV Monitor | 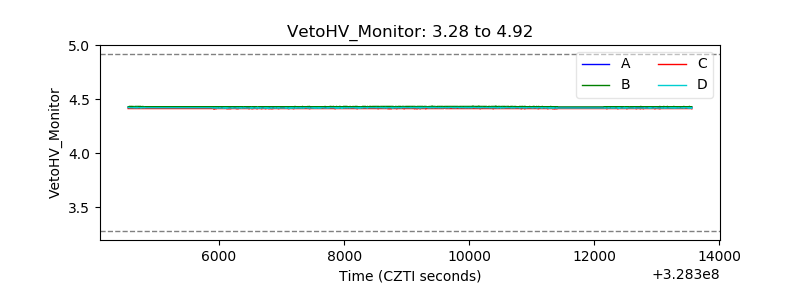 |
| Veto LLD | 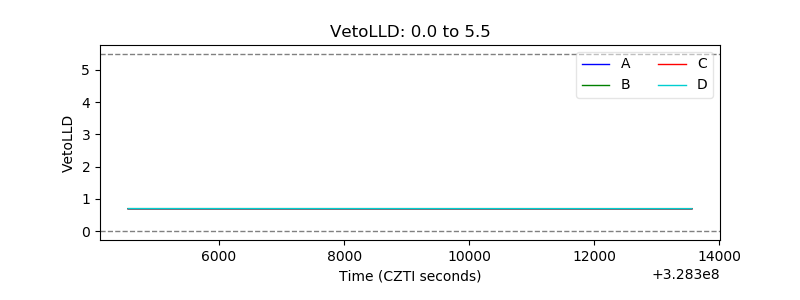 |
| Alpha Counter | 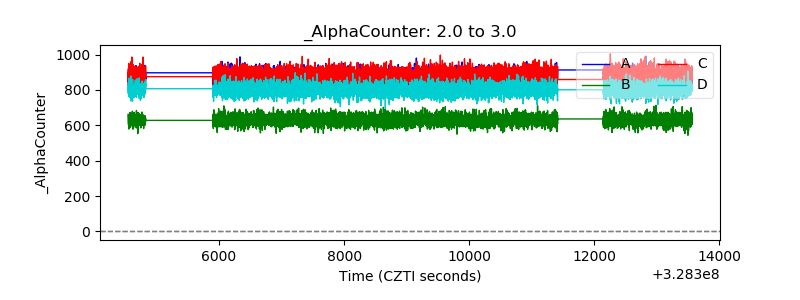 |
| _CPM_Rate | 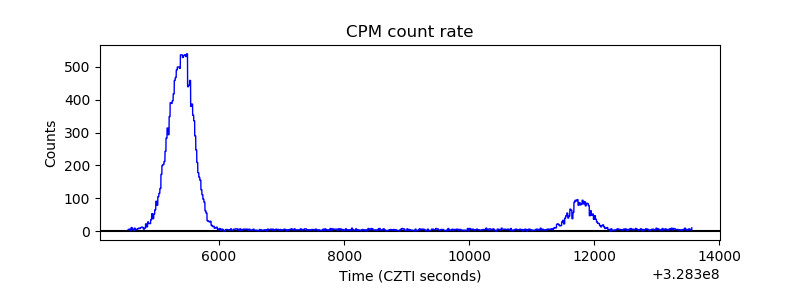 |
| CZT Counter | 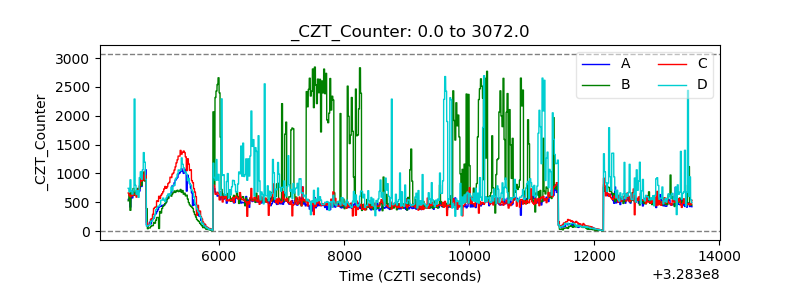 |
| +2.5 Volts monitor |  |
| +5 Volts monitor |  |
| _ROLL_ROT |  |
| _Roll_DEC |  |
| _Roll_RA | 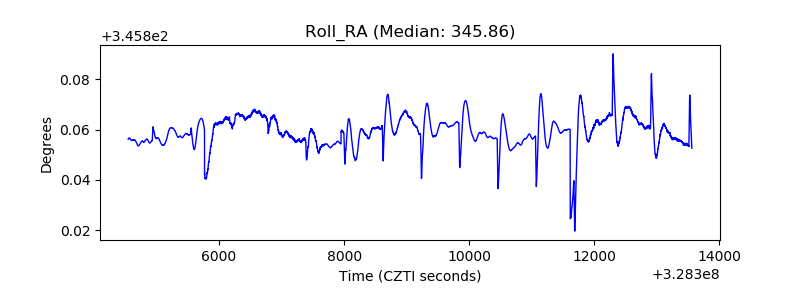 |
| Veto Counter |  |