| Param | Original file | Final file |
|---|---|---|
| Filename | modeM0/AS1A07_097T01_9000003692_25220cztM0_level2.evt | modeM0/AS1A07_097T01_9000003692_25220cztM0_level2_quad_clean.evt |
| Size (bytes) | 1,129,884,480 | 171,368,640 |
| Size | 1.1 GB | 163.4 MB |
| Events in quadrant A | 6,488,190 | 1,108,006 |
| Events in quadrant B | 9,736,244 | 1,040,858 |
| Events in quadrant C | 7,058,525 | 1,071,253 |
| Events in quadrant D | 10,031,454 | 1,044,937 |
| Mode M0 | |||
|---|---|---|---|
| Quadrant | BADHDUFLAG | Total packets | Discarded packets |
| A | 0 | 27887 | 0 |
| B | 0 | 37914 | 0 |
| C | 0 | 29439 | 0 |
| D | 0 | 38883 | 0 |
| Mode M9 | |||
|---|---|---|---|
| Quadrant | BADHDUFLAG | Total packets | Discarded packets |
| A | 0 | 10 | 0 |
| B | 0 | 11 | 0 |
| C | 0 | 11 | 0 |
| D | 0 | 11 | 0 |
| Quadrant | Total seconds | Saturated seconds | Saturation percentage |
|---|---|---|---|
| A | 13384 | 140 | 1.046025% |
| B | 13384 | 1790 | 13.374178% |
| C | 13384 | 285 | 2.129408% |
| D | 13384 | 713 | 5.327256% |
Noise dominated data is calculated using 1-second bins in cleaned event files. If a bin has >2000 counts, and if more than 50% of those come from <1% of pixels, then it is considered to be noise-dominated and hence unusable.
| Quadrant | # 1 sec bins | Bins with >0 counts | Bins with >2000 counts | High rate bins dominated by noise | Noise dominated (total time) | Noise dominated (detector-on time) | Marked lightcurve |
|---|---|---|---|---|---|---|---|
| A | 13979 | 13387 | 0 | 0 | 0.00% | 0.00% | 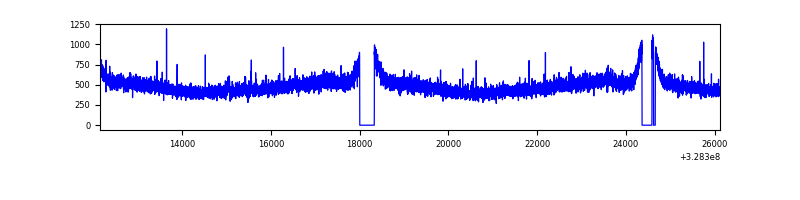 |
| B | 13979 | 13386 | 886 | 886 | 6.34% | 6.62% | 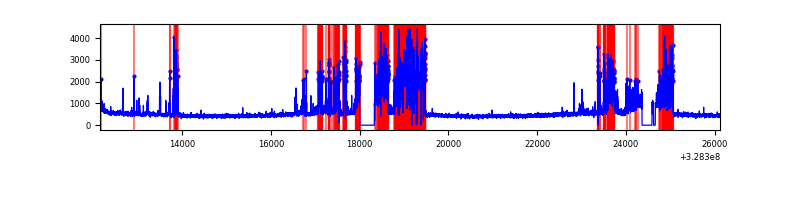 |
| C | 13979 | 13387 | 1 | 1 | 0.01% | 0.01% | 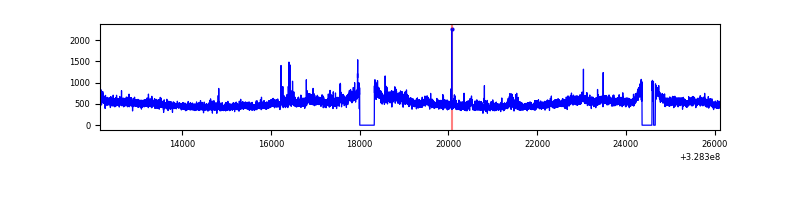 |
| D | 13979 | 13387 | 421 | 421 | 3.01% | 3.14% | 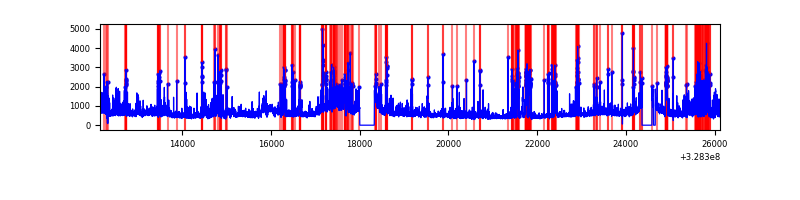 |
Top three noisy pixels from each quadrant. If the there are fewer than three noisy pixels in the level2.evt file, extra rows are filled as -1
| Pixel properties | Quadrant properties | ||||||
|---|---|---|---|---|---|---|---|
| Quadrant | DetID | PixID | Counts | Sigma | Mean | Median | Sigma |
| A | 13 | 254 | 20670 | 55.93 | 1680 | 1644 | 340.2 |
| A | 3 | 137 | 15526 | 40.81 | 1680 | 1644 | 340.2 |
| A | 0 | 226 | 14292 | 37.18 | 1680 | 1644 | 340.2 |
| B | 3 | 64 | 3578461 | 12174.07 | 1547 | 1510 | 293.8 |
| B | 0 | 190 | 62227 | 206.65 | 1547 | 1510 | 293.8 |
| B | 12 | 111 | 36977 | 120.71 | 1547 | 1510 | 293.8 |
| C | 7 | 247 | 444397 | 1172.37 | 1604 | 1619 | 377.7 |
| C | 14 | 238 | 253587 | 667.15 | 1604 | 1619 | 377.7 |
| C | 2 | 16 | 75329 | 195.17 | 1604 | 1619 | 377.7 |
| D | 1 | 52 | 1205551 | 2828.97 | 1589 | 1558 | 425.6 |
| D | 10 | 70 | 1036556 | 2431.89 | 1589 | 1558 | 425.6 |
| D | 8 | 195 | 631221 | 1479.49 | 1589 | 1558 | 425.6 |
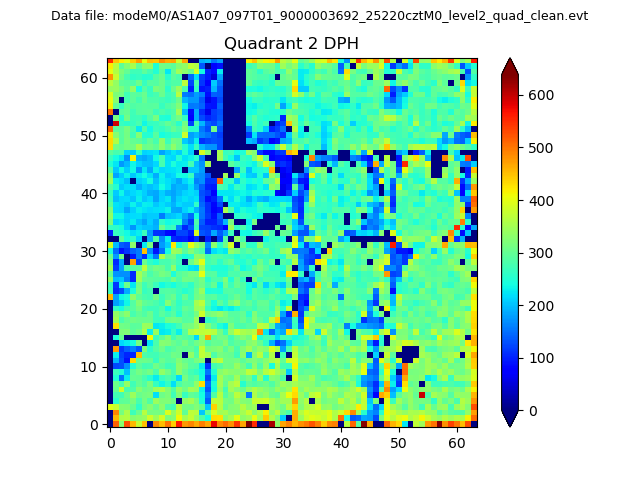
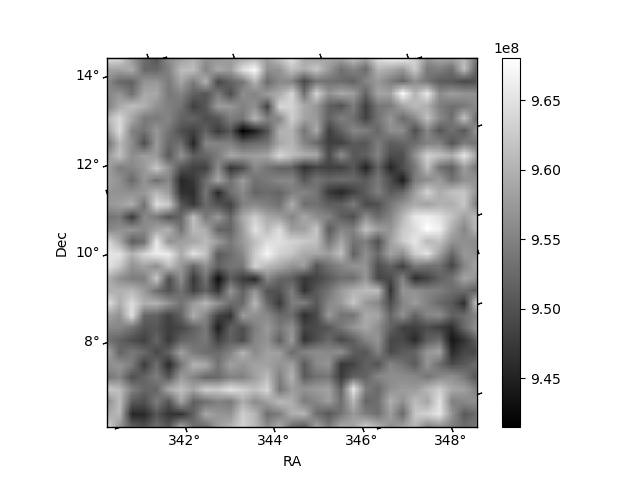
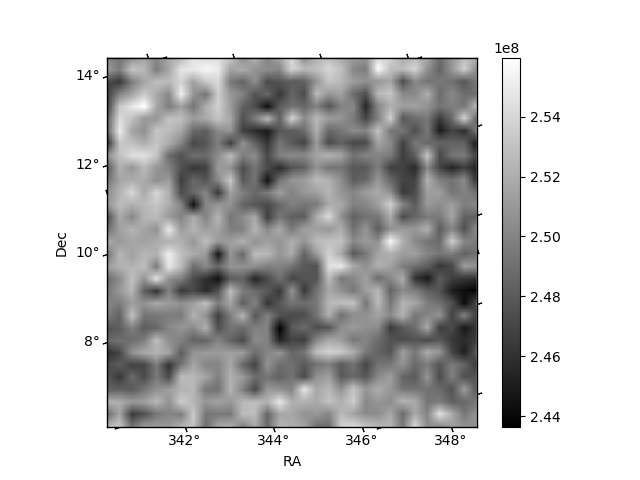
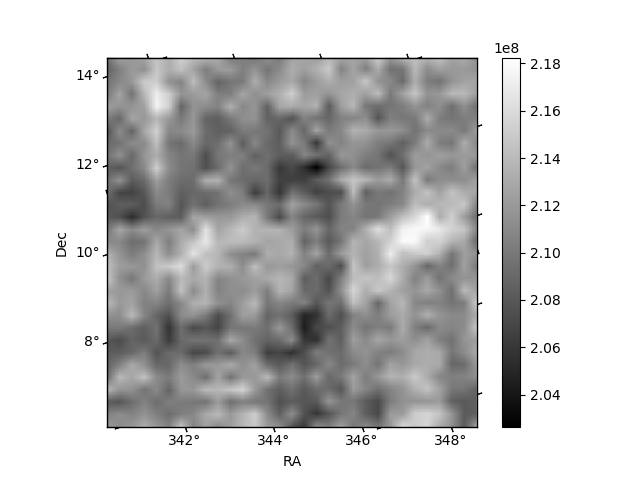
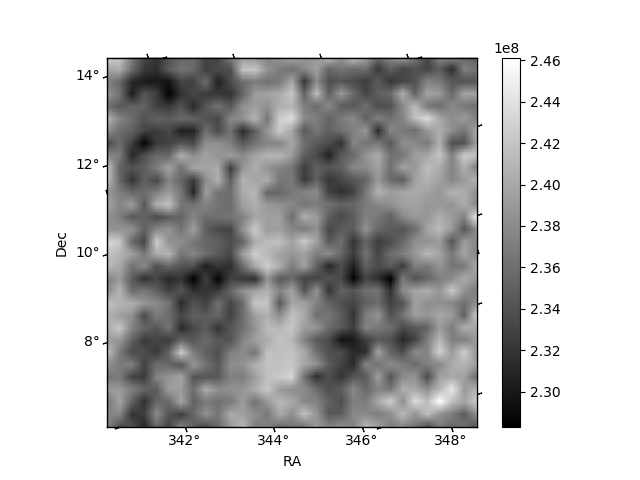
Histogram calculated using DETX and DETY for each event in the final _common_clean file
| Quadrant A | 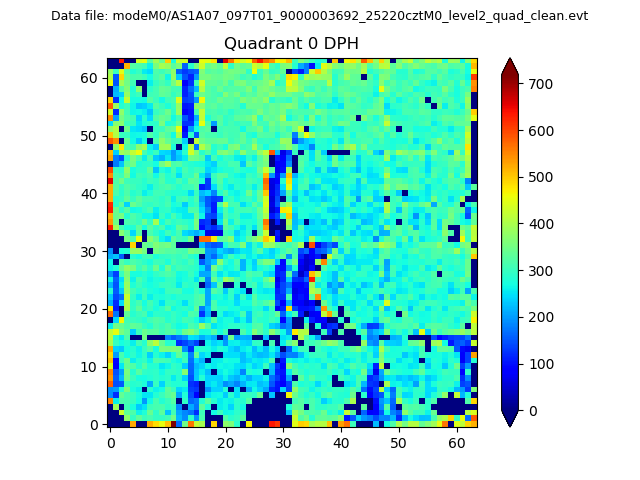 |
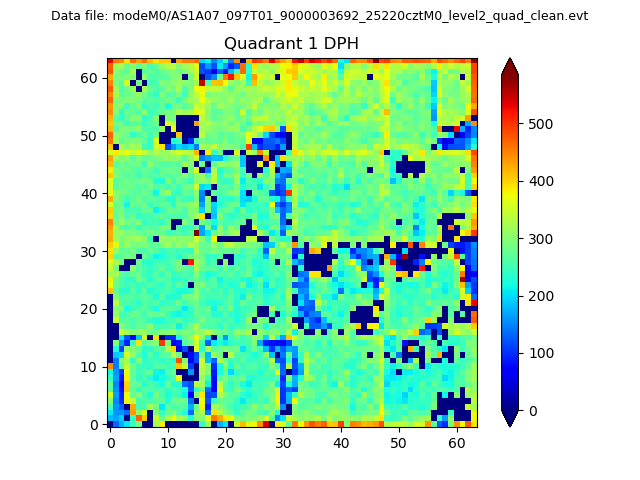 |
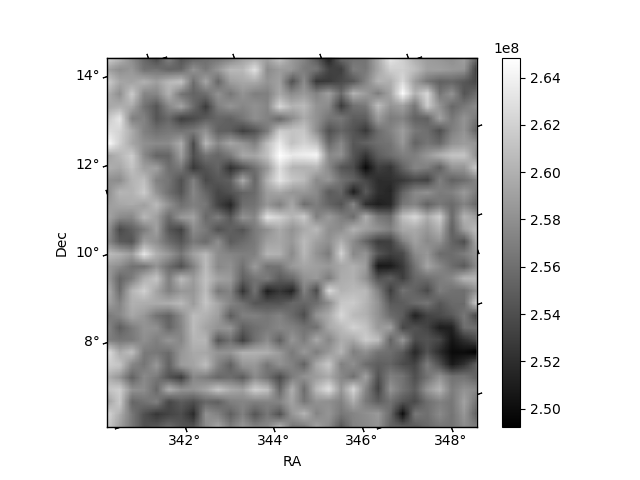
Quadrant B |
|---|---|---|---|
| Quadrant D | 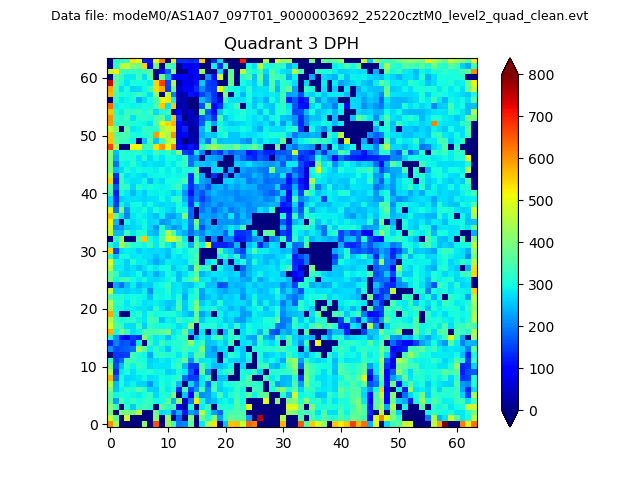 |
 |
Quadrant C |
| Plot type | Count rate plots | Images |
|---|---|---|
| Comparison with Poisson distribution Blue bars denote a histogram of data divided into 1 sec bins. Red curve is a Poisson curve with rate = median count rate of data. |
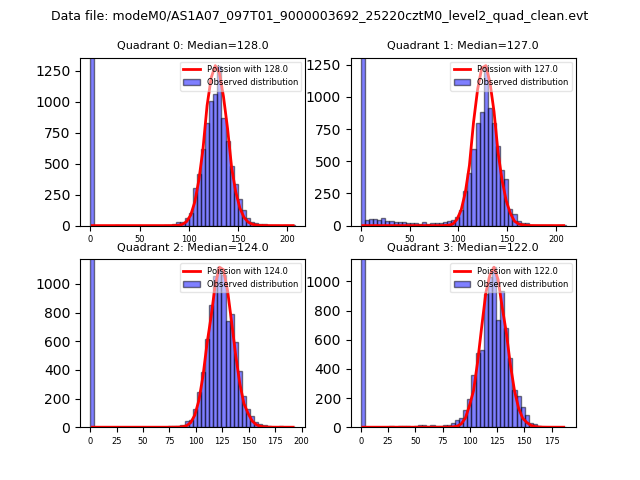 |
 |
| Quadrant-wise count rates Data is divided into 100 sec bins |
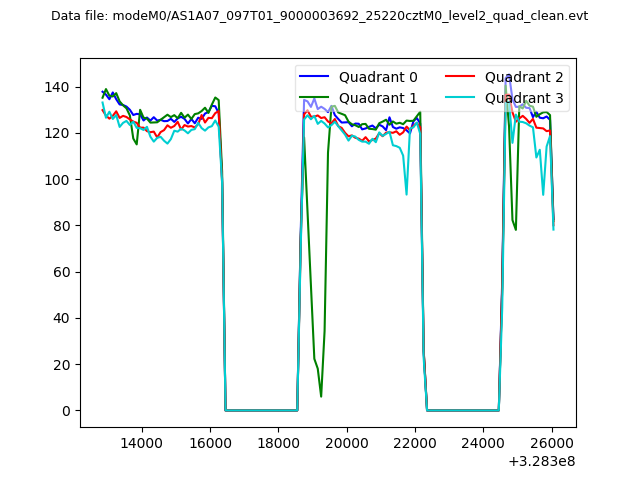 |
|
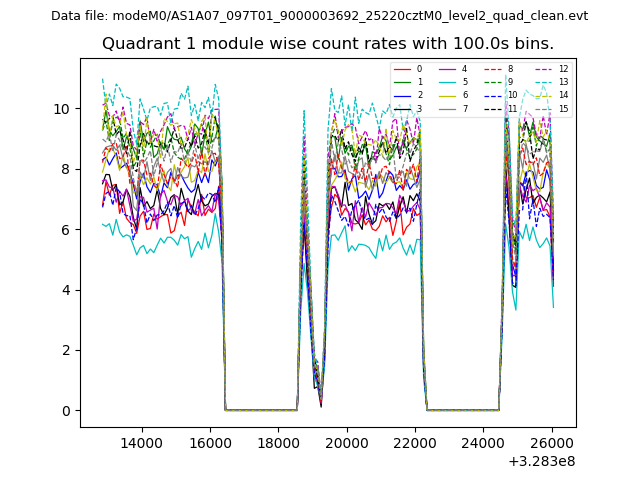
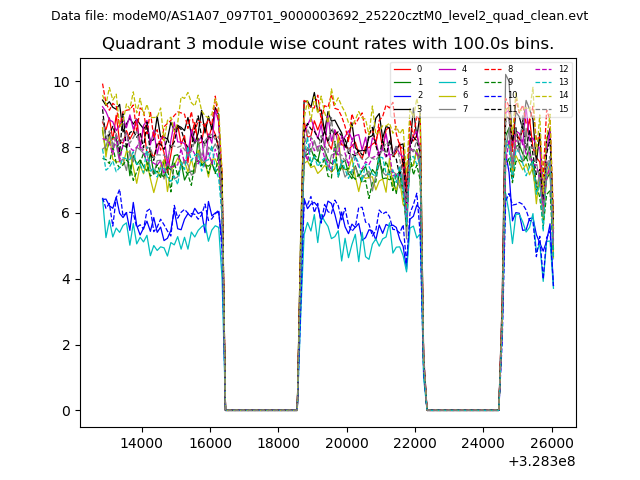
| Module-wise count rates for Quadrant A Data is divided into 100 sec bins |
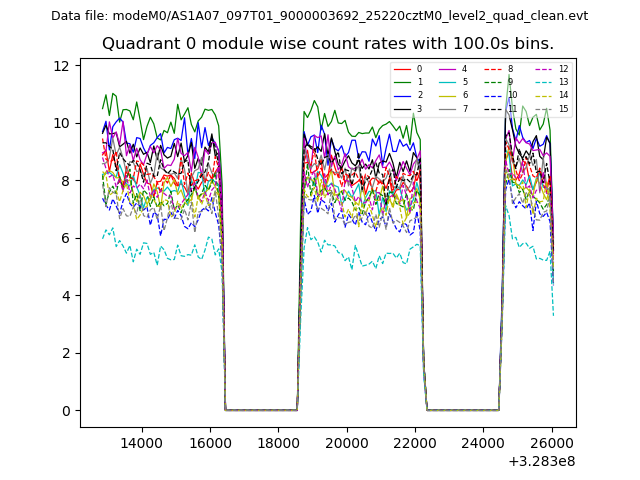 |
 |
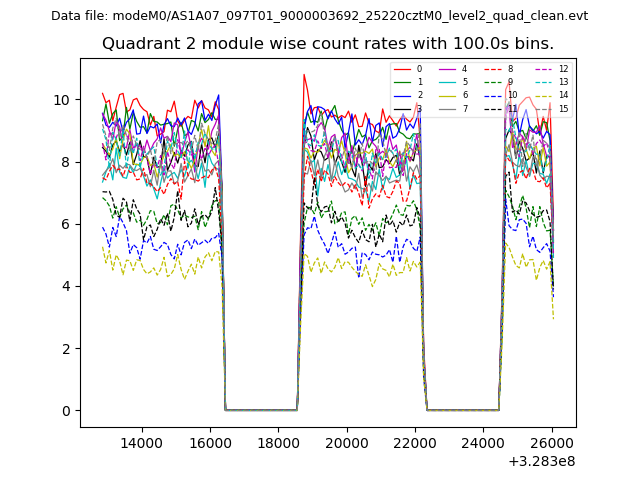
| Module-wise count rates for Quadrant B Data is divided into 100 sec bins |
 |
 |
| Module-wise count rates for Quadrant C Data is divided into 100 sec bins |
 |
 |
| Module-wise count rates for Quadrant D Data is divided into 100 sec bins |
 |
 |
| Parameter | Plot |
|---|---|
| CZT HV Monitor | 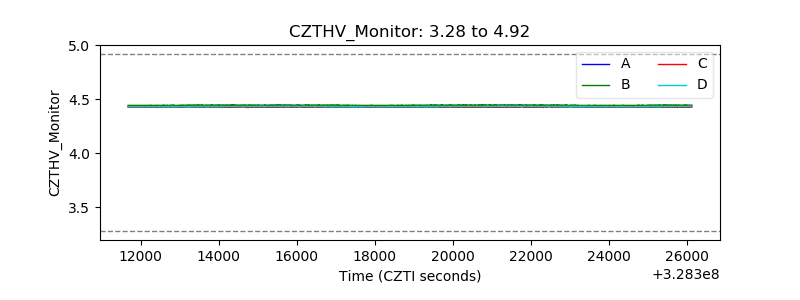 |
| D_VDD | 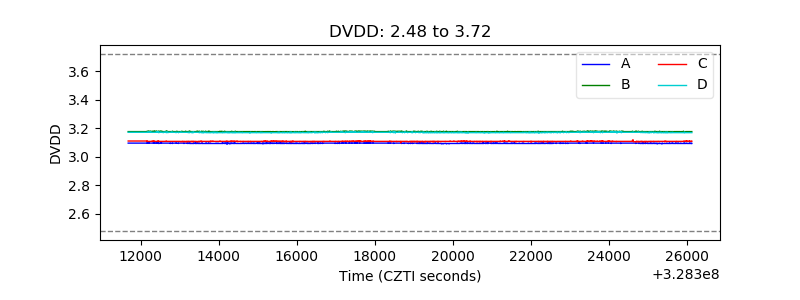 |
| Temperature 1 | 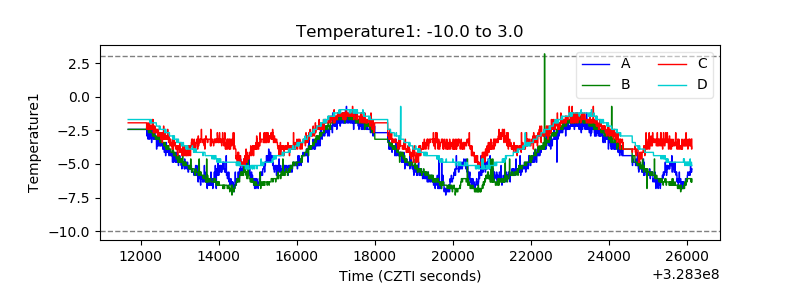 |
| Veto HV Monitor | 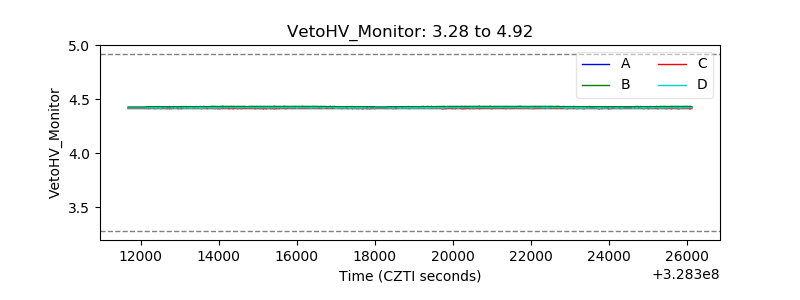 |
| Veto LLD | 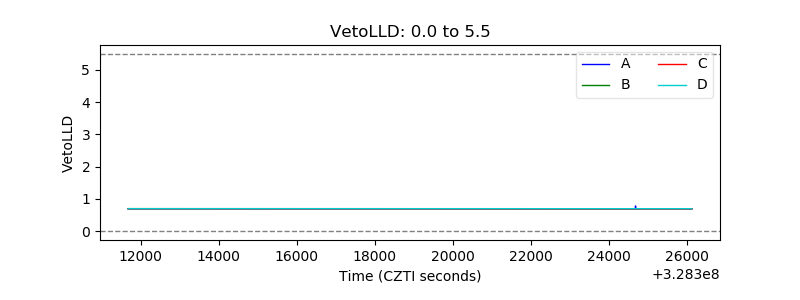 |
| Alpha Counter | 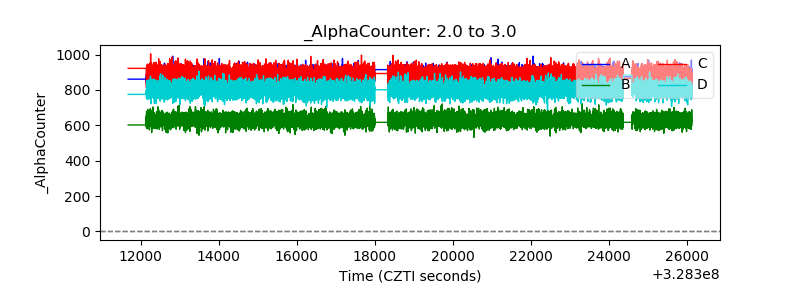 |
| _CPM_Rate | 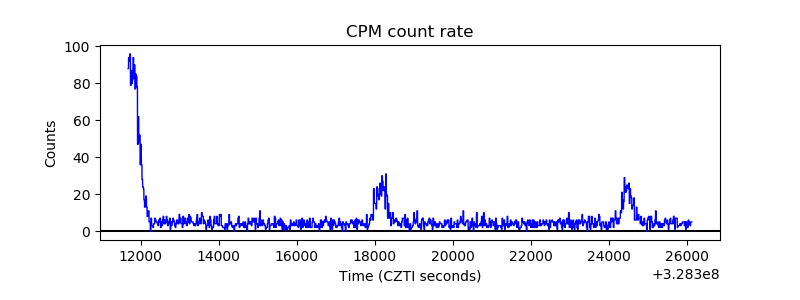 |
| CZT Counter | 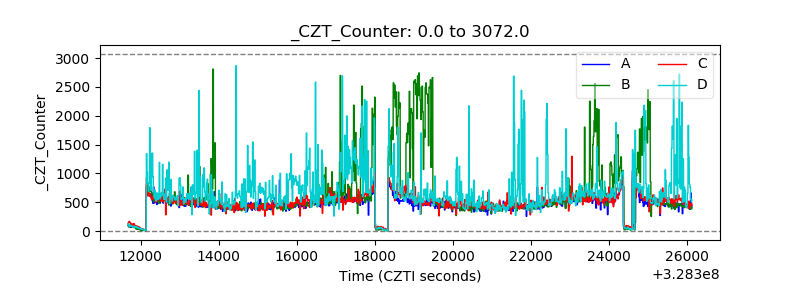 |
| +2.5 Volts monitor |  |
| +5 Volts monitor | 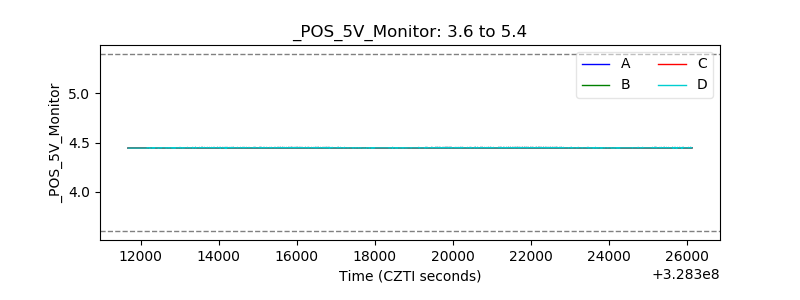 |
| _ROLL_ROT | 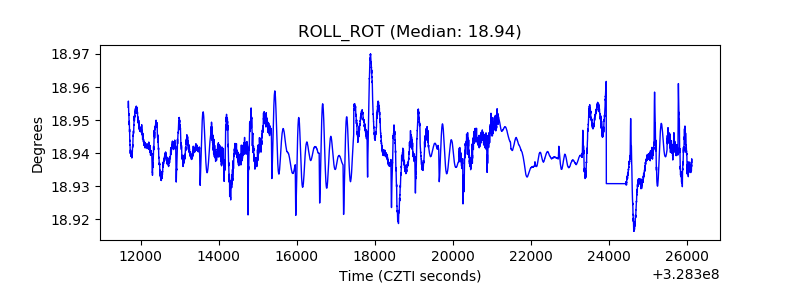 |
| _Roll_DEC | 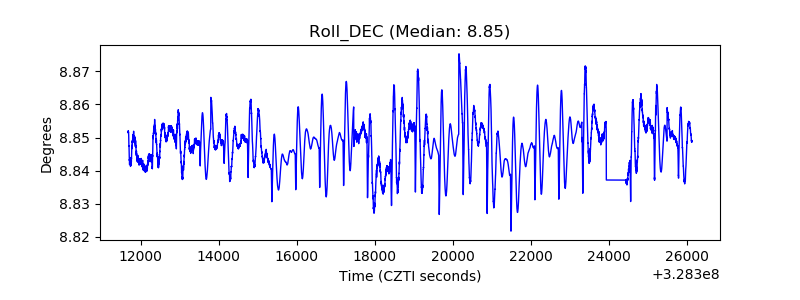 |
| _Roll_RA | 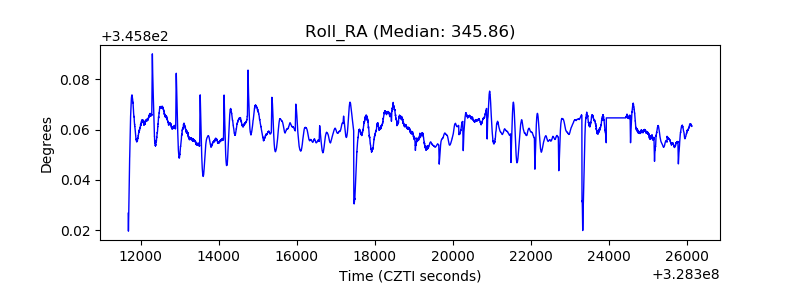 |
| Veto Counter | 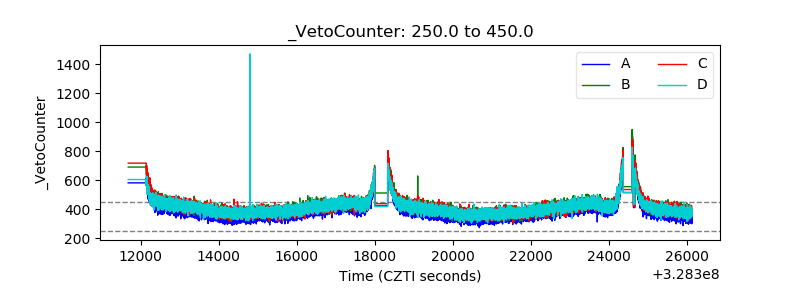 |