| Param | Original file | Final file |
|---|---|---|
| Filename | modeM0/AS1A07_097T01_9000003692_25221cztM0_level2.evt | modeM0/AS1A07_097T01_9000003692_25221cztM0_level2_quad_clean.evt |
| Size (bytes) | 690,344,640 | 104,371,200 |
| Size | 658.4 MB | 99.5 MB |
| Events in quadrant A | 4,016,204 | 667,585 |
| Events in quadrant B | 5,117,293 | 658,939 |
| Events in quadrant C | 4,194,207 | 643,143 |
| Events in quadrant D | 7,016,645 | 613,483 |
| Mode M0 | |||
|---|---|---|---|
| Quadrant | BADHDUFLAG | Total packets | Discarded packets |
| A | 0 | 17359 | 0 |
| B | 0 | 20912 | 0 |
| C | 0 | 17576 | 0 |
| D | 0 | 26601 | 0 |
| Mode M9 | |||
|---|---|---|---|
| Quadrant | BADHDUFLAG | Total packets | Discarded packets |
| A | 0 | 8 | 0 |
| B | 0 | 8 | 0 |
| C | 0 | 8 | 0 |
| D | 0 | 8 | 0 |
| Quadrant | Total seconds | Saturated seconds | Saturation percentage |
|---|---|---|---|
| A | 8311 | 94 | 1.131031% |
| B | 8311 | 642 | 7.724702% |
| C | 8311 | 166 | 1.997353% |
| D | 8312 | 629 | 7.567372% |
Noise dominated data is calculated using 1-second bins in cleaned event files. If a bin has >2000 counts, and if more than 50% of those come from <1% of pixels, then it is considered to be noise-dominated and hence unusable.
| Quadrant | # 1 sec bins | Bins with >0 counts | Bins with >2000 counts | High rate bins dominated by noise | Noise dominated (total time) | Noise dominated (detector-on time) | Marked lightcurve |
|---|---|---|---|---|---|---|---|
| A | 9056 | 8314 | 0 | 0 | 0.00% | 0.00% | 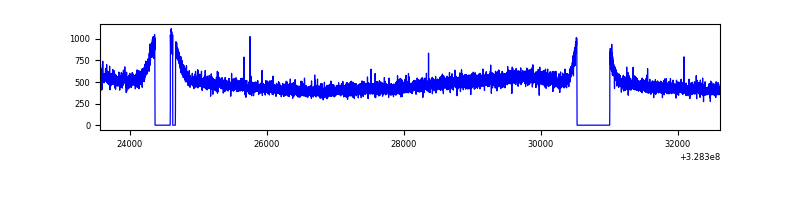 |
| B | 9056 | 8314 | 193 | 193 | 2.13% | 2.32% | 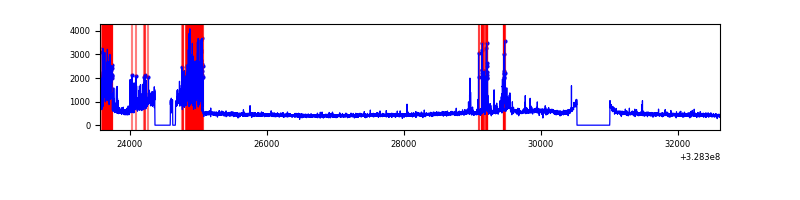 |
| C | 9056 | 8314 | 0 | 0 | 0.00% | 0.00% | 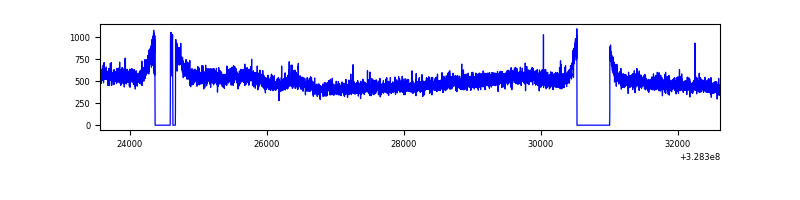 |
| D | 9057 | 8315 | 415 | 415 | 4.58% | 4.99% | 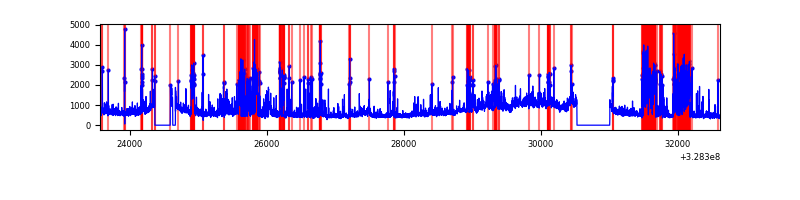 |
Top three noisy pixels from each quadrant. If the there are fewer than three noisy pixels in the level2.evt file, extra rows are filled as -1
| Pixel properties | Quadrant properties | ||||||
|---|---|---|---|---|---|---|---|
| Quadrant | DetID | PixID | Counts | Sigma | Mean | Median | Sigma |
| A | 13 | 254 | 11958 | 51.55 | 1042 | 1018 | 212.2 |
| A | 3 | 137 | 9955 | 42.11 | 1042 | 1018 | 212.2 |
| A | 0 | 226 | 8866 | 36.98 | 1042 | 1018 | 212.2 |
| B | 3 | 64 | 1035434 | 5298.87 | 1009 | 984 | 195.2 |
| B | 0 | 230 | 54555 | 274.41 | 1009 | 984 | 195.2 |
| B | 0 | 190 | 35155 | 175.04 | 1009 | 984 | 195.2 |
| C | 14 | 238 | 155418 | 648.1 | 998 | 1003 | 238.3 |
| C | 7 | 247 | 137266 | 571.91 | 998 | 1003 | 238.3 |
| C | 13 | 61 | 6899 | 24.74 | 998 | 1003 | 238.3 |
| D | 10 | 70 | 1208909 | 4638.42 | 977 | 957 | 260.4 |
| D | 7 | 238 | 1079173 | 4140.25 | 977 | 957 | 260.4 |
| D | 8 | 195 | 566326 | 2170.96 | 977 | 957 | 260.4 |
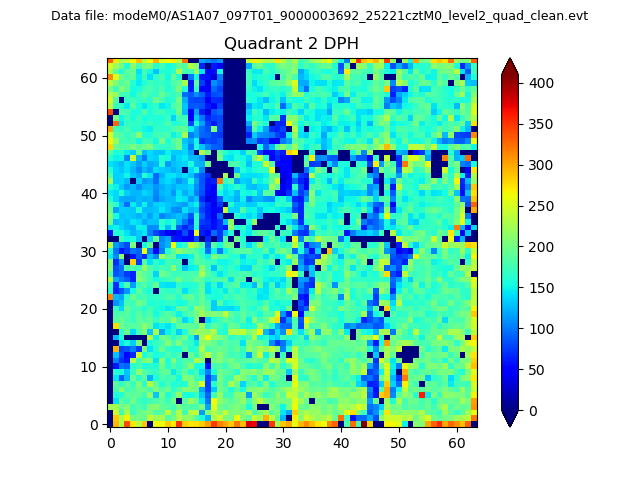
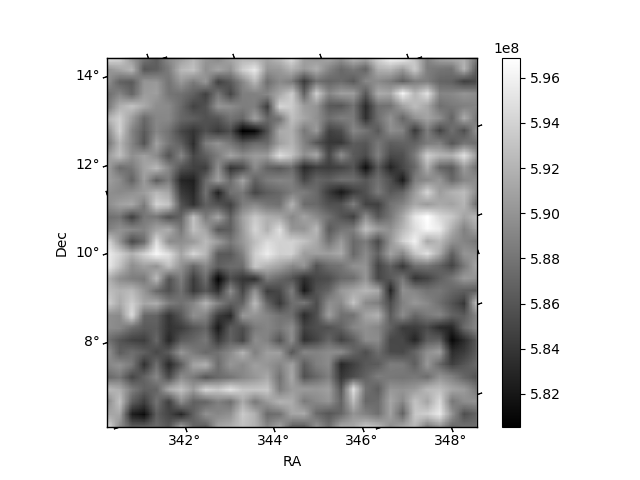
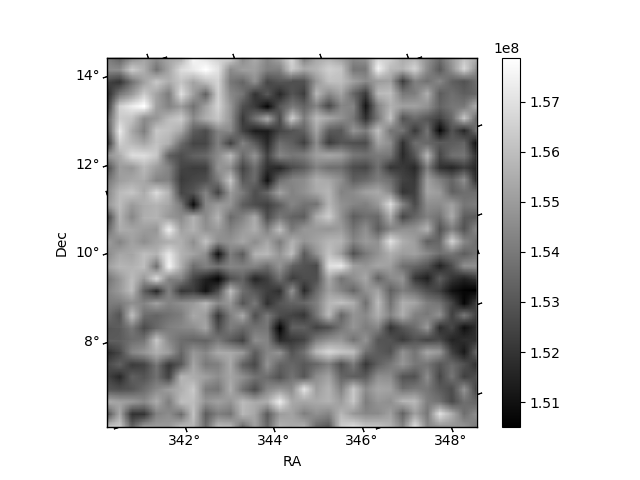
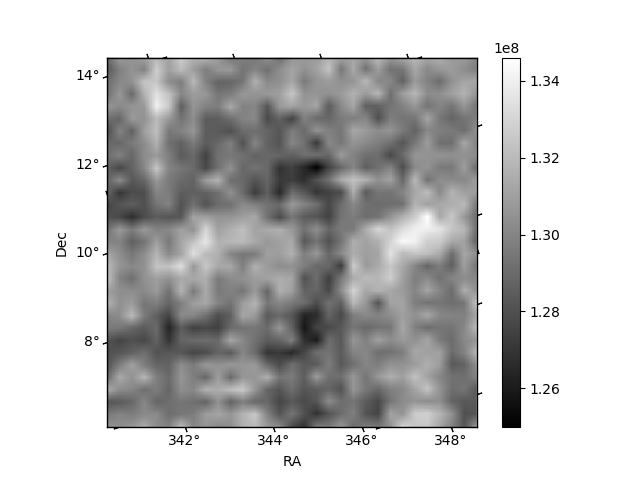
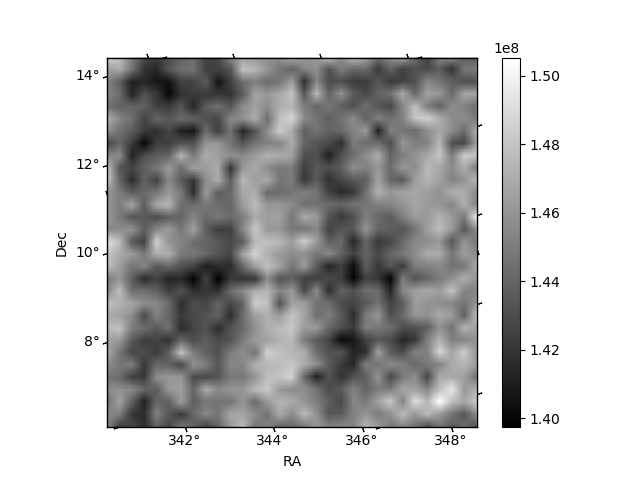
Histogram calculated using DETX and DETY for each event in the final _common_clean file
| Quadrant A | 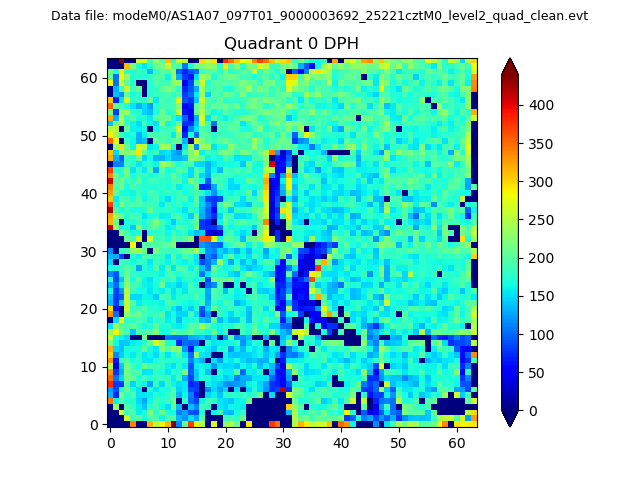 |
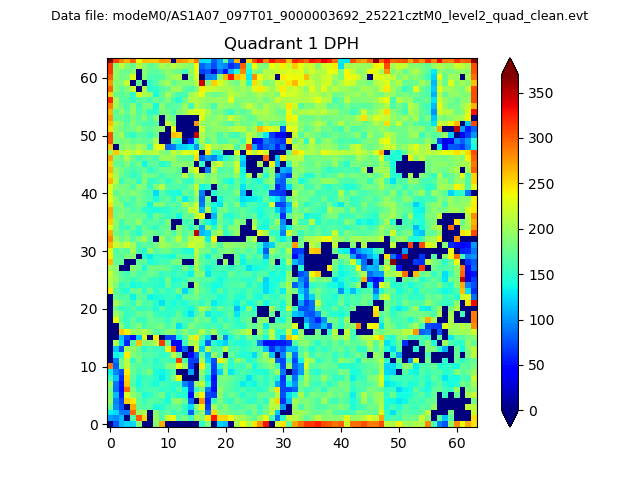 |
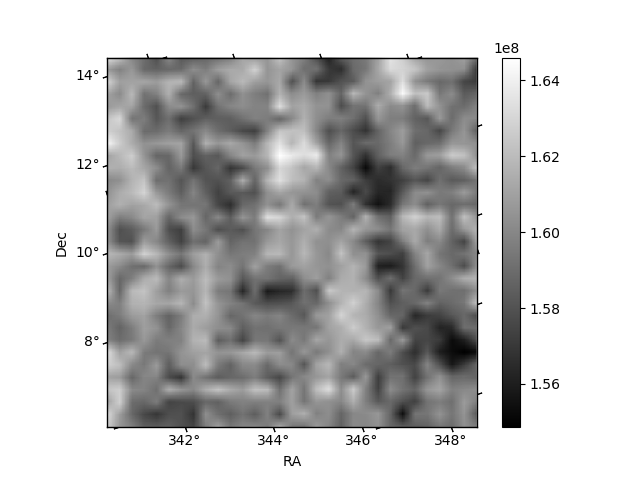
Quadrant B |
|---|---|---|---|
| Quadrant D | 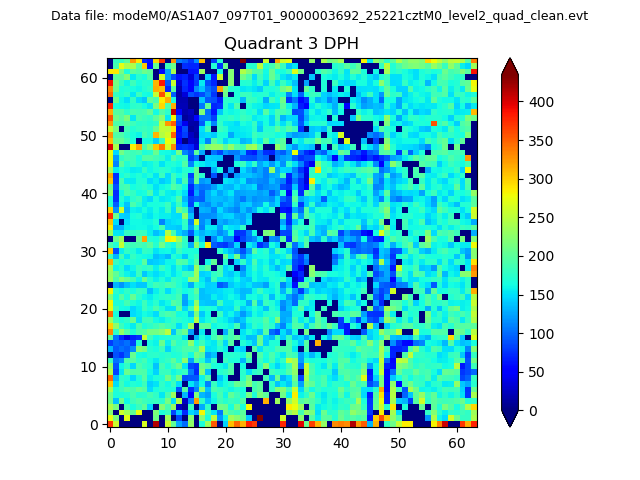 |
 |
Quadrant C |
| Plot type | Count rate plots | Images |
|---|---|---|
| Comparison with Poisson distribution Blue bars denote a histogram of data divided into 1 sec bins. Red curve is a Poisson curve with rate = median count rate of data. |
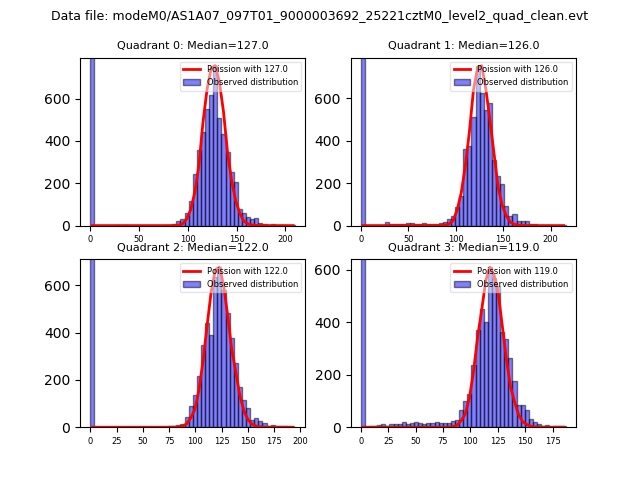 |
 |
| Quadrant-wise count rates Data is divided into 100 sec bins |
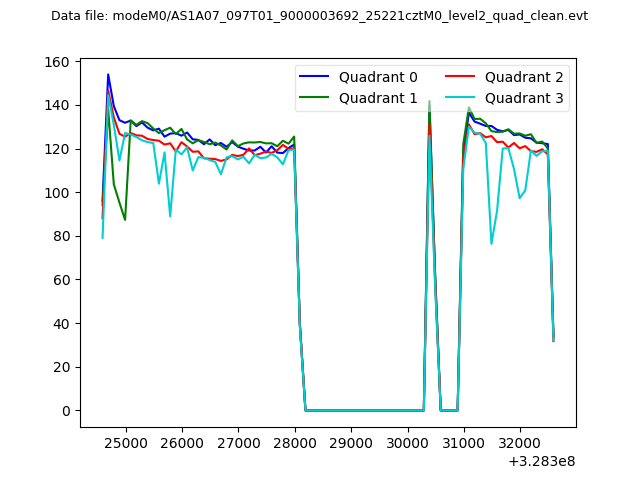 |
|
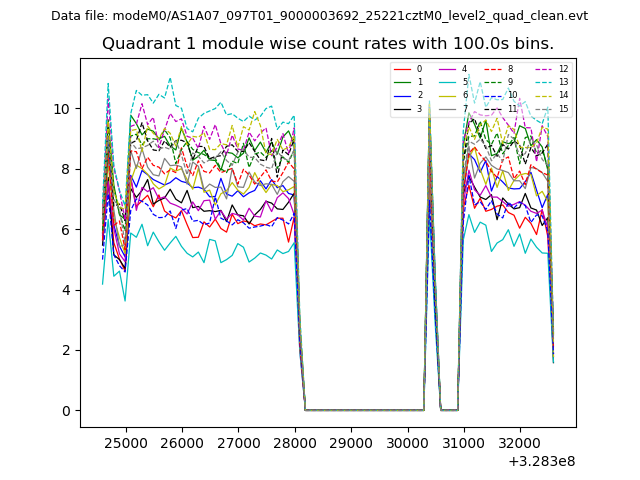
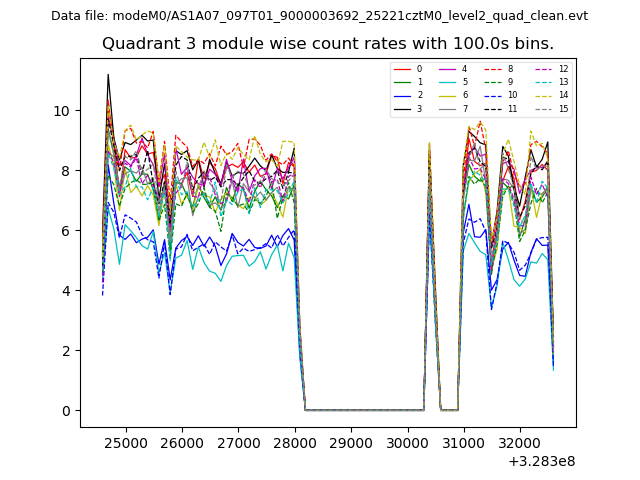
| Module-wise count rates for Quadrant A Data is divided into 100 sec bins |
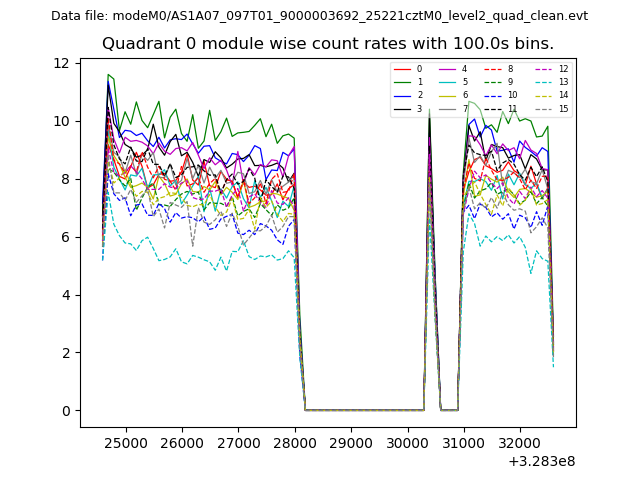 |
 |
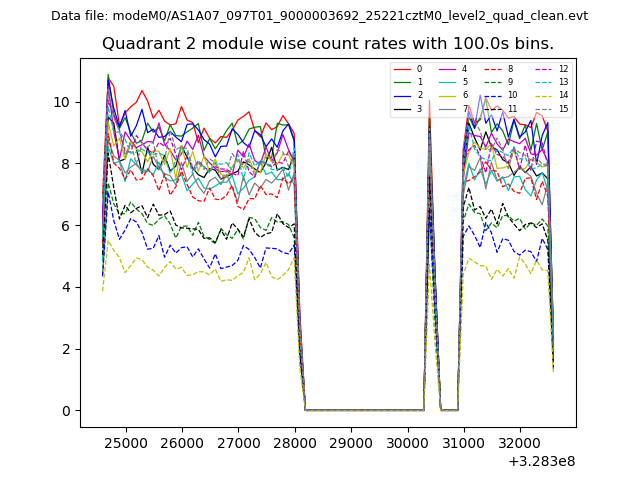
| Module-wise count rates for Quadrant B Data is divided into 100 sec bins |
 |
 |
| Module-wise count rates for Quadrant C Data is divided into 100 sec bins |
 |
 |
| Module-wise count rates for Quadrant D Data is divided into 100 sec bins |
 |
 |
| Parameter | Plot |
|---|---|
| CZT HV Monitor | 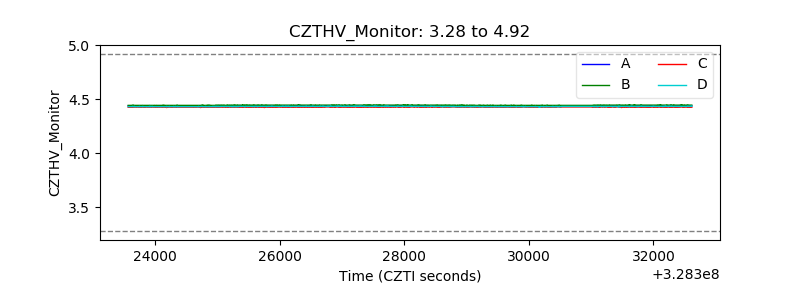 |
| D_VDD | 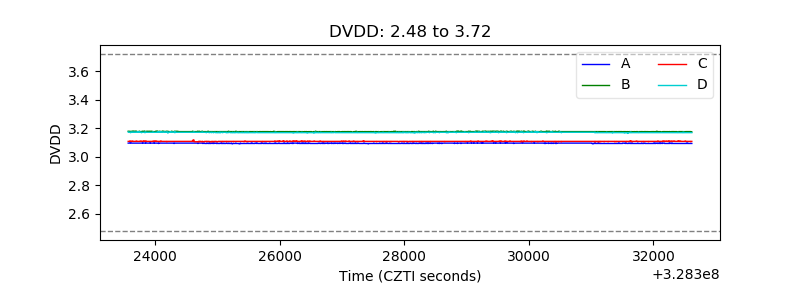 |
| Temperature 1 | 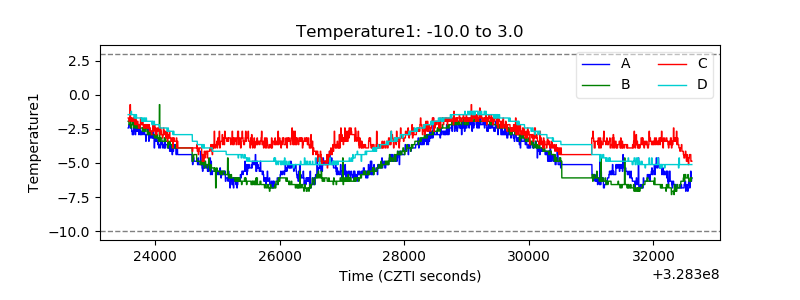 |
| Veto HV Monitor |  |
| Veto LLD |  |
| Alpha Counter |  |
| _CPM_Rate | 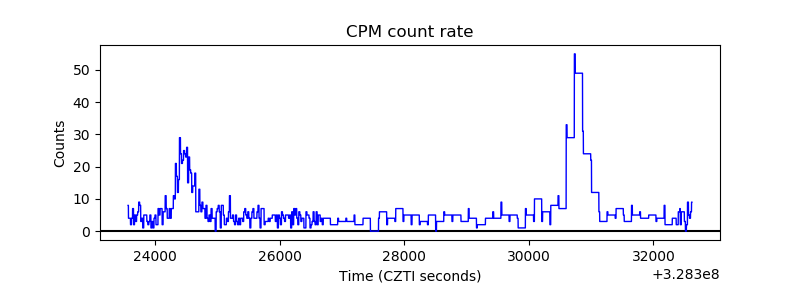 |
| CZT Counter | 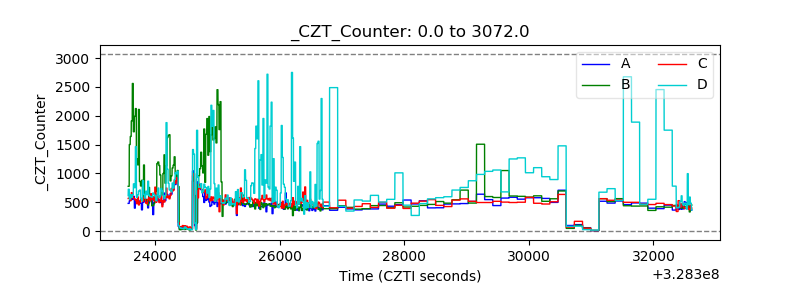 |
| +2.5 Volts monitor |  |
| +5 Volts monitor |  |
| _ROLL_ROT | 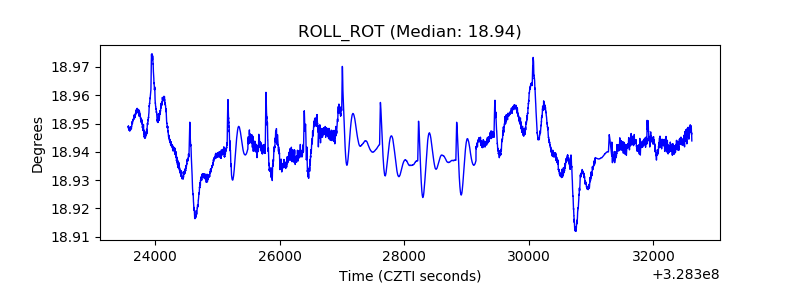 |
| _Roll_DEC | 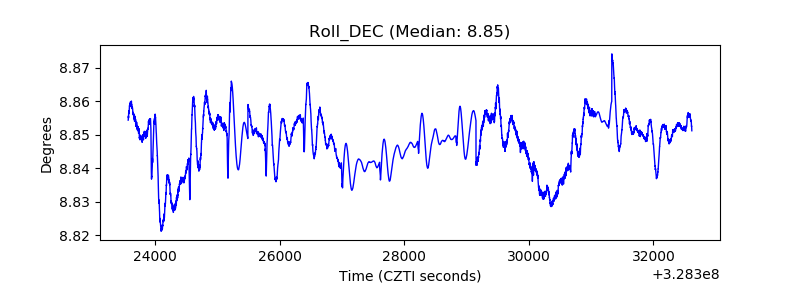 |
| _Roll_RA | 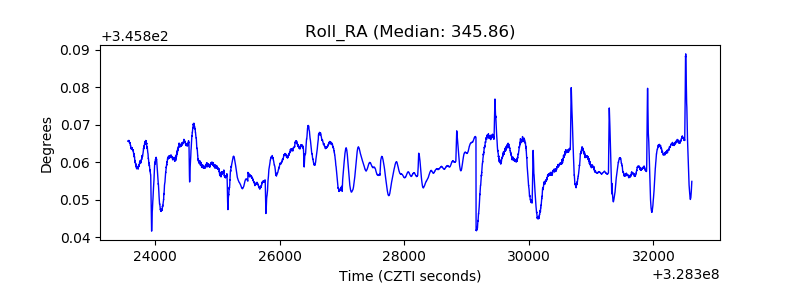 |
| Veto Counter | 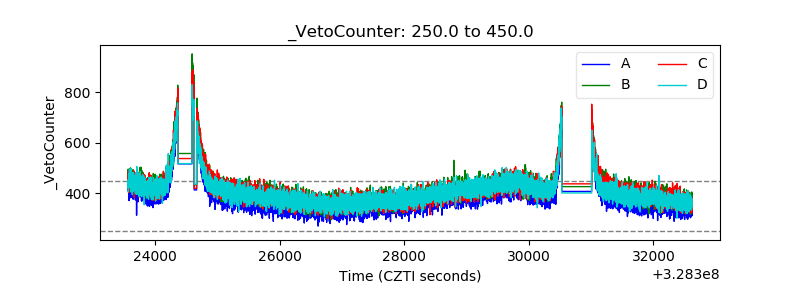 |