| Param | Original file | Final file |
|---|---|---|
| Filename | modeM0/AS1A07_097T01_9000003692_25227cztM0_level2.evt | modeM0/AS1A07_097T01_9000003692_25227cztM0_level2_quad_clean.evt |
| Size (bytes) | 492,284,160 | 76,271,040 |
| Size | 469.5 MB | 72.7 MB |
| Events in quadrant A | 3,239,720 | 479,825 |
| Events in quadrant B | 3,327,046 | 486,785 |
| Events in quadrant C | 3,477,005 | 456,539 |
| Events in quadrant D | 4,447,221 | 456,122 |
| Mode M0 | |||
|---|---|---|---|
| Quadrant | BADHDUFLAG | Total packets | Discarded packets |
| A | 0 | 13220 | 0 |
| B | 0 | 13491 | 0 |
| C | 0 | 14102 | 0 |
| D | 0 | 17407 | 0 |
| Mode M9 | |||
|---|---|---|---|
| Quadrant | BADHDUFLAG | Total packets | Discarded packets |
| A | 0 | 12 | 0 |
| B | 0 | 12 | 0 |
| C | 0 | 12 | 0 |
| D | 0 | 12 | 0 |
| Quadrant | Total seconds | Saturated seconds | Saturation percentage |
|---|---|---|---|
| A | 6161 | 55 | 0.892712% |
| B | 6161 | 66 | 1.071255% |
| C | 6160 | 83 | 1.347403% |
| D | 6161 | 158 | 2.564519% |
Noise dominated data is calculated using 1-second bins in cleaned event files. If a bin has >2000 counts, and if more than 50% of those come from <1% of pixels, then it is considered to be noise-dominated and hence unusable.
| Quadrant | # 1 sec bins | Bins with >0 counts | Bins with >2000 counts | High rate bins dominated by noise | Noise dominated (total time) | Noise dominated (detector-on time) | Marked lightcurve |
|---|---|---|---|---|---|---|---|
| A | 7346 | 6162 | 0 | 0 | 0.00% | 0.00% | 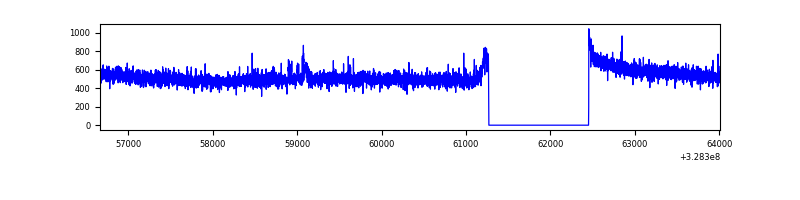 |
| B | 7346 | 6162 | 5 | 5 | 0.07% | 0.08% | 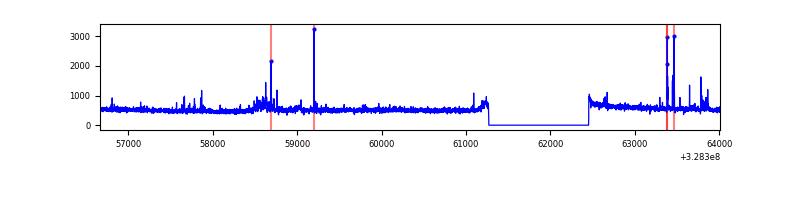 |
| C | 7345 | 6161 | 0 | 0 | 0.00% | 0.00% | 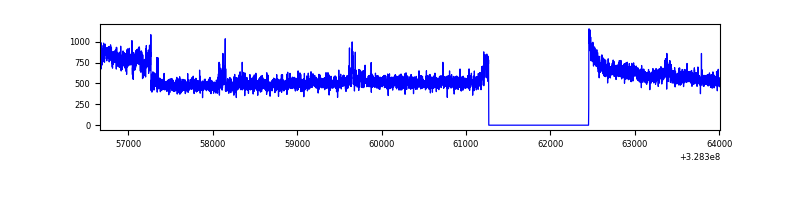 |
| D | 7346 | 6162 | 85 | 85 | 1.16% | 1.38% | 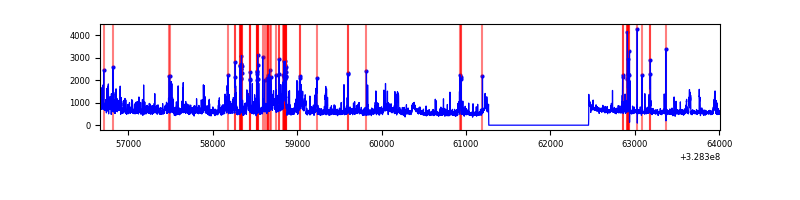 |
Top three noisy pixels from each quadrant. If the there are fewer than three noisy pixels in the level2.evt file, extra rows are filled as -1
| Pixel properties | Quadrant properties | ||||||
|---|---|---|---|---|---|---|---|
| Quadrant | DetID | PixID | Counts | Sigma | Mean | Median | Sigma |
| A | 6 | 14 | 21389 | 122.86 | 835 | 822 | 167.4 |
| A | 13 | 254 | 9553 | 52.15 | 835 | 822 | 167.4 |
| A | 0 | 226 | 7251 | 38.4 | 835 | 822 | 167.4 |
| B | 0 | 190 | 32550 | 206.66 | 816 | 798 | 153.6 |
| B | 15 | 33 | 31660 | 200.86 | 816 | 798 | 153.6 |
| B | 3 | 64 | 31183 | 197.76 | 816 | 798 | 153.6 |
| C | 7 | 247 | 289552 | 1592.06 | 783 | 791 | 181.4 |
| C | 14 | 238 | 125964 | 690.13 | 783 | 791 | 181.4 |
| C | 14 | 67 | 6830 | 33.3 | 783 | 791 | 181.4 |
| D | 1 | 52 | 422764 | 2001.05 | 798 | 781 | 210.9 |
| D | 10 | 70 | 404246 | 1913.23 | 798 | 781 | 210.9 |
| D | 8 | 195 | 292868 | 1385.08 | 798 | 781 | 210.9 |
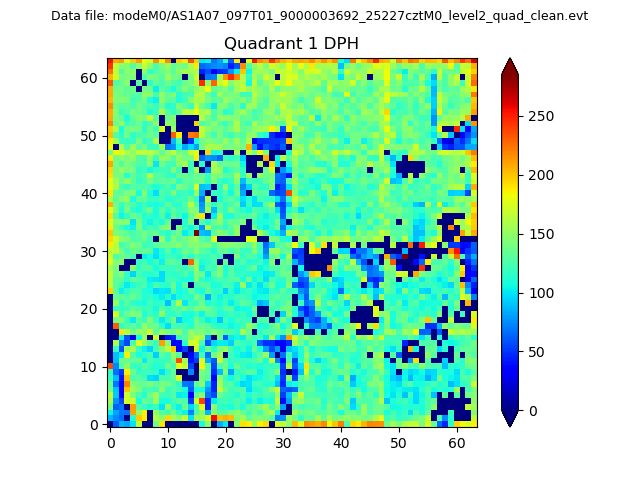
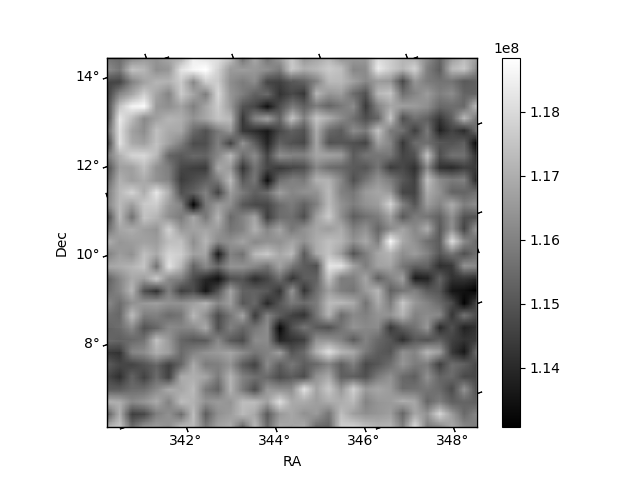
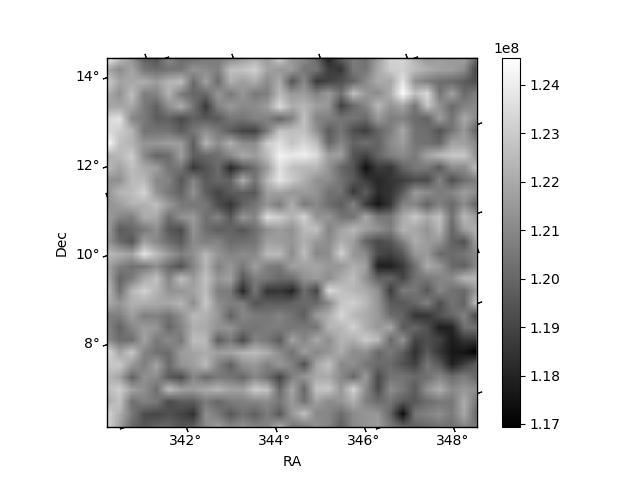
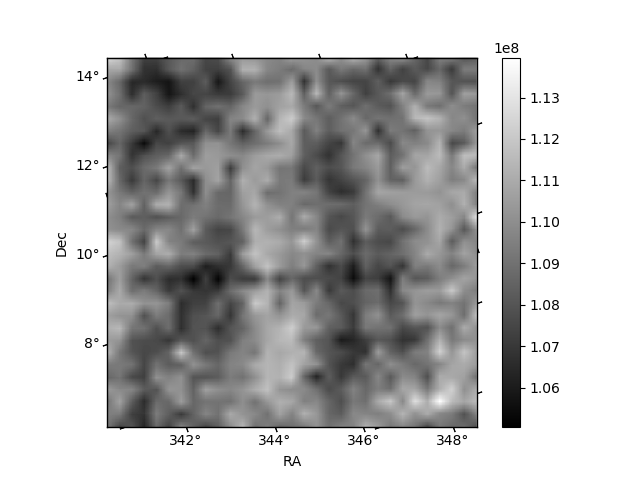
Histogram calculated using DETX and DETY for each event in the final _common_clean file
| Quadrant A |  |
 |
Quadrant B |
|---|---|---|---|
| Quadrant D | 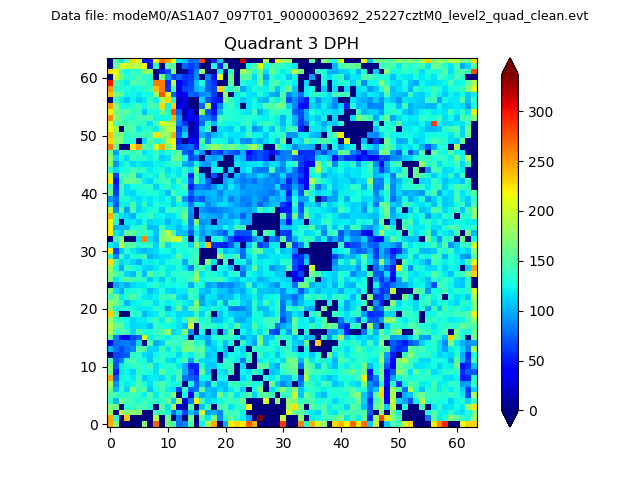 |
 |
Quadrant C |
| Plot type | Count rate plots | Images |
|---|---|---|
| Comparison with Poisson distribution Blue bars denote a histogram of data divided into 1 sec bins. Red curve is a Poisson curve with rate = median count rate of data. |
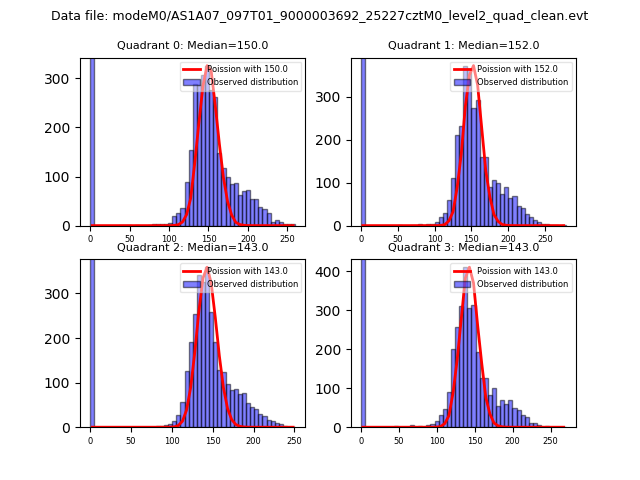 |
 |
| Quadrant-wise count rates Data is divided into 100 sec bins |
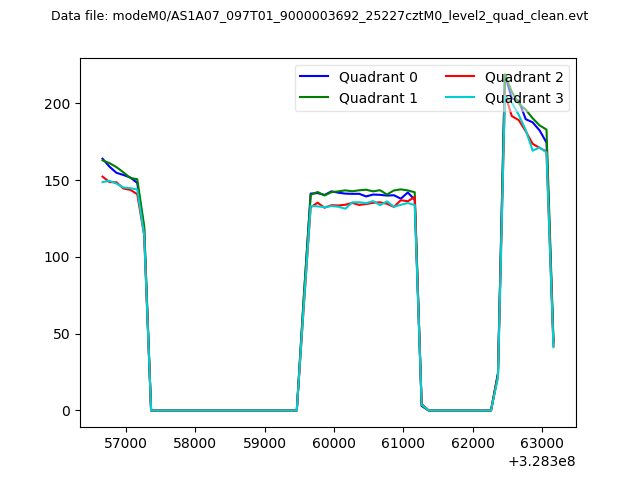 |
|
| Module-wise count rates for Quadrant A Data is divided into 100 sec bins |
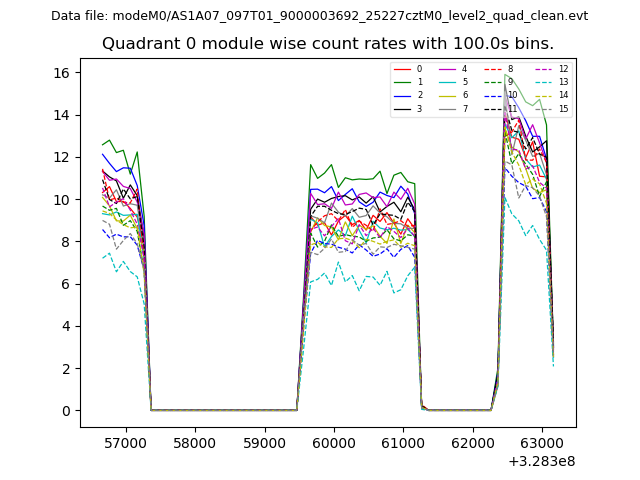 |
 |
| Module-wise count rates for Quadrant B Data is divided into 100 sec bins |
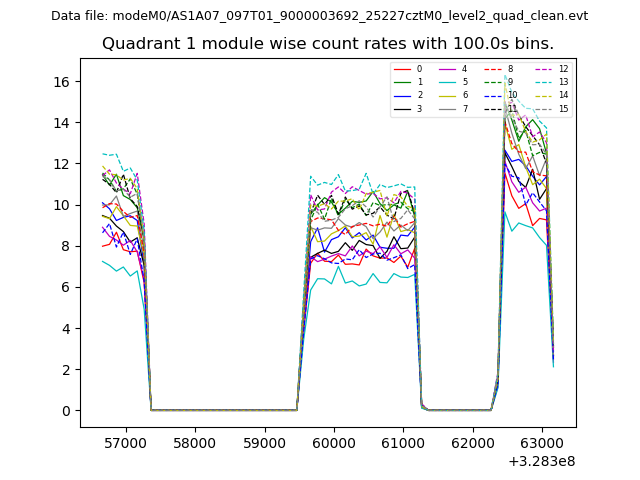 |
 |
| Module-wise count rates for Quadrant C Data is divided into 100 sec bins |
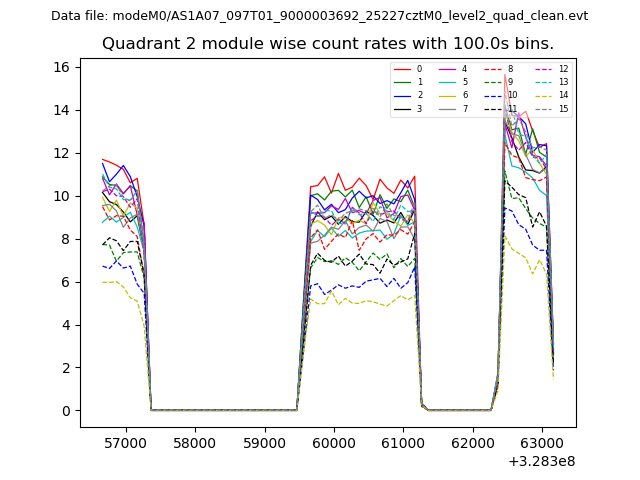 |
 |
| Module-wise count rates for Quadrant D Data is divided into 100 sec bins |
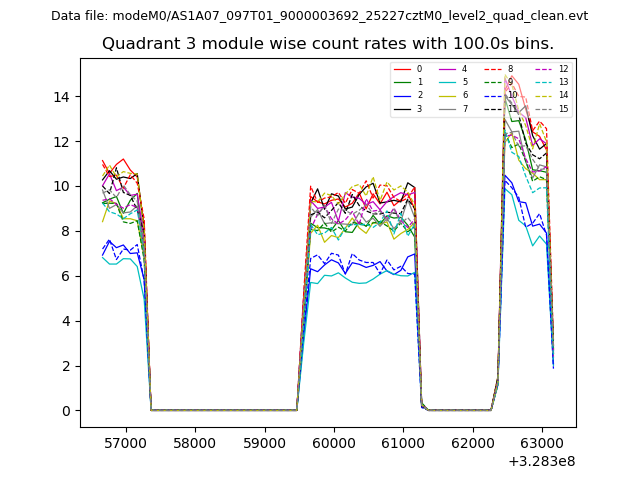 |
 |
| Parameter | Plot |
|---|---|
| CZT HV Monitor | 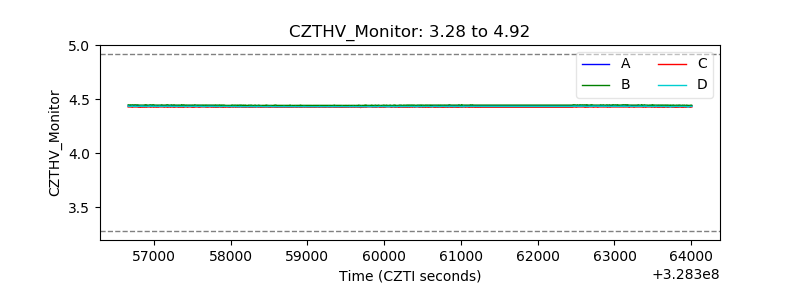 |
| D_VDD | 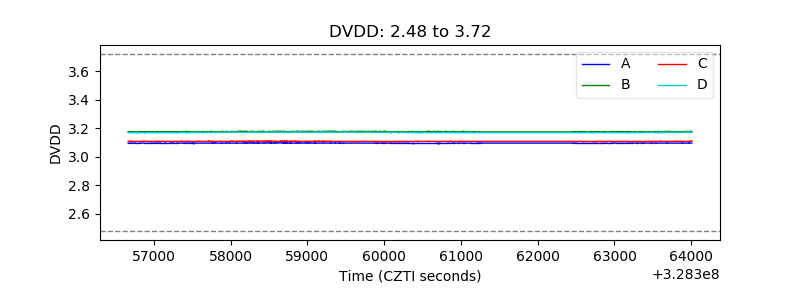 |
| Temperature 1 |  |
| Veto HV Monitor |  |
| Veto LLD |  |
| Alpha Counter | 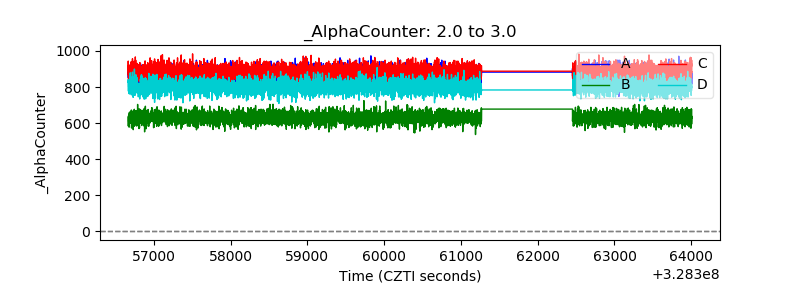 |
| _CPM_Rate | 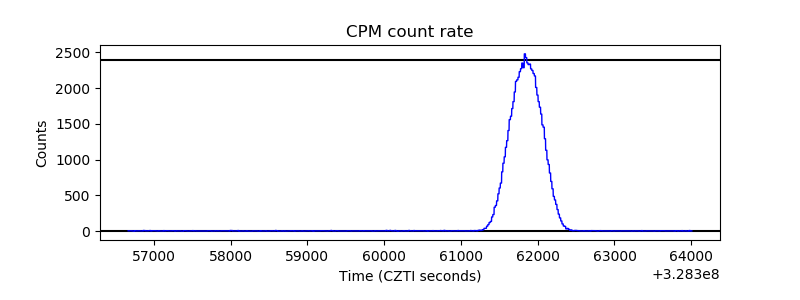 |
| CZT Counter | 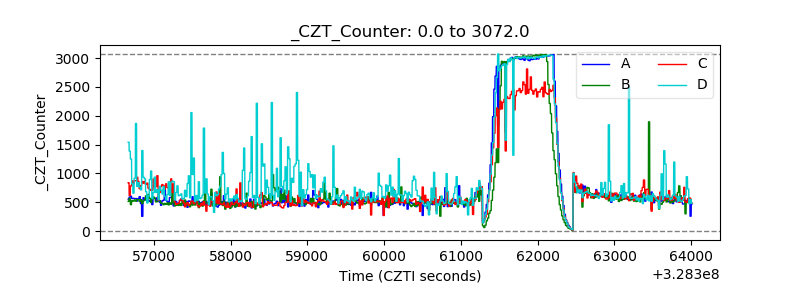 |
| +2.5 Volts monitor |  |
| +5 Volts monitor | 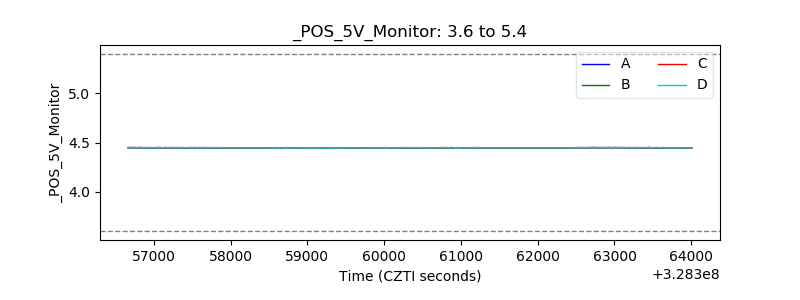 |
| _ROLL_ROT | 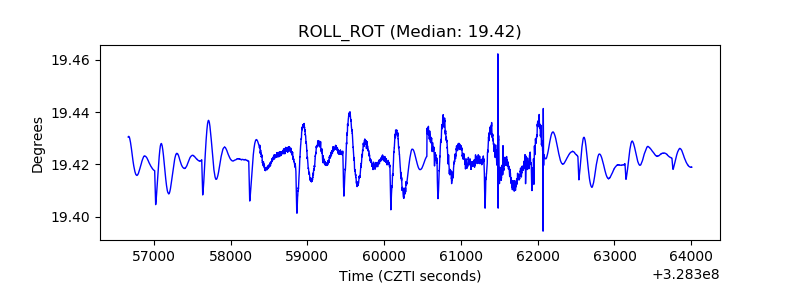 |
| _Roll_DEC | 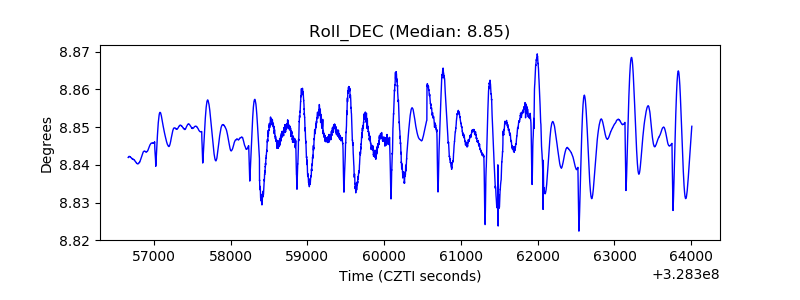 |
| _Roll_RA |  |
| Veto Counter | 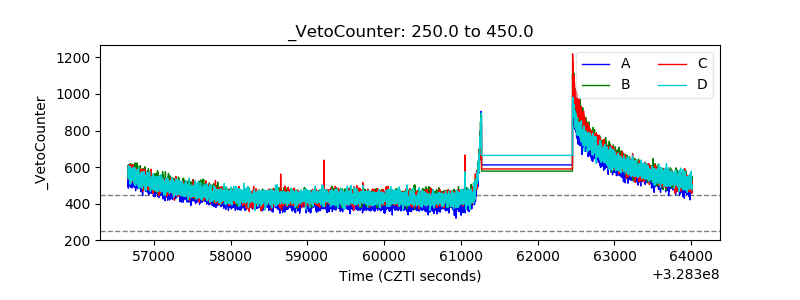 |