| Param | Original file | Final file |
|---|---|---|
| Filename | modeM0/AS1A07_097T01_9000003692_25228cztM0_level2.evt | modeM0/AS1A07_097T01_9000003692_25228cztM0_level2_quad_clean.evt |
| Size (bytes) | 550,782,720 | 80,104,320 |
| Size | 525.3 MB | 76.4 MB |
| Events in quadrant A | 3,647,824 | 505,463 |
| Events in quadrant B | 3,791,093 | 511,649 |
| Events in quadrant C | 3,781,003 | 478,788 |
| Events in quadrant D | 5,020,437 | 476,175 |
| Mode M0 | |||
|---|---|---|---|
| Quadrant | BADHDUFLAG | Total packets | Discarded packets |
| A | 0 | 14869 | 0 |
| B | 0 | 15293 | 0 |
| C | 0 | 15322 | 0 |
| D | 0 | 19440 | 0 |
| Mode M9 | |||
|---|---|---|---|
| Quadrant | BADHDUFLAG | Total packets | Discarded packets |
| A | 0 | 13 | 0 |
| B | 0 | 14 | 0 |
| C | 0 | 14 | 0 |
| D | 0 | 14 | 0 |
| Quadrant | Total seconds | Saturated seconds | Saturation percentage |
|---|---|---|---|
| A | 6502 | 56 | 0.861273% |
| B | 6502 | 75 | 1.153491% |
| C | 6502 | 93 | 1.430329% |
| D | 6502 | 224 | 3.445094% |
Noise dominated data is calculated using 1-second bins in cleaned event files. If a bin has >2000 counts, and if more than 50% of those come from <1% of pixels, then it is considered to be noise-dominated and hence unusable.
| Quadrant | # 1 sec bins | Bins with >0 counts | Bins with >2000 counts | High rate bins dominated by noise | Noise dominated (total time) | Noise dominated (detector-on time) | Marked lightcurve |
|---|---|---|---|---|---|---|---|
| A | 7782 | 6503 | 0 | 0 | 0.00% | 0.00% | 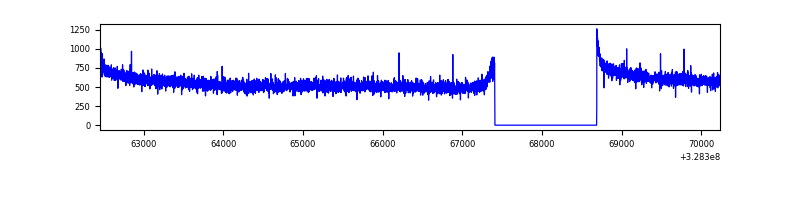 |
| B | 7782 | 6503 | 4 | 4 | 0.05% | 0.06% | 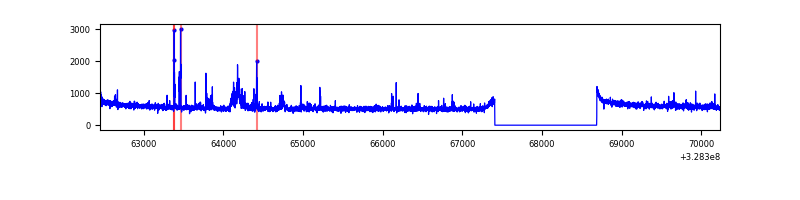 |
| C | 7782 | 6503 | 0 | 0 | 0.00% | 0.00% | 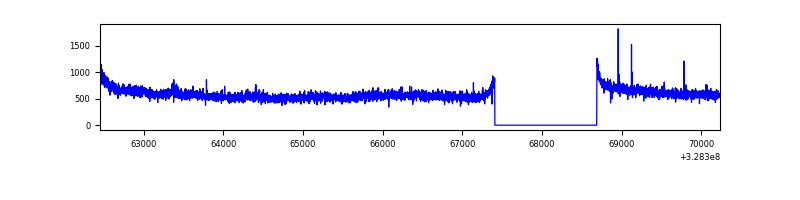 |
| D | 7782 | 6503 | 137 | 137 | 1.76% | 2.11% | 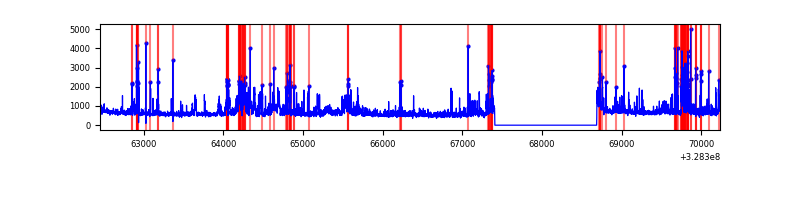 |
Top three noisy pixels from each quadrant. If the there are fewer than three noisy pixels in the level2.evt file, extra rows are filled as -1
| Pixel properties | Quadrant properties | ||||||
|---|---|---|---|---|---|---|---|
| Quadrant | DetID | PixID | Counts | Sigma | Mean | Median | Sigma |
| A | 13 | 254 | 10242 | 50.4 | 946 | 931 | 184.7 |
| A | 0 | 226 | 8220 | 39.45 | 946 | 931 | 184.7 |
| A | 3 | 137 | 7625 | 36.23 | 946 | 931 | 184.7 |
| B | 15 | 33 | 72576 | 413.95 | 924 | 903 | 173.1 |
| B | 3 | 64 | 44737 | 253.16 | 924 | 903 | 173.1 |
| B | 0 | 190 | 31256 | 175.3 | 924 | 903 | 173.1 |
| C | 7 | 247 | 172035 | 837.67 | 884 | 893 | 204.3 |
| C | 14 | 238 | 144848 | 704.6 | 884 | 893 | 204.3 |
| C | 2 | 16 | 8665 | 38.04 | 884 | 893 | 204.3 |
| D | 1 | 52 | 973288 | 4113.85 | 898 | 881 | 236.4 |
| D | 10 | 70 | 248161 | 1046.14 | 898 | 881 | 236.4 |
| D | 8 | 195 | 201967 | 850.71 | 898 | 881 | 236.4 |
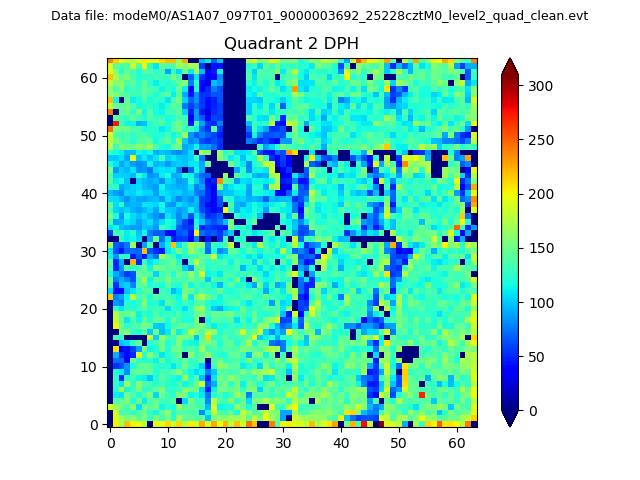
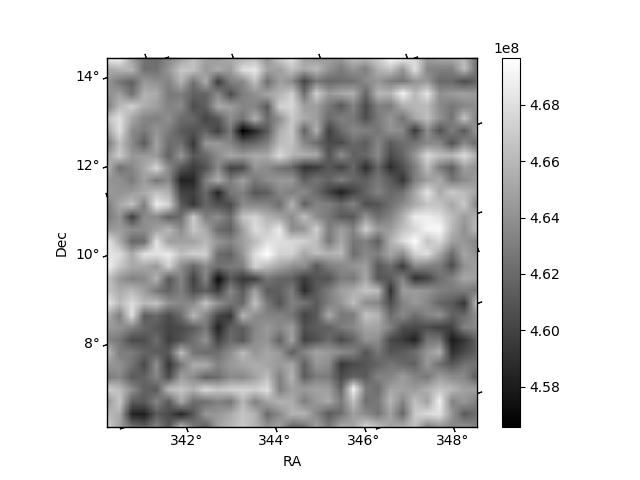
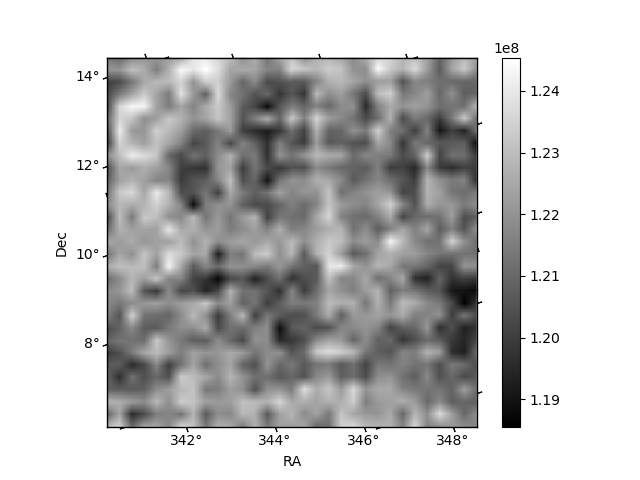
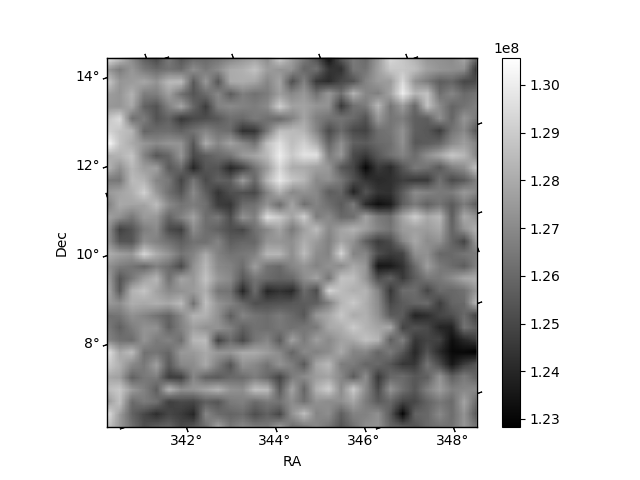
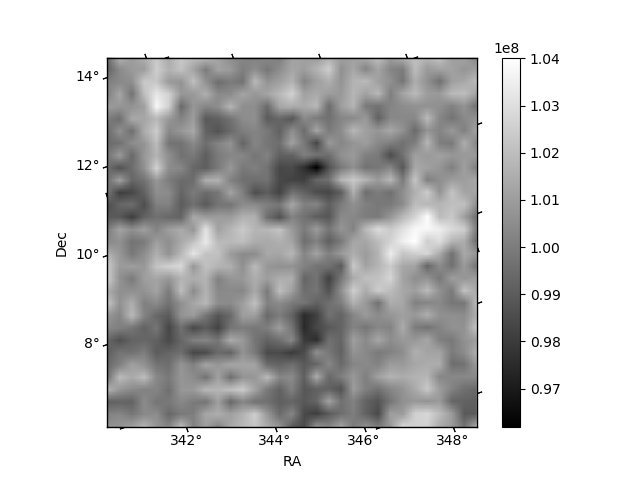
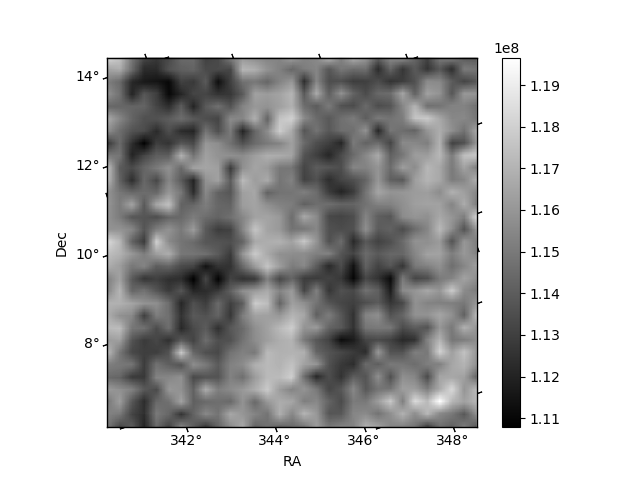
Histogram calculated using DETX and DETY for each event in the final _common_clean file
| Quadrant A | 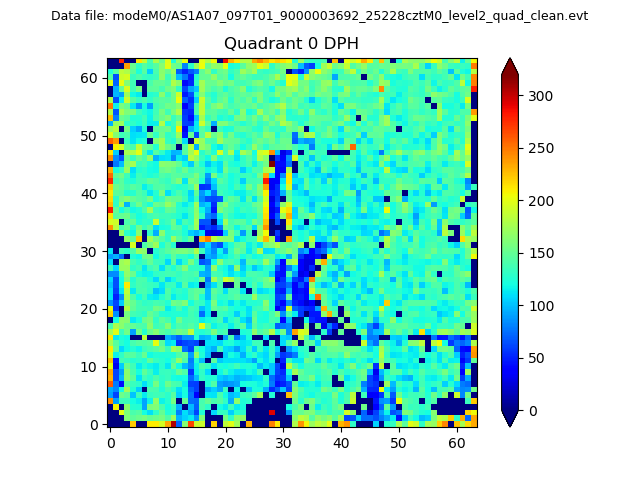 |
 |
Quadrant B |
|---|---|---|---|
| Quadrant D | 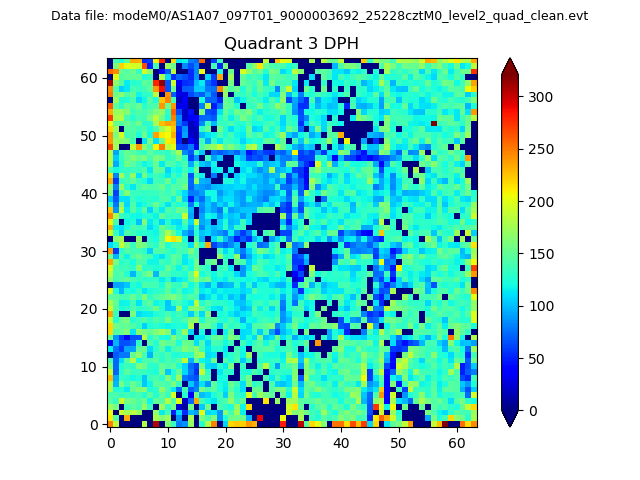 |
 |
Quadrant C |
| Plot type | Count rate plots | Images |
|---|---|---|
| Comparison with Poisson distribution Blue bars denote a histogram of data divided into 1 sec bins. Red curve is a Poisson curve with rate = median count rate of data. |
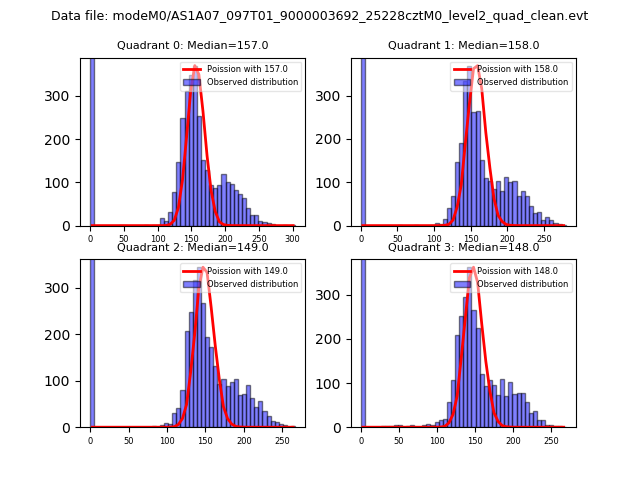 |
 |
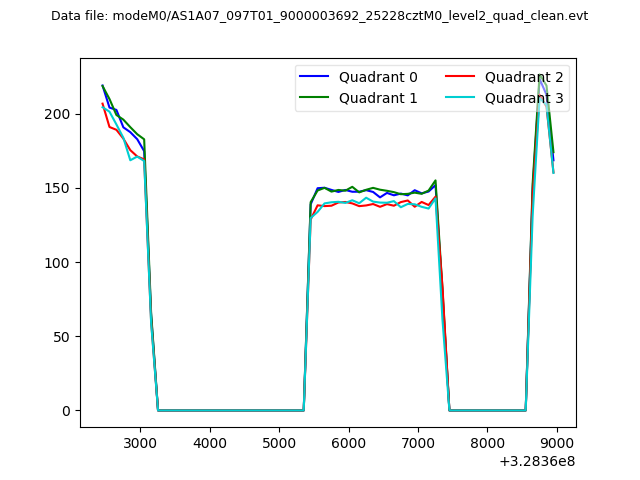
| Quadrant-wise count rates Data is divided into 100 sec bins |
 |
|
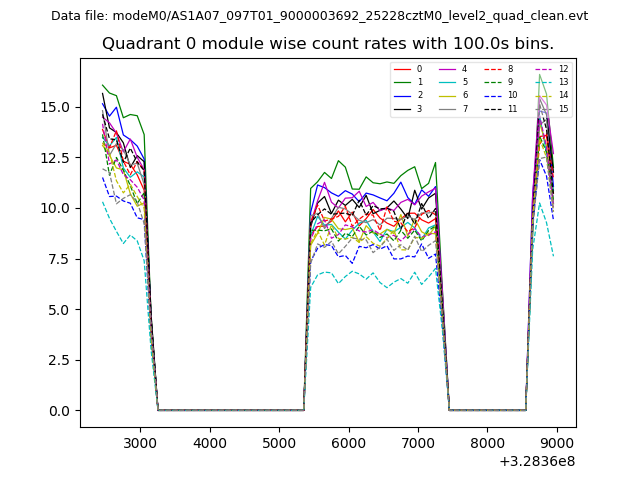
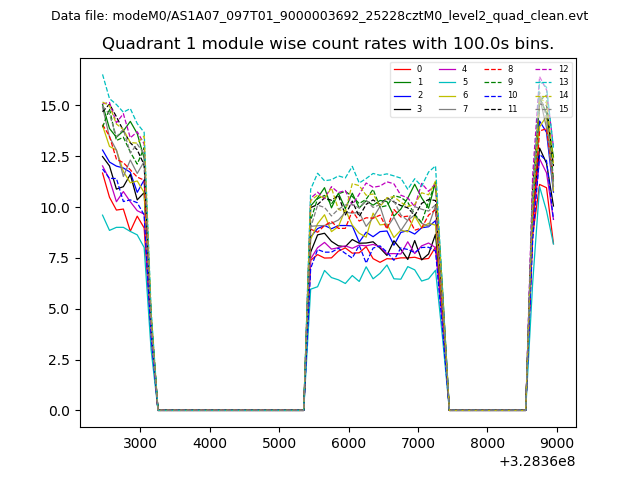
| Module-wise count rates for Quadrant A Data is divided into 100 sec bins |
 |
 |
| Module-wise count rates for Quadrant B Data is divided into 100 sec bins |
 |
 |
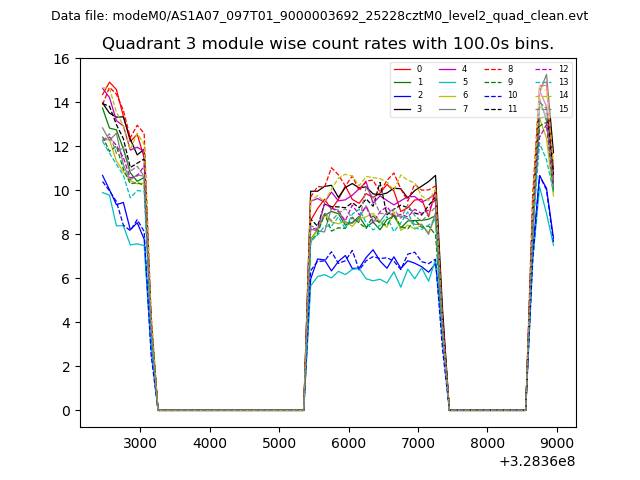
| Module-wise count rates for Quadrant C Data is divided into 100 sec bins |
 |
 |
| Module-wise count rates for Quadrant D Data is divided into 100 sec bins |
 |
 |
| Parameter | Plot |
|---|---|
| CZT HV Monitor | 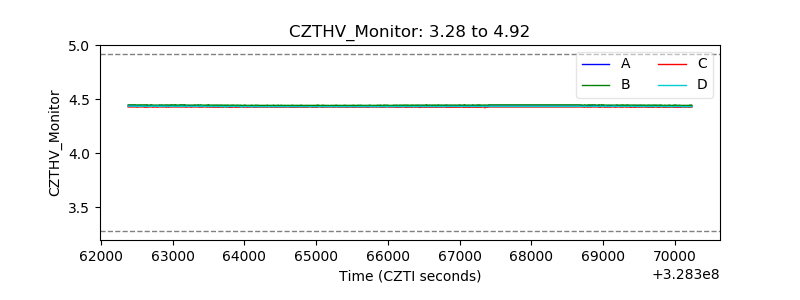 |
| D_VDD | 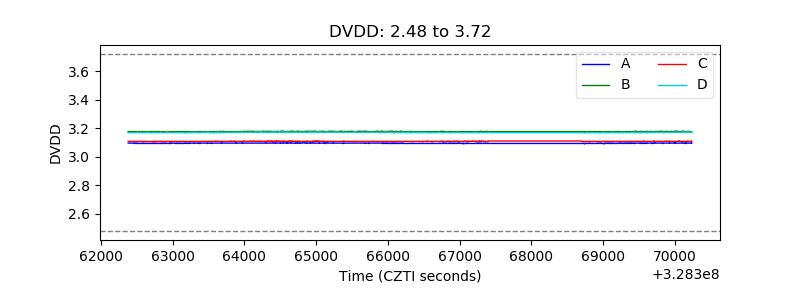 |
| Temperature 1 | 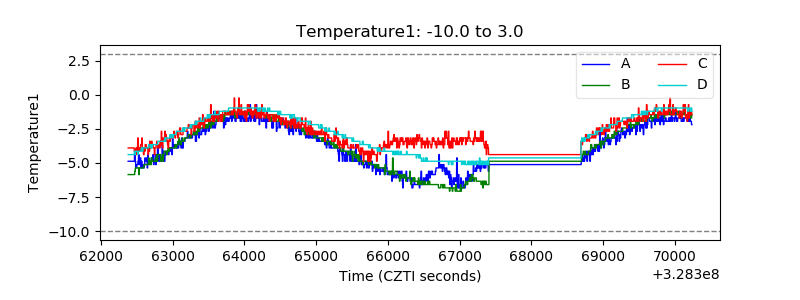 |
| Veto HV Monitor | 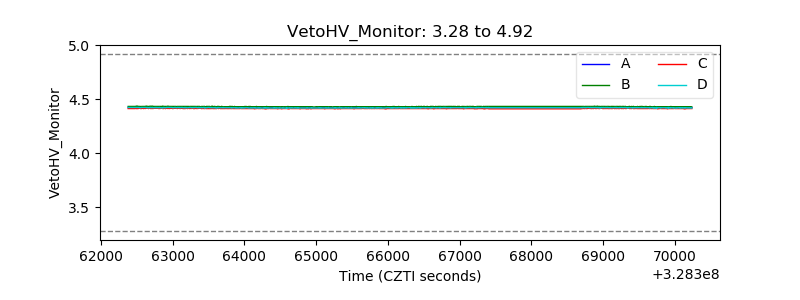 |
| Veto LLD | 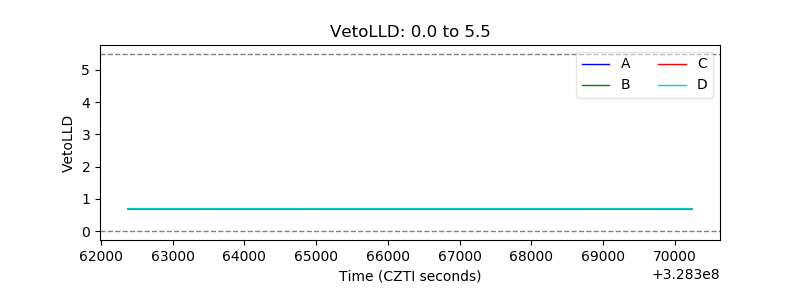 |
| Alpha Counter | 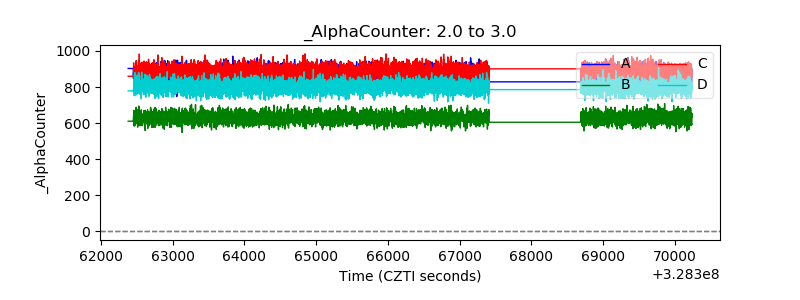 |
| _CPM_Rate | 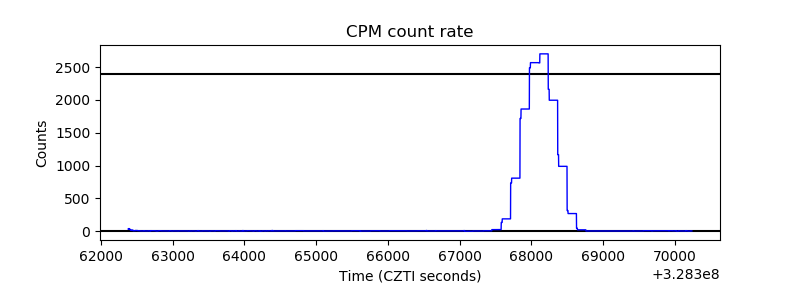 |
| CZT Counter |  |
| +2.5 Volts monitor |  |
| +5 Volts monitor |  |
| _ROLL_ROT | 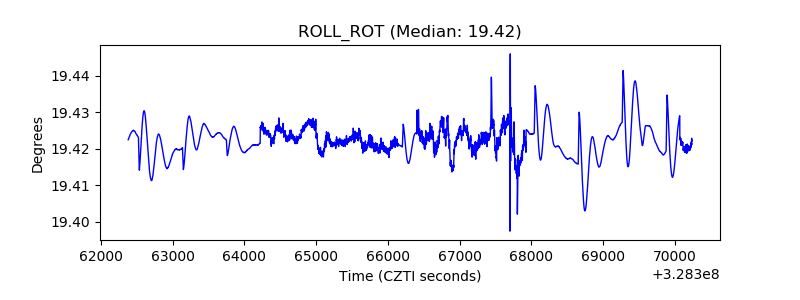 |
| _Roll_DEC | 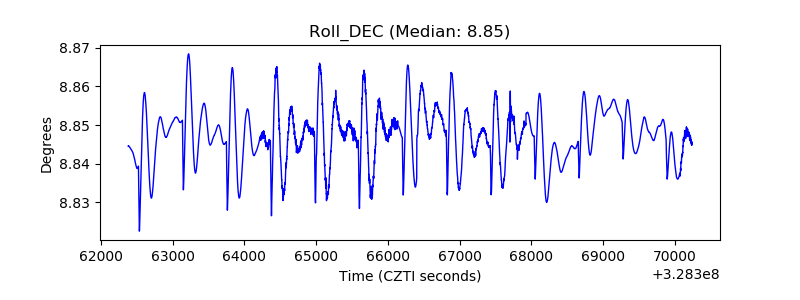 |
| _Roll_RA | 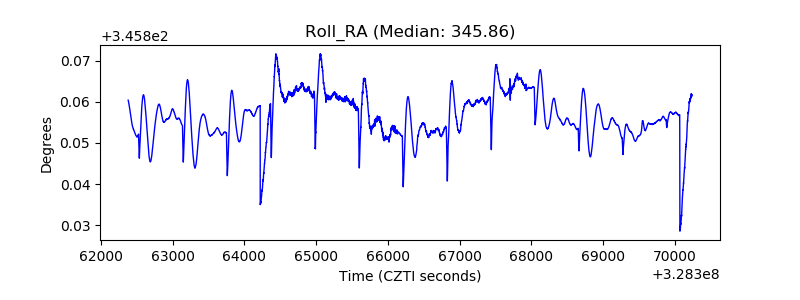 |
| Veto Counter |  |