| Param | Original file | Final file |
|---|---|---|
| Filename | modeM0/AS1A07_097T01_9000003692_25229cztM0_level2.evt | modeM0/AS1A07_097T01_9000003692_25229cztM0_level2_quad_clean.evt |
| Size (bytes) | 521,628,480 | 60,903,360 |
| Size | 497.5 MB | 58.1 MB |
| Events in quadrant A | 3,492,968 | 362,157 |
| Events in quadrant B | 3,516,925 | 362,631 |
| Events in quadrant C | 3,600,389 | 343,289 |
| Events in quadrant D | 4,770,839 | 346,724 |
| Mode M0 | |||
|---|---|---|---|
| Quadrant | BADHDUFLAG | Total packets | Discarded packets |
| A | 0 | 14261 | 0 |
| B | 0 | 14314 | 0 |
| C | 0 | 14534 | 0 |
| D | 0 | 18630 | 0 |
| Mode M9 | |||
|---|---|---|---|
| Quadrant | BADHDUFLAG | Total packets | Discarded packets |
| A | 0 | 13 | 0 |
| B | 0 | 13 | 0 |
| C | 0 | 13 | 0 |
| D | 0 | 13 | 0 |
| Quadrant | Total seconds | Saturated seconds | Saturation percentage |
|---|---|---|---|
| A | 6149 | 99 | 1.610018% |
| B | 6150 | 103 | 1.674797% |
| C | 6149 | 154 | 2.504472% |
| D | 6149 | 345 | 5.610668% |
Noise dominated data is calculated using 1-second bins in cleaned event files. If a bin has >2000 counts, and if more than 50% of those come from <1% of pixels, then it is considered to be noise-dominated and hence unusable.
| Quadrant | # 1 sec bins | Bins with >0 counts | Bins with >2000 counts | High rate bins dominated by noise | Noise dominated (total time) | Noise dominated (detector-on time) | Marked lightcurve |
|---|---|---|---|---|---|---|---|
| A | 7474 | 6150 | 0 | 0 | 0.00% | 0.00% | 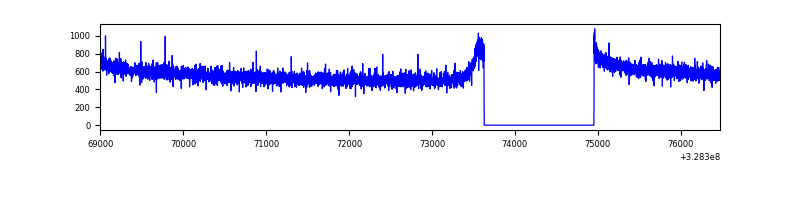 |
| B | 7475 | 6151 | 1 | 1 | 0.01% | 0.02% | 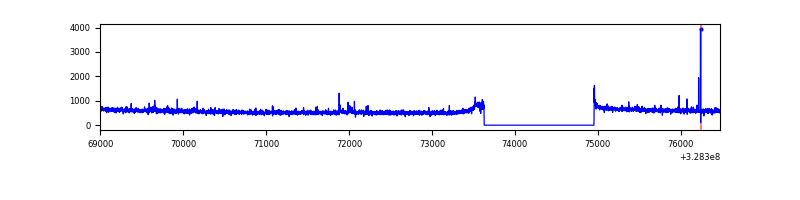 |
| C | 7474 | 6150 | 10 | 10 | 0.13% | 0.16% | 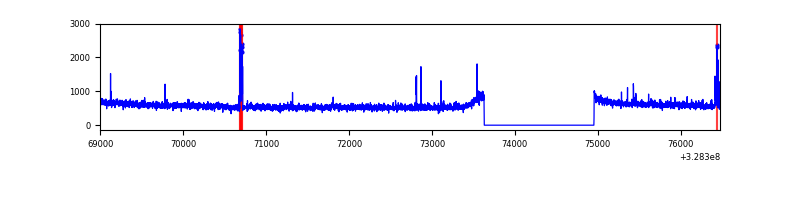 |
| D | 7474 | 6150 | 222 | 222 | 2.97% | 3.61% | 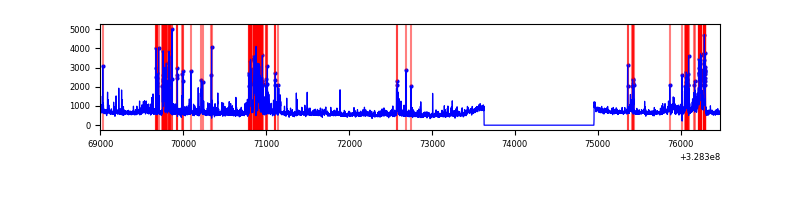 |
Top three noisy pixels from each quadrant. If the there are fewer than three noisy pixels in the level2.evt file, extra rows are filled as -1
| Pixel properties | Quadrant properties | ||||||
|---|---|---|---|---|---|---|---|
| Quadrant | DetID | PixID | Counts | Sigma | Mean | Median | Sigma |
| A | 13 | 254 | 10146 | 52.12 | 904 | 890 | 177.6 |
| A | 0 | 226 | 7908 | 39.52 | 904 | 890 | 177.6 |
| A | 3 | 137 | 7308 | 36.14 | 904 | 890 | 177.6 |
| B | 12 | 111 | 18865 | 108.34 | 886 | 866 | 166.1 |
| B | 3 | 64 | 17244 | 98.59 | 886 | 866 | 166.1 |
| B | 11 | 111 | 16851 | 96.22 | 886 | 866 | 166.1 |
| C | 14 | 238 | 139906 | 709.37 | 850 | 859 | 196.0 |
| C | 2 | 16 | 103514 | 523.71 | 850 | 859 | 196.0 |
| C | 7 | 247 | 33290 | 165.45 | 850 | 859 | 196.0 |
| D | 10 | 70 | 524694 | 2295.4 | 855 | 840 | 228.2 |
| D | 1 | 52 | 497522 | 2176.34 | 855 | 840 | 228.2 |
| D | 8 | 195 | 233929 | 1021.34 | 855 | 840 | 228.2 |
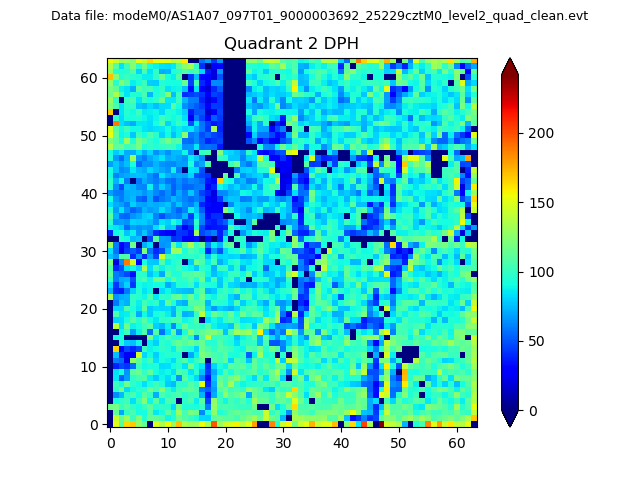
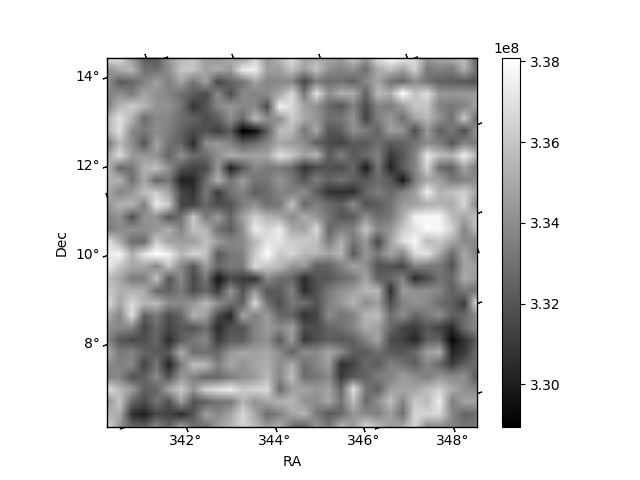
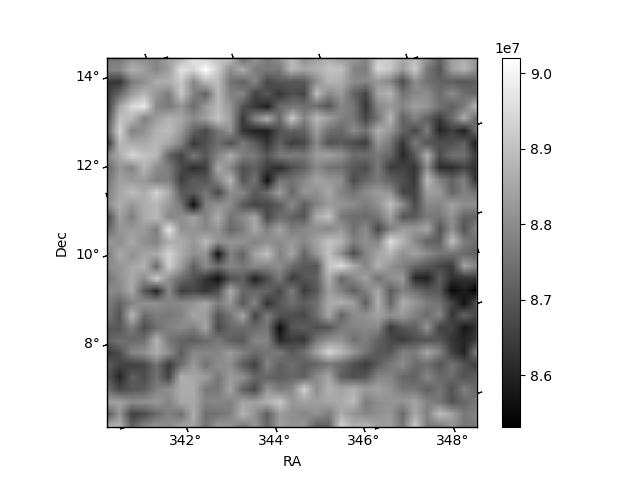
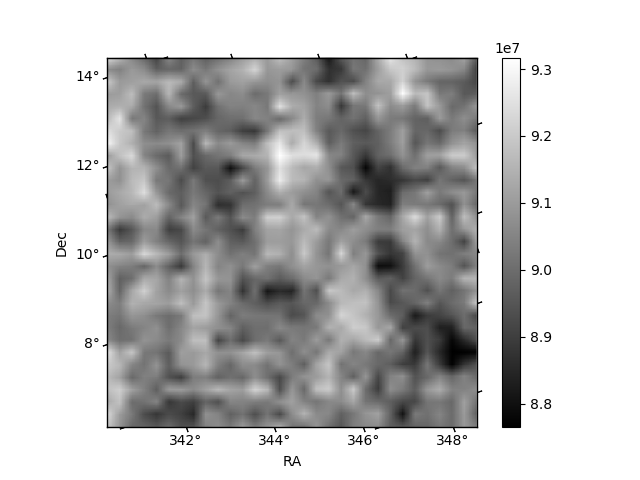
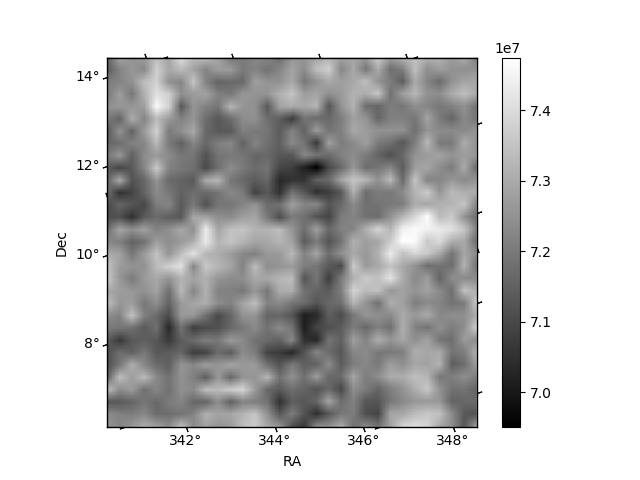
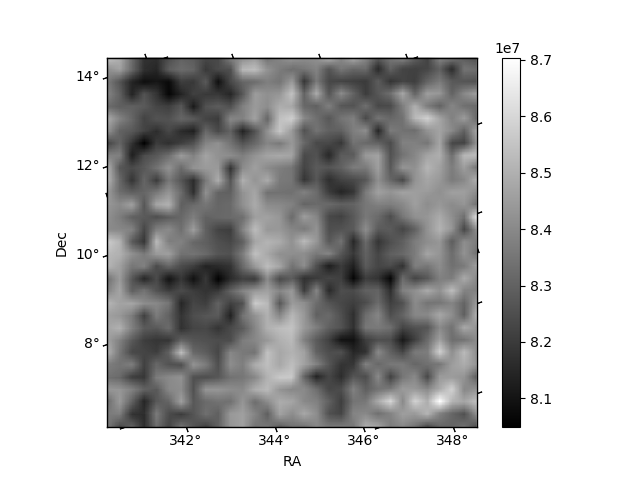
Histogram calculated using DETX and DETY for each event in the final _common_clean file
| Quadrant A | 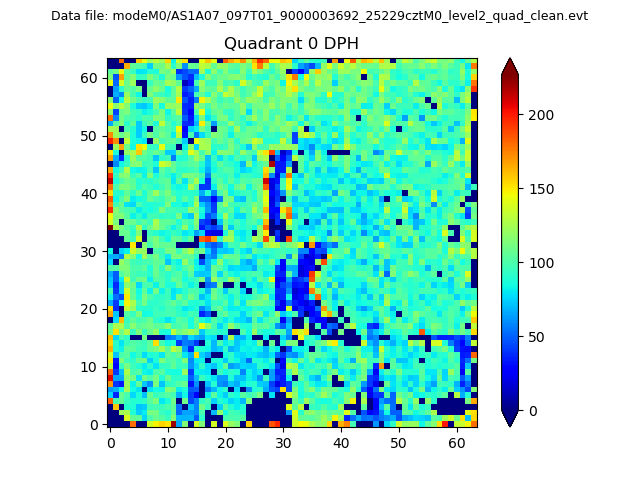 |
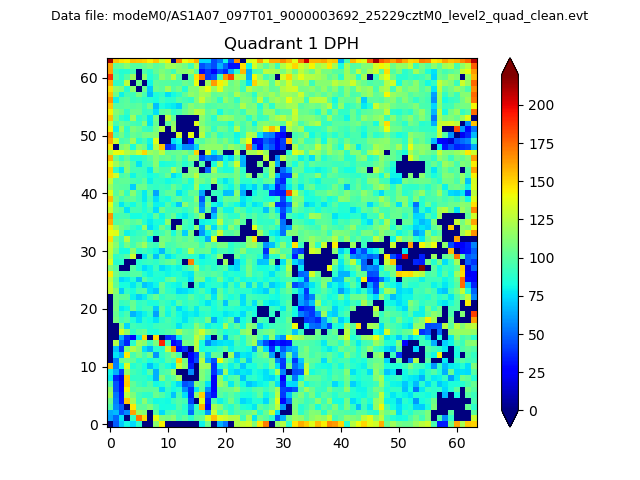 |
Quadrant B |
|---|---|---|---|
| Quadrant D | 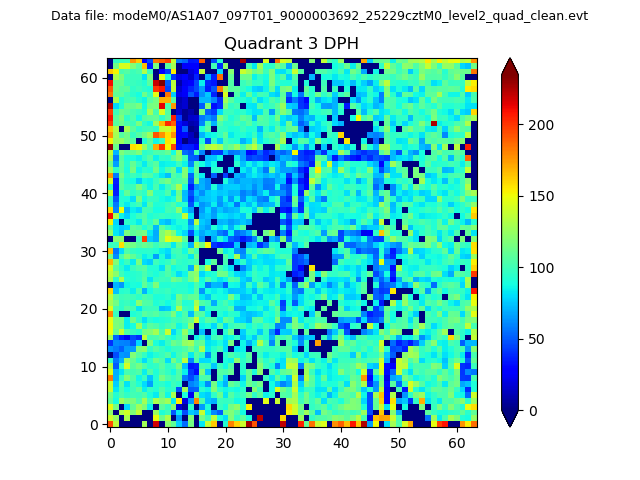 |
 |
Quadrant C |
| Plot type | Count rate plots | Images |
|---|---|---|
| Comparison with Poisson distribution Blue bars denote a histogram of data divided into 1 sec bins. Red curve is a Poisson curve with rate = median count rate of data. |
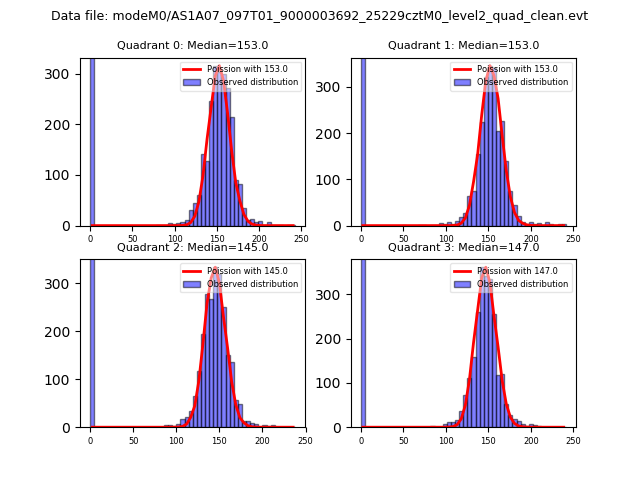 |
 |
| Quadrant-wise count rates Data is divided into 100 sec bins |
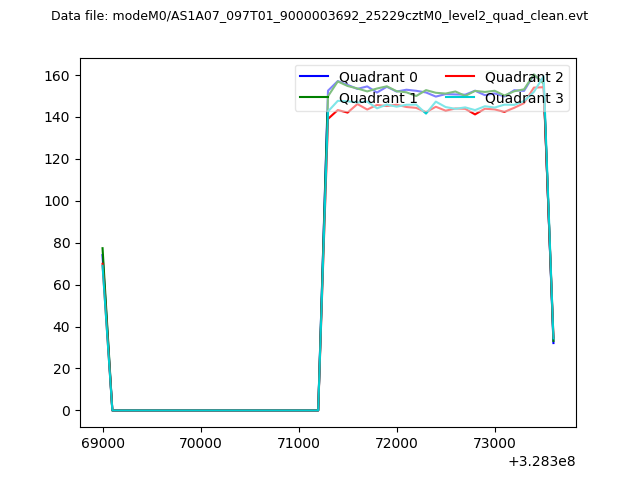 |
|
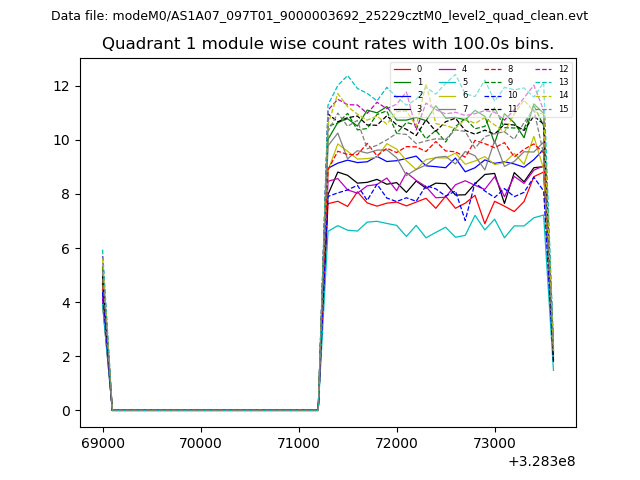
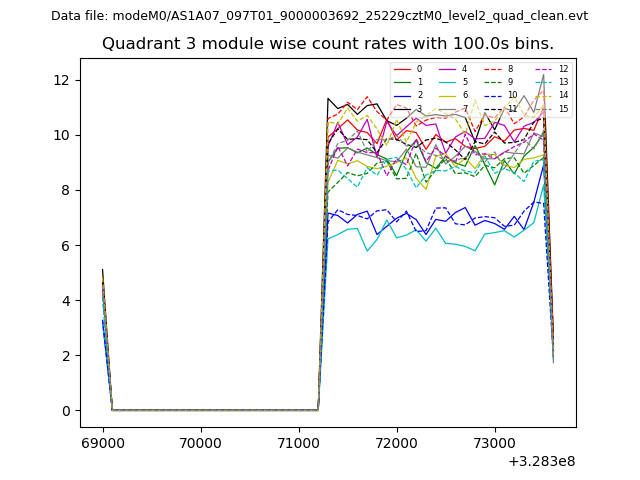
| Module-wise count rates for Quadrant A Data is divided into 100 sec bins |
 |
 |
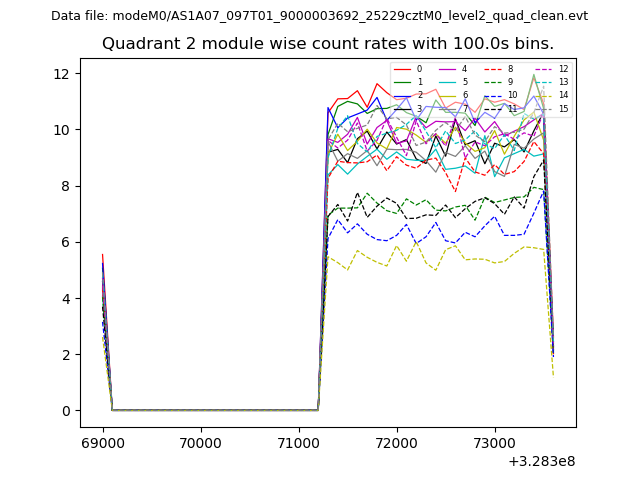
| Module-wise count rates for Quadrant B Data is divided into 100 sec bins |
 |
 |
| Module-wise count rates for Quadrant C Data is divided into 100 sec bins |
 |
 |
| Module-wise count rates for Quadrant D Data is divided into 100 sec bins |
 |
 |
| Parameter | Plot |
|---|---|
| CZT HV Monitor | 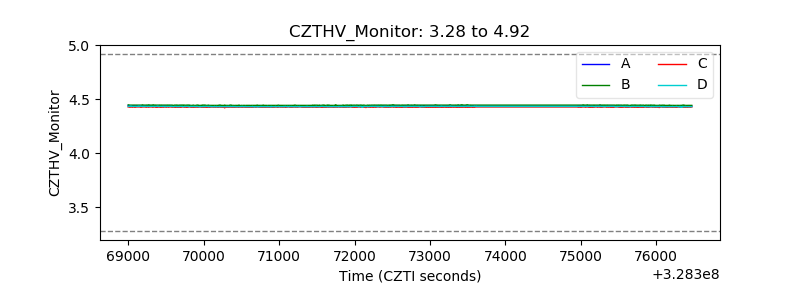 |
| D_VDD | 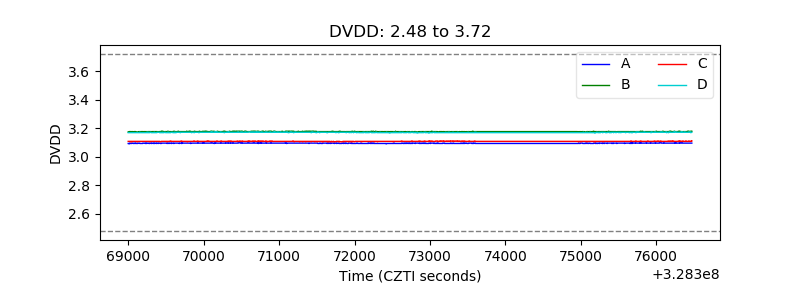 |
| Temperature 1 |  |
| Veto HV Monitor | 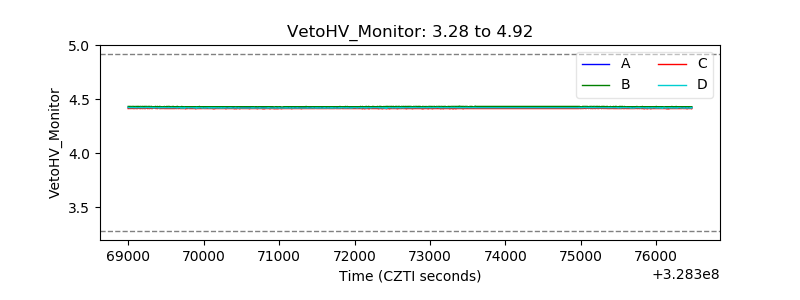 |
| Veto LLD | 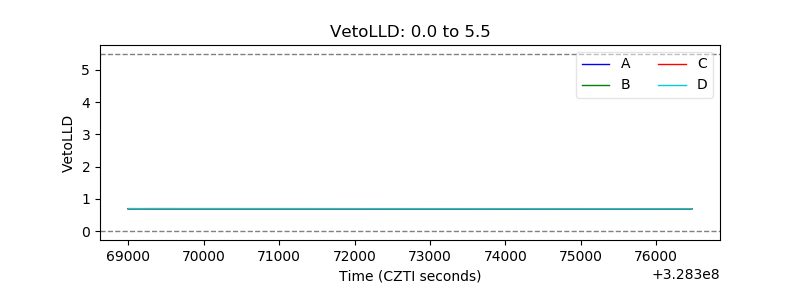 |
| Alpha Counter | 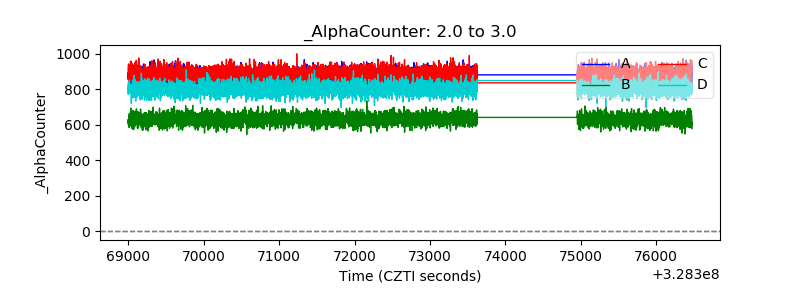 |
| _CPM_Rate | 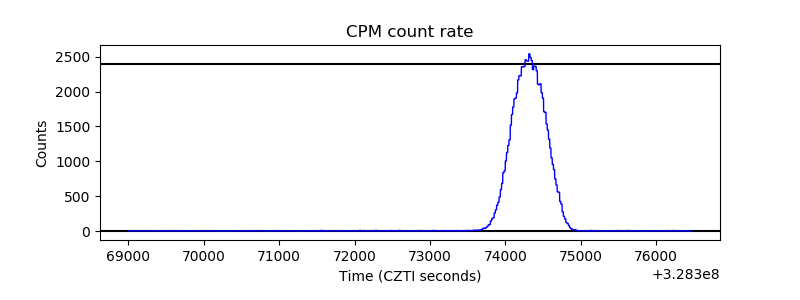 |
| CZT Counter | 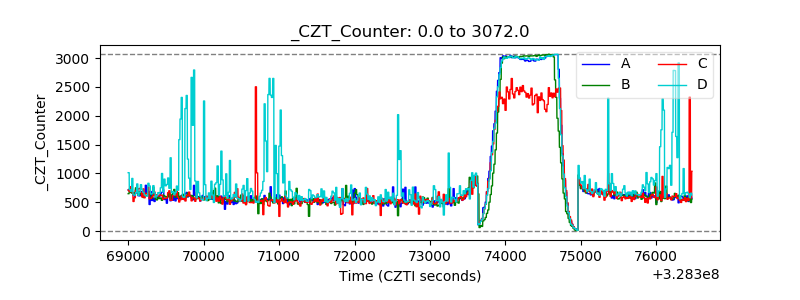 |
| +2.5 Volts monitor | 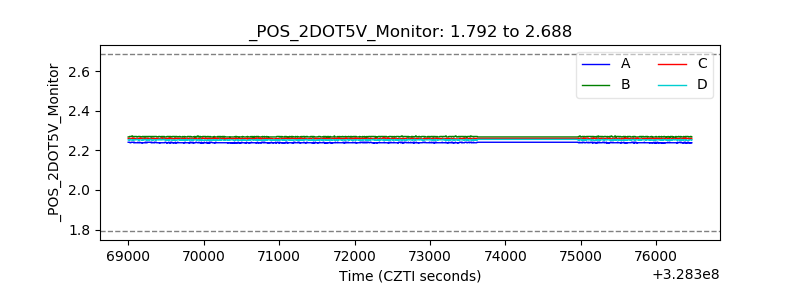 |
| +5 Volts monitor |  |
| _ROLL_ROT | 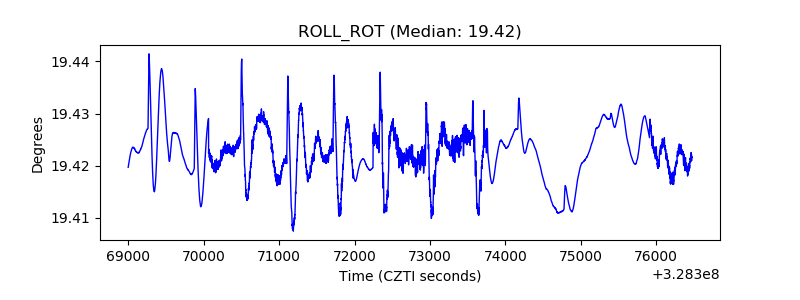 |
| _Roll_DEC | 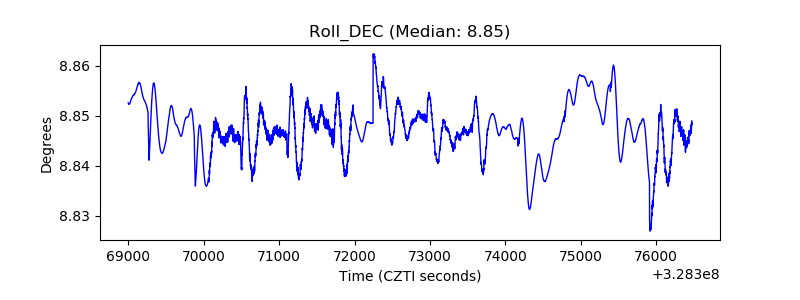 |
| _Roll_RA | 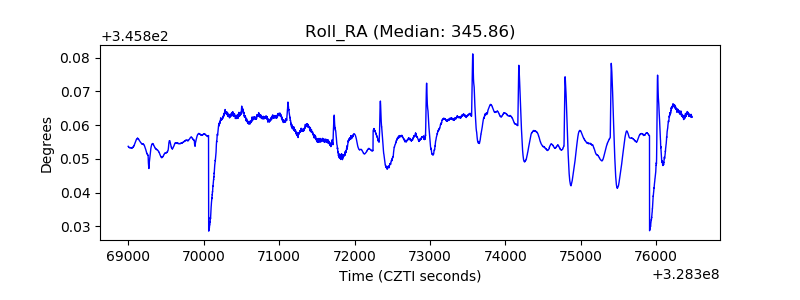 |
| Veto Counter | 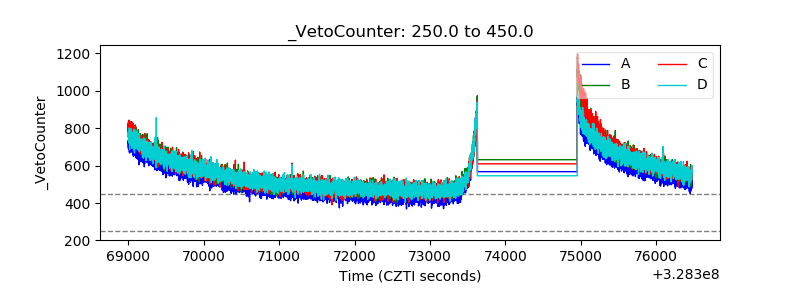 |