| Param | Original file | Final file |
|---|---|---|
| Filename | modeM0/AS1A07_097T01_9000003692_25230cztM0_level2.evt | modeM0/AS1A07_097T01_9000003692_25230cztM0_level2_quad_clean.evt |
| Size (bytes) | 545,808,960 | 68,448,960 |
| Size | 520.5 MB | 65.3 MB |
| Events in quadrant A | 3,567,976 | 416,651 |
| Events in quadrant B | 3,834,579 | 419,981 |
| Events in quadrant C | 3,803,934 | 397,435 |
| Events in quadrant D | 4,895,833 | 398,086 |
| Mode M0 | |||
|---|---|---|---|
| Quadrant | BADHDUFLAG | Total packets | Discarded packets |
| A | 0 | 14631 | 0 |
| B | 0 | 15453 | 0 |
| C | 0 | 15374 | 0 |
| D | 0 | 18962 | 0 |
| Mode M9 | |||
|---|---|---|---|
| Quadrant | BADHDUFLAG | Total packets | Discarded packets |
| A | 0 | 13 | 0 |
| B | 0 | 13 | 0 |
| C | 0 | 13 | 0 |
| D | 0 | 13 | 0 |
| Quadrant | Total seconds | Saturated seconds | Saturation percentage |
|---|---|---|---|
| A | 6308 | 124 | 1.965758% |
| B | 6309 | 193 | 3.059122% |
| C | 6309 | 181 | 2.868917% |
| D | 6309 | 331 | 5.246473% |
Noise dominated data is calculated using 1-second bins in cleaned event files. If a bin has >2000 counts, and if more than 50% of those come from <1% of pixels, then it is considered to be noise-dominated and hence unusable.
| Quadrant | # 1 sec bins | Bins with >0 counts | Bins with >2000 counts | High rate bins dominated by noise | Noise dominated (total time) | Noise dominated (detector-on time) | Marked lightcurve |
|---|---|---|---|---|---|---|---|
| A | 7598 | 6310 | 0 | 0 | 0.00% | 0.00% | 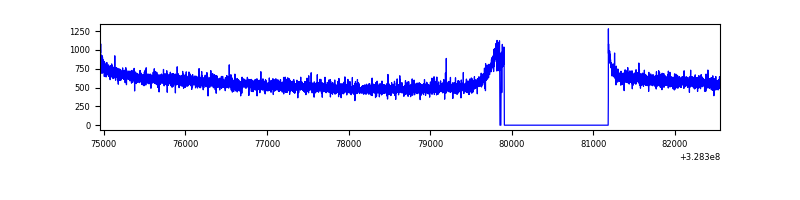 |
| B | 7599 | 6311 | 19 | 19 | 0.25% | 0.30% | 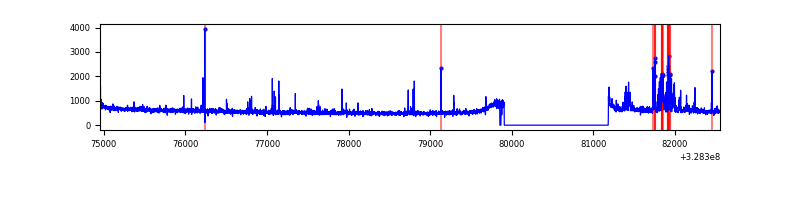 |
| C | 7599 | 6311 | 8 | 8 | 0.11% | 0.13% | 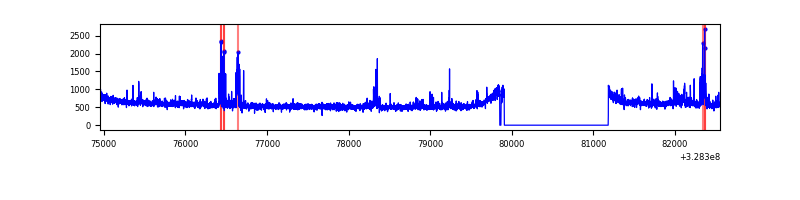 |
| D | 7599 | 6311 | 158 | 158 | 2.08% | 2.50% | 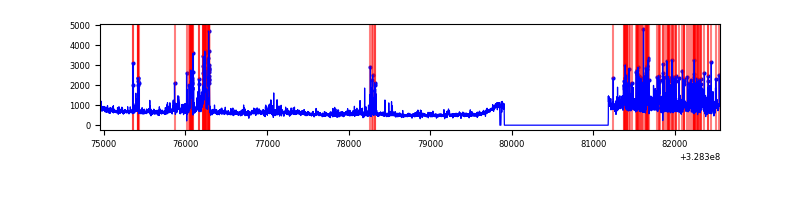 |
Top three noisy pixels from each quadrant. If the there are fewer than three noisy pixels in the level2.evt file, extra rows are filled as -1
| Pixel properties | Quadrant properties | ||||||
|---|---|---|---|---|---|---|---|
| Quadrant | DetID | PixID | Counts | Sigma | Mean | Median | Sigma |
| A | 13 | 254 | 10055 | 50.19 | 925 | 908 | 182.3 |
| A | 0 | 226 | 8047 | 39.17 | 925 | 908 | 182.3 |
| A | 3 | 137 | 7585 | 36.64 | 925 | 908 | 182.3 |
| B | 0 | 189 | 183994 | 1076.47 | 907 | 889 | 170.1 |
| B | 0 | 190 | 37777 | 216.86 | 907 | 889 | 170.1 |
| B | 3 | 64 | 20980 | 118.11 | 907 | 889 | 170.1 |
| C | 2 | 16 | 228787 | 1135.13 | 878 | 888 | 200.8 |
| C | 14 | 238 | 141428 | 700.01 | 878 | 888 | 200.8 |
| C | 13 | 61 | 6122 | 26.07 | 878 | 888 | 200.8 |
| D | 1 | 52 | 613016 | 2860.67 | 893 | 871 | 214.0 |
| D | 10 | 70 | 358536 | 1671.44 | 893 | 871 | 214.0 |
| D | 1 | 239 | 176843 | 822.35 | 893 | 871 | 214.0 |
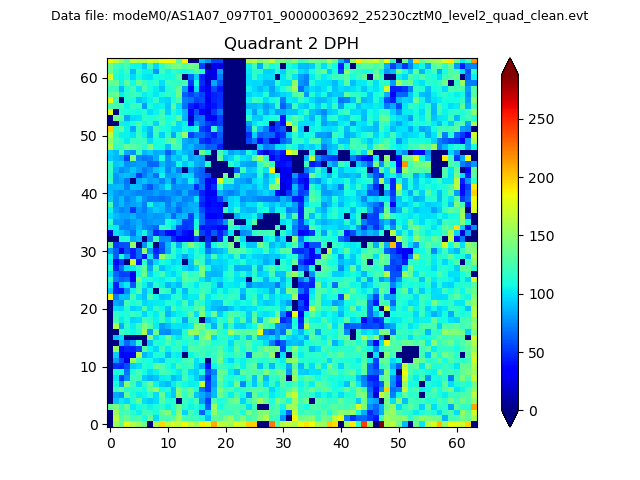
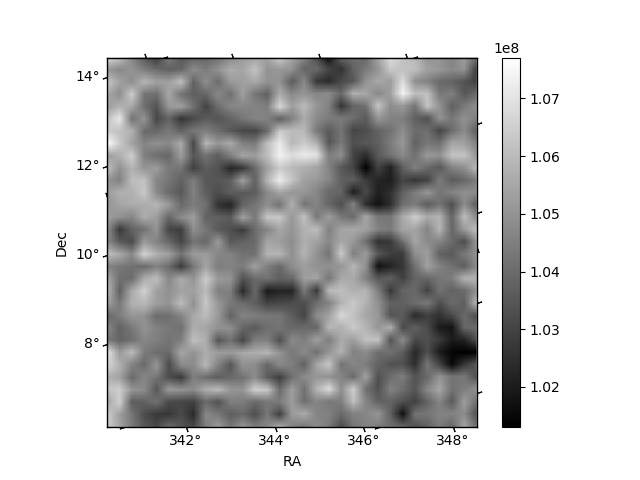
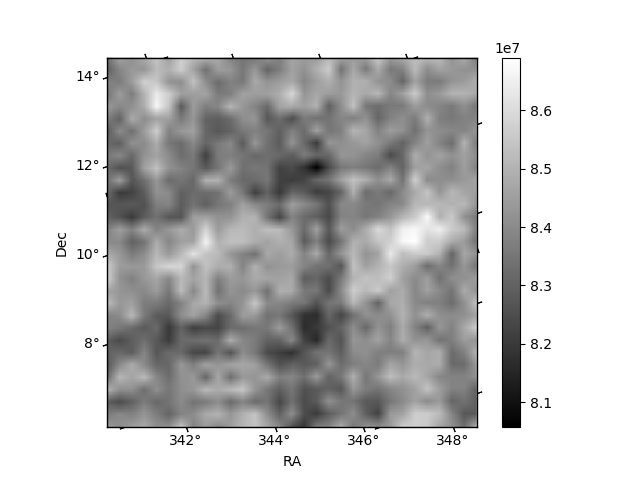
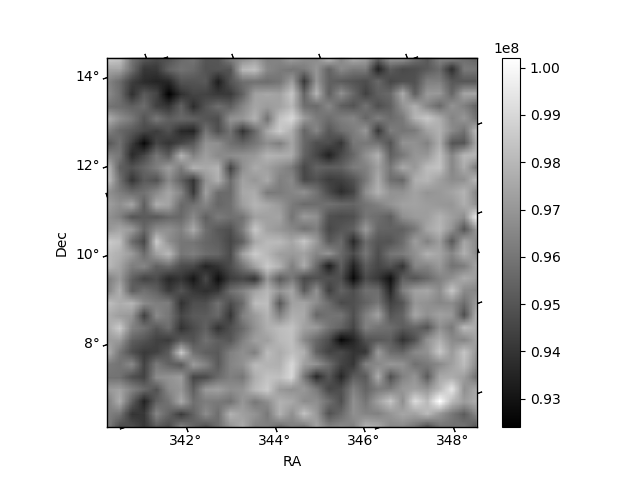
Histogram calculated using DETX and DETY for each event in the final _common_clean file
| Quadrant A | 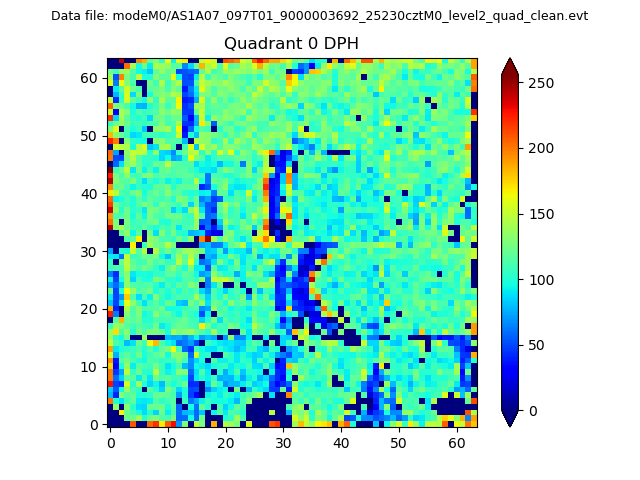 |
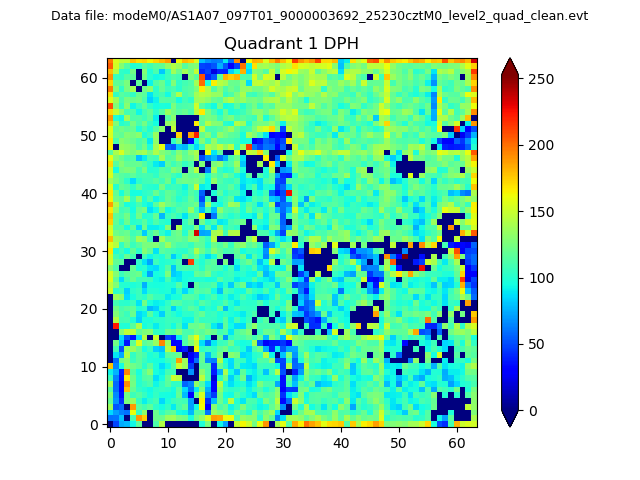 |
Quadrant B |
|---|---|---|---|
| Quadrant D | 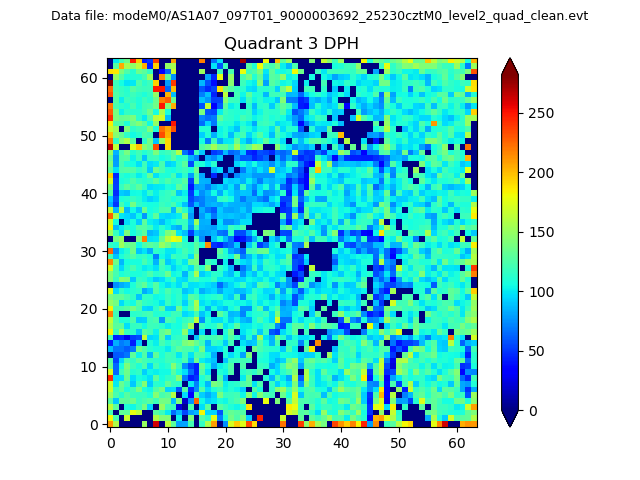 |
 |
Quadrant C |
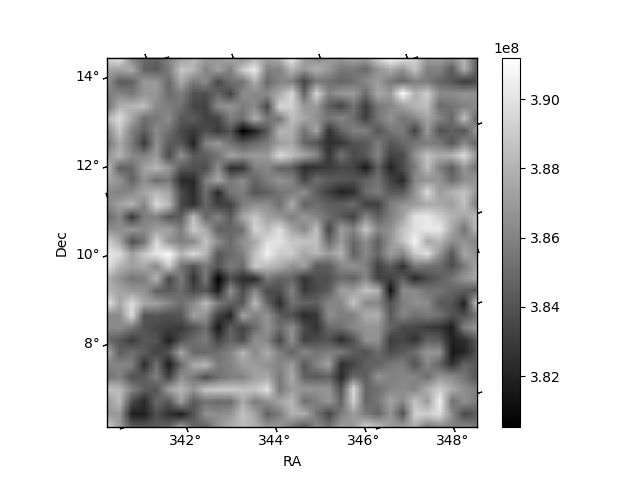
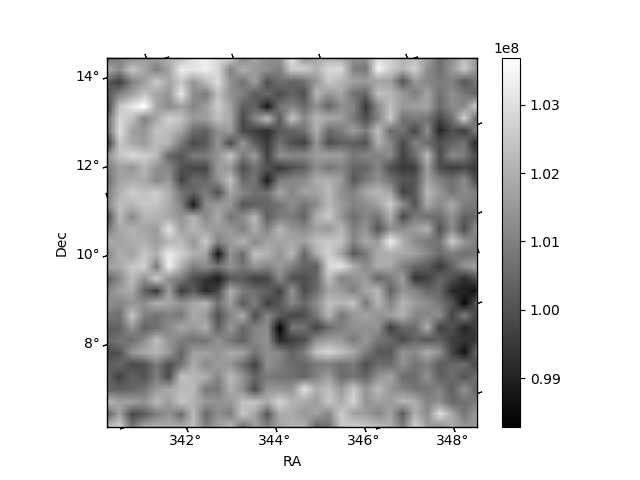
| Plot type | Count rate plots | Images |
|---|---|---|
| Comparison with Poisson distribution Blue bars denote a histogram of data divided into 1 sec bins. Red curve is a Poisson curve with rate = median count rate of data. |
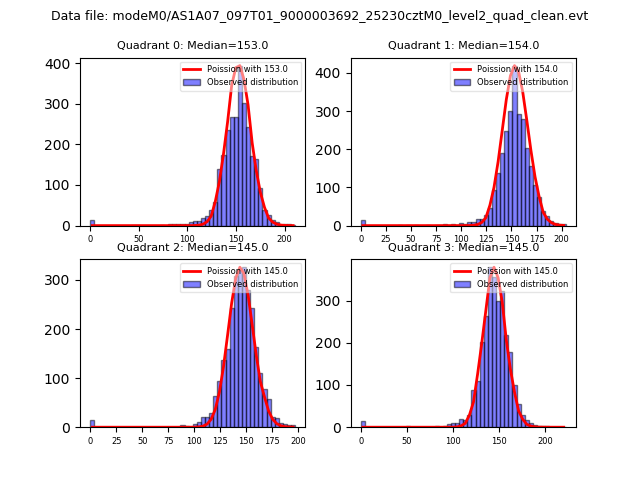 |
 |
| Quadrant-wise count rates Data is divided into 100 sec bins |
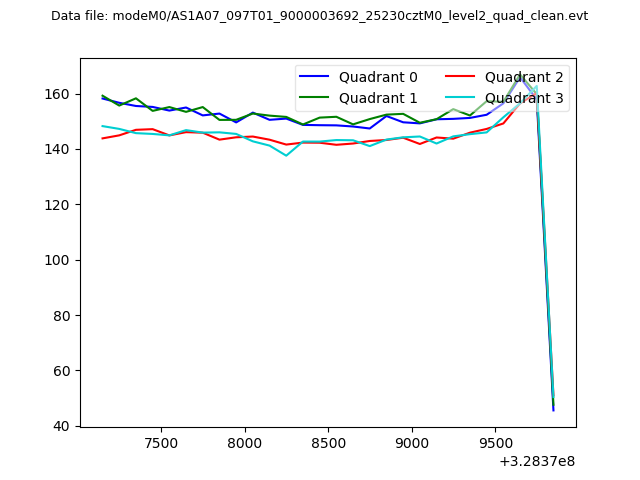 |
|
| Module-wise count rates for Quadrant A Data is divided into 100 sec bins |
 |
 |
| Module-wise count rates for Quadrant B Data is divided into 100 sec bins |
 |
 |
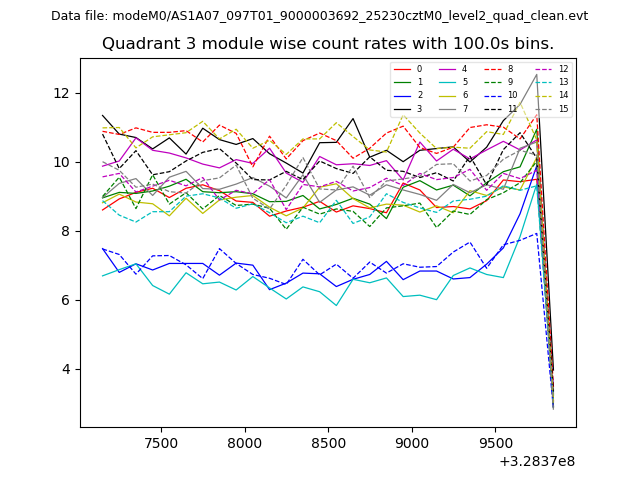
| Module-wise count rates for Quadrant C Data is divided into 100 sec bins |
 |
 |
| Module-wise count rates for Quadrant D Data is divided into 100 sec bins |
 |
 |
| Parameter | Plot |
|---|---|
| CZT HV Monitor | 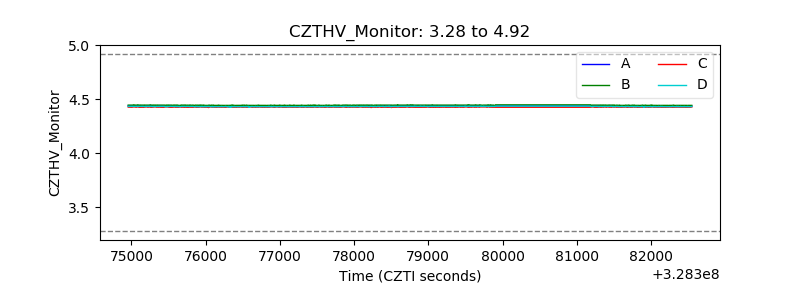 |
| D_VDD |  |
| Temperature 1 | 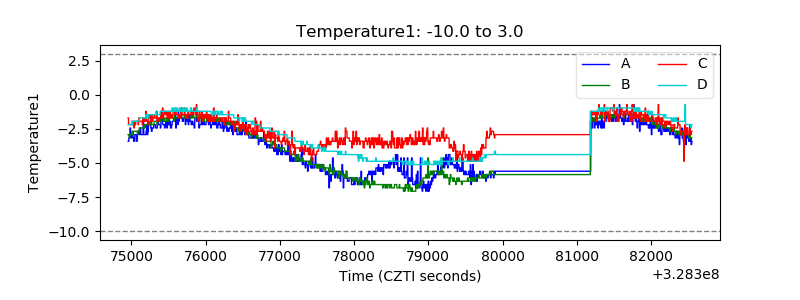 |
| Veto HV Monitor | 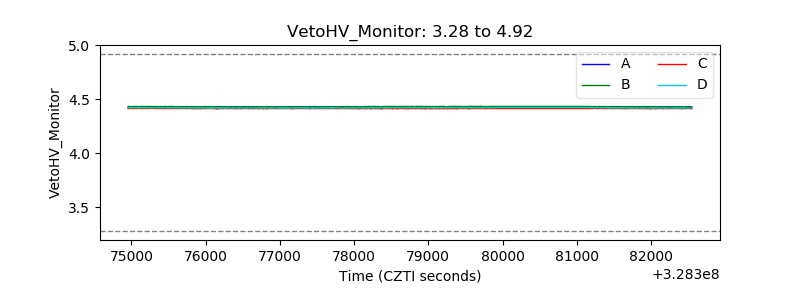 |
| Veto LLD |  |
| Alpha Counter | 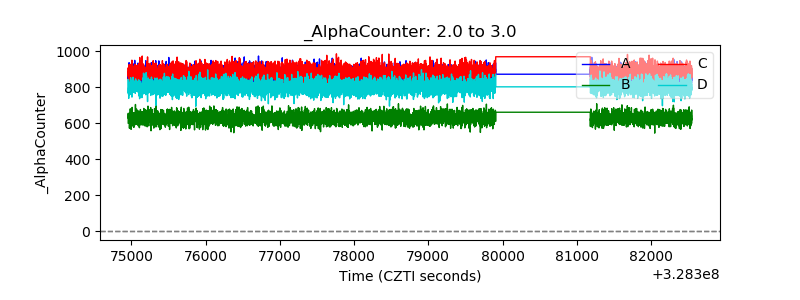 |
| _CPM_Rate | 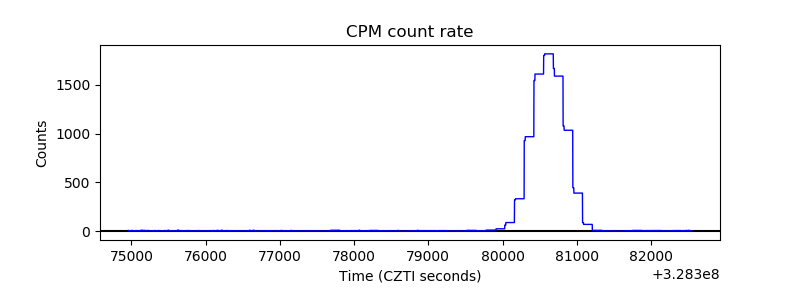 |
| CZT Counter | 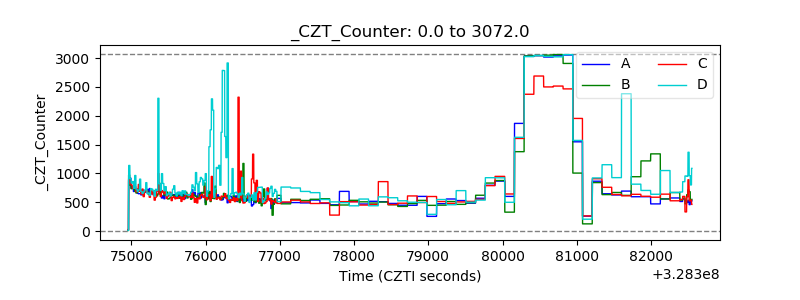 |
| +2.5 Volts monitor |  |
| +5 Volts monitor |  |
| _ROLL_ROT | 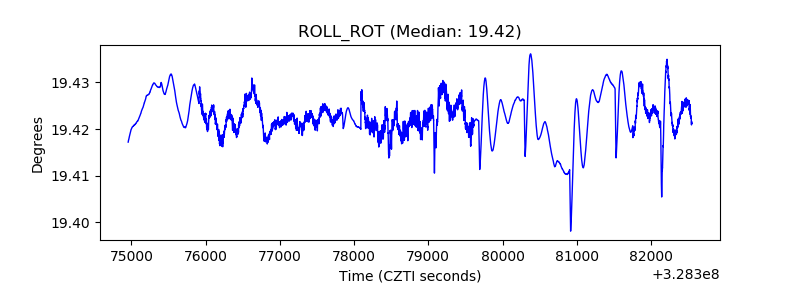 |
| _Roll_DEC | 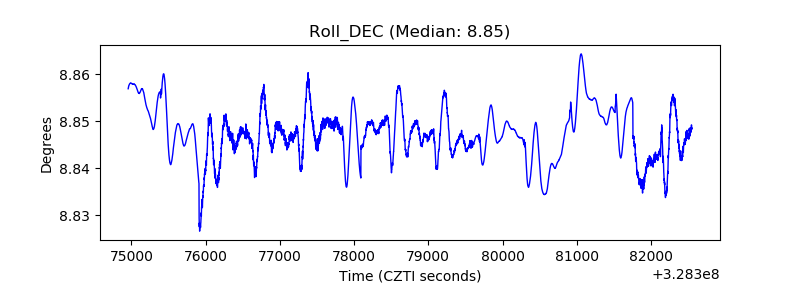 |
| _Roll_RA | 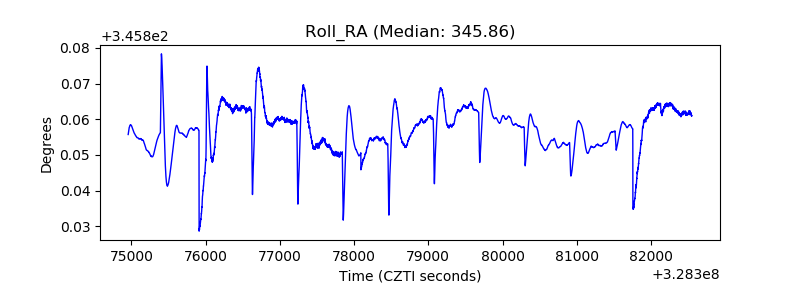 |
| Veto Counter |  |